Total Market Overview for North Portland Area 141
•
0 recomendaciones•506 vistas

This document provides a market overview of residential single family and condo properties for 4 areas in the Portland, Oregon region. It includes data on active and pending listings, homes sold in the last 90 days, average original and sold list prices, average days on market, and average price per square foot for various price ranges. The areas covered are North Portland, Northeast Portland, Southeast Portland, and Gresham Troutdale.

Recomendados
Más contenido relacionado
La actualidad más candente
La actualidad más candente (20)
Destacado
Similar a Total Market Overview for North Portland Area 141
Similar a Total Market Overview for North Portland Area 141 (20)
Más de Keller Williams Realty Professionals
Más de Keller Williams Realty Professionals (19)
Último
Último (20)
Total Market Overview for North Portland Area 141
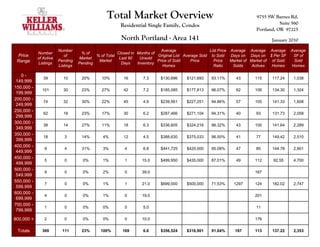
- 1. Total Market Overview 9755 SW Barnes Rd. Residential Single Family, Condos Suite 560 Portland, OR 97225 North Portland - Area 141 January 2010 Number Average List Price Average Average Average Average Number % of Closed in Months of Price of % of Total Original List Average Sold to Sold Days on Days on $ Per SF SF of of Active Market Last 90 Unsold Range Pending Market Price of Sold Price Price Market of Market of of Sold Sold Listings Pending Days Inventory Listings Homes Ratio Solds Actives Homes Homes 0- 39 10 20% 10% 16 7.3 $130,696 $121,693 93.11% 43 115 117.24 1,038 149,999 150,000 - 101 30 23% 27% 42 7.2 $185,085 $177,813 96.07% 62 106 134.30 1,324 199,999 200,000 - 74 32 30% 22% 45 4.9 $239,561 $227,251 94.86% 57 105 141.33 1,608 249,999 250,000 - 62 18 23% 17% 30 6.2 $287,466 $271,104 94.31% 40 93 131.73 2,058 299,999 300,000 - 38 14 27% 11% 18 6.3 $336,605 $324,216 96.32% 43 100 141.64 2,289 349,999 350,000 - 18 3 14% 4% 12 4.5 $388,630 $375,033 96.50% 41 77 149.42 2,510 399,999 400,000 - 9 4 31% 3% 4 6.8 $441,725 $420,000 95.08% 47 85 144.78 2,901 449,999 450,000 - 5 0 0% 1% 1 15.0 $499,950 $435,000 87.01% 49 112 92.55 4,700 499,999 500,000 - 9 0 0% 2% 0 39.0 167 549,999 550,000 - 7 0 0% 1% 1 21.0 $699,000 $500,000 71.53% 1297 124 182.02 2,747 599,999 600,000 - 4 0 0% 1% 0 19.0 201 699,999 700,000 - 1 0 0% 0% 0 5.0 11 799,999 800,000 + 2 0 0% 0% 0 10.0 176 Totals 369 111 23% 100% 169 6.6 $356,524 $316,901 91.64% 187 113 137.22 2,353
- 2. Total Market Overview 9755 SW Barnes Rd. Residential Single Family, Condos Suite 560 Portland, OR 97225 Northeast Portland - Area 142 January 2010 Number Average List Price Average Average Average Average Number % of Closed in Months of Price of % of Total Original List Average Sold to Sold Days on Days on $ Per SF SF of of Active Market Last 90 Unsold Range Pending Market Price of Sold Price Price Market of Market of of Sold Sold Listings Pending Days Inventory Listings Homes Ratio Solds Actives Homes Homes 0- 85 22 21% 9% 48 5.3 $130,194 $115,301 88.56% 92 126 102.86 1,121 149,999 150,000 - 192 55 22% 22% 85 6.8 $189,858 $178,312 93.92% 97 116 126.91 1,405 199,999 200,000 - 182 52 22% 21% 93 5.9 $236,650 $226,143 95.56% 44 100 134.37 1,683 249,999 250,000 - 143 37 21% 16% 57 7.5 $286,181 $265,422 92.75% 70 98 133.11 1,994 299,999 300,000 - 75 26 26% 9% 50 4.5 $337,926 $319,317 94.49% 65 111 138.05 2,313 349,999 350,000 - 82 22 21% 9% 39 6.3 $385,736 $367,237 95.20% 58 106 163.22 2,250 399,999 400,000 - 25 9 26% 3% 20 3.8 $441,921 $420,120 95.07% 47 111 166.32 2,526 449,999 450,000 - 40 7 15% 4% 17 7.1 $501,167 $472,147 94.21% 48 117 174.22 2,710 499,999 500,000 - 10 2 17% 1% 9 3.3 $561,250 $517,827 92.26% 68 79 184.21 2,811 549,999 550,000 - 15 5 25% 2% 3 15.0 $602,316 $560,000 92.97% 101 99 196.91 2,844 599,999 600,000 - 17 2 11% 2% 8 6.4 $693,237 $649,187 93.65% 70 92 171.11 3,794 699,999 700,000 - 11 0 0% 1% 5 6.6 $805,809 $712,959 88.48% 64 182 207.14 3,442 799,999 800,000 + 13 4 24% 2% 6 6.5 $1,039,650 $908,333 87.37% 85 90 205.97 4,410 Totals 890 243 21% 100% 440 6.1 $477,838 $439,408 92.65% 70 110 $161.88 2,562
- 3. Total Market Overview 9755 SW Barnes Rd. Residential Single Family, Condos Suite 560 Portland, OR 97225 Southeast Portland - Area 143 January 2010 Number Average List Price Average Average Average Average Number % of Closed in Months of Price of % of Total Original List Average Sold to Sold Days on Days on $ Per SF SF of of Active Market Last 90 Unsold Range Pending Market Price of Sold Price Price Market of Market of of Sold Sold Listings Pending Days Inventory Listings Homes Ratio Solds Actives Homes Homes 0- 228 74 25% 18% 148 4.6 $122,935 $130,721 106.33% 84 141 108.30 1,207 149,999 150,000 - 427 86 17% 31% 169 7.6 $184,267 $174,570 94.74% 74 134 127.89 1,365 199,999 200,000 - 213 56 21% 16% 105 6.1 $240,658 $223,856 93.02% 72 124 123.00 1,820 249,999 250,000 - 178 44 20% 14% 91 5.9 $292,768 $271,708 92.81% 73 106 145.30 1,870 299,999 300,000 83 31 27% 7% 39 6.4 $339,166 $322,647 95.13% 49 94 135.06 2,389 349,999 350,000 - 70 18 20% 5% 36 5.8 $386,890 $377,002 97.44% 54 111 150.92 2,498 399,999 400,000 - 35 3 8% 2% 14 7.5 $435,303 $407,678 93.65% 57 112 165.66 2,461 449,999 450,000 - 31 6 16% 2% 11 8.5 $493,163 $470,327 95.37% 37 104 163.54 2,876 499,999 500,000 - 8 3 27% 1% 10 2.4 $538,316 $511,553 95.03% 72 96 160.66 3,184 549,999 550,000 - 13 1 7% 1% 5 7.8 $590,540 $570,136 96.54% 54 151 202.03 2,822 599,999 600,000 - 11 2 15% 1% 2 16.5 $664,900 $650,000 97.76% 158 125 208.40 3,119 699,999 700,000 - 7 0 0% 0% 2 10.5 $807,250 $713,875 88.43% 37 69 170.62 4,184 799,999 800,000 + 12 1 8% 1% 3 12.0 $1,158,166 $941,500 81.29% 143 187 217.29 4,333 Totals 1316 325 20% 100% 635 6.2 $481,102 $443,506 94.43% 74 120 $159.90 2,625
- 4. Total Market Overview 9755 SW Barnes Rd. Residential Single Family, Condos Suite 560 Portland, OR 97225 Gresham Troutdale - Area 144 January 2010 Number Average List Price Average Average Average Average Number % of Closed in Months of Price of % of Total Original List Average Sold to Sold Days on Days on $ Per SF SF of of Active Market Last 90 Unsold Range Pending Market Price of Sold Price Price Market of Market of of Sold Sold Listings Pending Days Inventory Listings Homes Ratio Solds Actives Homes Homes 0- 104 29 22% 13% 38 8.2 $133,660 $125,315 93.76% 59 114 100.98 1,241 149,999 150,000 - 169 41 20% 20% 91 5.6 $185,020 $177,327 95.84% 62 114 119.09 1,489 199,999 200,000 - 234 51 18% 27% 82 8.6 $234,332 $222,847 95.10% 75 127 122.92 1,813 249,999 250,000 - 153 22 13% 17% 31 14.8 $284,454 $266,798 93.79% 94 123 113.19 2,357 299,999 300,000 - 63 9 13% 7% 16 11.8 $340,343 $308,128 90.53% 103 169 123.20 2,501 349,999 350,000 - 36 6 14% 4% 10 10.8 $392,474 $368,800 93.97% 64 115 149.13 2,473 399,999 400,000 - 27 6 18% 3% 5 16.2 $487,350 $412,000 84.54% 111 152 115.37 3,571 449,999 450,000 - 22 1 4% 2% 4 16.5 $486,000 $450,750 92.75% 101 123 165.78 2,719 499,999 500,000 - 14 0 0% 1% 2 21.0 $600,950 $494,800 82.34% 246 138 129.87 3,810 549,999 550,000 - 16 2 11% 2% 2 24.0 $698,975 $557,500 79.76% 181 194 188.66 2,955 599,999 600,000 - 13 0 0% 1% 2 19.5 $734,000 $567,500 77.32% 172 183 171.50 3,309 699,999 700,000 - 10 2 17% 1% 0 30.0 97 799,999 800,000 + 19 4 17% 2% 0 57.0 170 Totals 880 173 16% 100% 283 9.3 $416,142 $359,251 89.06% 115 140 $136.34 2,567
- 5. Total Market Overview 9755 SW Barnes Rd. Residential Single Family, Condos Suite 560 Portland, OR 97225 Milwaukie - Clackamas - Area 145 January 2010 Number Average List Price Average Average Average Average Number % of Closed in Months of Price of % of Total Original List Average Sold to Sold Days on Days on $ Per SF SF of of Active Market Last 90 Unsold Range Pending Market Price of Sold Price Price Market of Market of of Sold Sold Listings Pending Days Inventory Listings Homes Ratio Solds Actives Homes Homes 0- 54 6 10% 5% 20 8.1 $130,158 $115,086 88.42% 61 83 95.27 1,208 149,999 150,000 - 115 39 25% 14% 47 7.3 $185,950 $178,879 96.20% 57 104 128.41 1,393 199,999 200,000 - 164 49 23% 19% 71 6.9 $247,308 $228,344 92.33% 88 96 127.71 1,788 249,999 250,000 - 153 38 20% 17% 55 8.3 $287,001 $271,372 94.55% 69 106 122.46 2,216 299,999 300,000 - 104 30 22% 12% 40 7.8 $353,729 $325,299 91.96% 107 103 128.73 2,527 349,999 350,000 - 100 15 13% 10% 27 11.1 $400,759 $364,709 91.00% 113 109 110.18 3,310 399,999 400,000 - 50 9 15% 5% 19 7.9 $453,965 $419,530 92.41% 73 141 114.78 3,655 449,999 450,000 - 33 8 20% 4% 11 9.0 $534,734 $463,036 86.59% 165 104 133.44 3,470 499,999 500,000 - 25 3 11% 3% 7 10.7 $564,671 $508,357 90.03% 151 123 128.24 3,964 549,999 550,000 - 34 2 6% 3% 7 14.6 $644,556 $561,414 87.10% 126 119 136.83 4,103 599,999 600,000 - 25 0 0% 2% 1 75.0 $669,000 $590,000 88.19% 271 111 137.21 4,300 699,999 700,000 - 22 0 0% 2% 1 66.0 $837,000 $662,000 79.09% 91 191 171.99 3,849 799,999 800,000 + 37 1 3% 3% 2 55.5 $1,046,500 $962,500 91.97% 126 169 203.45 4,731 Totals 916 200 18% 100% 308 8.9 $488,872 $434,656 89.99% 115 120 $133.75 3,116
- 6. Total Market Overview 9755 SW Barnes Rd. Residential Single Family, Condos Suite 560 Portland, OR 97225 Oregon City - Canby - Area 146 January 2010 Number Average List Price Average Average Average Average Number % of Closed in Months of Price of % of Total Original List Average Sold to Sold Days on Days on $ Per SF SF of of Active Market Last 90 Unsold Range Pending Market Price of Sold Price Price Market of Market of of Sold Sold Listings Pending Days Inventory Listings Homes Ratio Solds Actives Homes Homes 0- 140 42 23% 21% 69 6.1 $186,604 $167,351 89.68% 76 137 117.03 1,430 199,999 200,000 - 144 33 19% 20% 81 5.3 $237,485 $223,350 94.05% 64 113 136.11 1,641 249,999 250,000 - 139 21 13% 18% 42 9.9 $281,961 $261,727 92.82% 98 103 128.49 2,037 299,999 300,000 - 77 9 10% 10% 31 7.5 $340,849 $318,374 93.41% 121 121 141.37 2,252 349,999 350,000 - 66 8 11% 8% 8 24.8 $401,349 $368,268 91.76% 82 119 137.77 2,673 399,999 400,000 - 33 5 13% 4% 7 14.1 $490,614 $412,500 84.08% 153 117 132.21 3,120 449,999 450,000 - 29 8 22% 4% 4 21.8 $500,800 $468,000 93.45% 84 141 152.39 3,071 499,999 500,000 - 19 2 10% 2% 2 28.5 $638,950 $522,500 81.77% 210 176 153.99 3,393 549,999 550,000 - 22 5 19% 3% 3 22.0 $633,300 $552,000 87.16% 75 151 180.45 3,059 599,999 600,000 - 19 1 5% 2% 3 19.0 $832,966 $672,500 80.74% 139 190 155.31 4,330 699,999 700,000 - 12 0 0% 1% 1 36.0 $774,000 $725,000 93.67% 13 169 131.82 5,500 799,999 800.000 - 9 0 0% 1% 1 27.0 $899,000 $600,000 66.74% 105 135 95.89 6,257 899,999 900,000 + 28 0 0% 3% 1 84.0 $1,950,000 $1,500,000 76.92% 97 182 248.02 6,048 Totals 737 134 15% 100% 253 8.7 $628,298 $522,428 86.63% 101 143 $146.99 3,447
- 7. Total Market Overview 9755 SW Barnes Rd. Residential Single Family, Condos Suite 560 Portland, OR 97225 Lake Oswego - West Linn - Area 147 January 2010 Number Average List Price Average Average Average Average Number % of Closed in Months of Price of % of Total Original List Average Sold to Sold Days on Days on $ Per SF SF of of Active Market Last 90 Unsold Range Pending Market Price of Sold Price Price Market of Market of of Sold Sold Listings Pending Days Inventory Listings Homes Ratio Solds Actives Homes Homes 0- 109 13 11% 12% 29 11.3 $168,206 $149,531 88.90% 91 90 130.37 1,147 199,999 200,000 - 62 11 15% 7% 14 13.3 $256,657 $228,214 88.92% 120 118 144.07 1,584 249,999 250,000 - 70 13 16% 8% 22 9.5 $303,699 $277,396 91.34% 115 102 150.84 1,839 299,999 300,000 - 46 10 18% 5% 18 7.7 $335,035 $311,489 92.97% 88 114 152.54 2,042 349,999 350,000 - 69 12 15% 8% 22 9.4 $406,053 $363,111 89.42% 63 84 152.50 2,381 399,999 400,000 - 124 18 13% 14% 41 9.1 $469,326 $431,694 91.98% 96 108 158.83 2,718 499,999 500,000 - 116 17 13% 13% 20 17.4 $608,222 $532,265 87.51% 161 101 169.46 3,141 599,999 600,000 - 74 9 11% 8% 12 18.5 $659,604 $634,619 96.21% 68 117 189.50 3,349 699,999 700,000 - 45 4 8% 5% 7 19.3 $767,392 $675,457 88.02% 178 108 202.48 3,336 799,999 800,000 - 45 5 10% 5% 7 19.3 $883,685 $810,608 91.73% 60 95 199.31 4,067 899,999 900,000 - 28 2 7% 3% 2 42.0 $1,049,450 $901,250 85.88% 104 215 285.57 3,156 999,999 1,000,000 - 73 7 9% 8% 11 19.9 $1,491,809 $1,192,500 79.94% 148 145 260.66 4,575 1,499,999 1,500,000 62 5 7% 6% 3 62.0 $3,278,833 $2,983,333 90.99% 97 211 469.96 6,348 + Totals 923 126 12% 100% 208 13.3 $821,382 $730,113 89.52% 107 124 $205.08 3,053
- 8. Total Market Overview 9755 SW Barnes Rd. Residential Single Family, Condos Suite 560 Portland, OR 97225 SW Portland - Area 148 January 2010 Number Average List Price Average Average Average Average Number % of Closed in Months of Price of % of Total Original List Average Sold to Sold Days on Days on $ Per SF SF of of Active Market Last 90 Unsold Range Pending Market Price of Sold Price Price Market of Market of of Sold Sold Listings Pending Days Inventory Listings Homes Ratio Solds Actives Homes Homes 0- 168 23 12% 11% 55 9.2 $182,835 $167,131 91.41% 85 123 191.66 872 199,999 200,000 - 140 31 18% 10% 60 7.0 $247,129 $222,730 90.13% 88 112 198.33 1,123 249,999 250,000 - 164 39 19% 12% 90 5.5 $310,735 $275,412 88.63% 98 121 186.72 1,475 299,999 300,000 - 153 30 16% 10% 55 8.3 $339,905 $312,653 91.98% 86 131 175.55 1,781 349,999 350,000 - 145 18 11% 9% 33 13.2 $394,683 $363,412 92.08% 80 152 182.25 1,994 399,999 400,000 - 90 22 20% 6% 37 7.3 $466,762 $413,257 88.54% 126 112 182.53 2,264 449,999 450,000 - 105 16 13% 7% 32 9.8 $519,704 $463,989 89.28% 116 166 178.53 2,599 499,999 500,000 - 67 7 9% 4% 18 11.2 $579,586 $515,751 88.99% 120 183 182.05 2,833 549,999 550,000 - 90 12 12% 6% 22 12.3 $610,765 $548,006 89.72% 123 176 210.21 2,607 599,999 600,000 - 106 13 11% 7% 25 12.7 $704,902 $605,411 85.89% 109 173 218.17 2,775 699,999 700,000 - 65 12 16% 4% 18 10.8 $790,213 $736,399 93.19% 140 145 277.47 2,654 799,999 800.000 - 41 3 7% 3% 6 20.5 $1,001,488 $786,920 78.58% 117 202 233.72 3,367 899,999 900,000 + 177 8 4% 11% 23 23.1 $1,566,730 $1,243,963 79.40% 159 206 276.31 4,502 Totals 1511 234 13% 100% 474 9.6 $593,495 $511,926 88.29% 111 154 $207.19 2,373
- 9. Total Market Overview 9755 SW Barnes Rd. Residential Single Family, Condos Suite 560 Portland, OR 97225 NW Portland - NW Washington County- Area 149 January 2010 Number Average List Price Average Average Average Average Number % of Closed in Months of Price of % of Total Original List Average Sold to Sold Days on Days on $ Per SF SF of of Active Market Last 90 Unsold Range Pending Market Price of Sold Price Price Market of Market of of Sold Sold Listings Pending Days Inventory Listings Homes Ratio Solds Actives Homes Homes 0- 62 14 18% 12% 25 7.4 $155,169 $147,121 94.81% 96 109 143.53 1,025 199,999 200,000 - 45 23 34% 11% 22 6.1 $242,848 $226,744 93.37% 109 105 151.06 1,501 249,999 250,000 - 77 16 17% 15% 31 7.5 $283,091 $269,865 95.33% 76 85 156.99 1,719 299,999 300,000 - 51 11 18% 10% 18 8.5 $346,005 $324,766 93.86% 73 100 152.69 2,127 349,999 350,000 - 59 14 19% 12% 25 7.1 $414,977 $363,423 87.58% 124 97 155.51 2,337 399,999 400,000 - 27 10 27% 6% 15 5.4 $443,849 $413,526 93.17% 54 67 170.04 2,432 449,999 450,000 - 31 8 21% 6% 25 3.7 $484,578 $465,866 96.14% 107 104 164.21 2,837 499,999 500,000 - 35 7 17% 7% 10 10.5 $556,591 $500,476 89.92% 125 104 152.40 3,284 549,999 550,000 - 24 8 25% 5% 11 6.5 $579,778 $511,371 88.20% 80 121 166.41 3,073 599,999 600,000 - 25 10 29% 6% 9 8.3 $663,238 $624,306 94.13% 75 166 178.88 3,490 699,999 700,000 - 13 0 0% 2% 5 7.8 $769,759 $715,000 92.89% 91 103 172.04 4,156 799,999 800.000 - 8 2 20% 2% 0 26.0 260 899,999 900,000 + 32 0 0% 5% 1 96.0 $1,050,000 $950,000 90.48% 17 164 223.95 4,242 Totals 489 123 20% 100% 197 7.4 $499,157 $459,372 92.49% 86 122 $165.64 2,685
- 10. Total Market Overview 9755 SW Barnes Rd. Residential Single Family, Condos Suite 560 Portland, OR 97225 January 2010 Beaverton - Area 150 Number Average List Price Average Average Average Average Number % of Closed in Months of Price of % of Total Original List Average Sold to Sold Days on Days on $ Per SF SF of of Active Market Last 90 Unsold Range Pending Market Price of Sold Price Price Market of Market of of Sold Sold Listings Pending Days Inventory Listings Homes Ratio Solds Actives Homes Homes 0- 358 87 20% 36% 159 6.8 $171,844 $163,232 94.99% 80 106 127.92 1,276 199,999 200,000 - 235 86 27% 26% 108 6.5 $230,010 $220,355 95.80% 58 108 143.18 1,539 249,999 250,000 - 167 43 20% 17% 78 6.4 $281,807 $266,151 94.44% 68 121 138.19 1,926 299,999 300,000 - 82 14 15% 8% 29 8.5 $336,629 $317,287 94.25% 74 74 137.95 2,300 349,999 350,000 - 56 5 8% 5% 21 8.0 $395,392 $358,191 90.59% 126 152 140.03 2,558 399,999 400,000 - 34 4 11% 3% 8 12.8 $428,837 $407,125 94.94% 80 118 157.19 2,590 449,999 450,000 - 18 3 14% 2% 9 6.0 $490,470 $473,144 96.47% 31 104 146.53 3,229 499,999 500,000 - 13 3 19% 1% 3 13.0 $540,366 $504,000 93.27% 63 152 150.63 3,346 549,999 550,000 - 7 0 0% 1% 3 7.0 $599,966 $523,333 87.23% 118 205 143.34 3,651 599,999 600,000 - 2 1 33% 0% 3 2.0 $661,633 $615,500 93.03% 172 72 152.69 4,031 699,999 700,000 - 5 1 17% 0% 2 7.5 $774,450 $685,000 88.45% 75 136 146.43 4,678 799,999 800.000 - 3 1 25% 0% 1 9.0 $890,000 $800,000 89.89% 206 161 205.39 3,895 899,999 900,000 + 5 2 29% 1% 2 7.5 $1,392,500 $952,500 68.40% 147 186 191.23 4,981 Totals 985 250 20% 100% 426 6.9 $553,377 $483,524 90.90% 100 130 $152.36 3,077
- 11. Total Market Overview 9755 SW Barnes Rd. Residential Single Family, Condos Suite 560 Portland, OR 97225 Tigard - Tualatin - Sherwood - Wilsonville - Area 151 January 2010 Number Average List Price Average Average Average Average Number % of Closed in Months of Price of % of Total Original List Average Sold to Sold Days on Days on $ Per SF SF of of Active Market Last 90 Unsold Range Pending Market Price of Sold Price Price Market of Market of of Sold Sold Listings Pending Days Inventory Listings Homes Ratio Solds Actives Homes Homes 0- 164 21 11% 15% 59 8.3 $169,366 $154,344 91.13% 104 126 128.73 1,199 199,999 200,000 - 129 32 20% 13% 65 6.0 $241,279 $222,695 92.30% 87 117 138.75 1,605 249,999 250,000 - 174 41 19% 18% 79 6.6 $283,117 $268,948 95.00% 72 105 148.02 1,817 299,999 300,000 - 146 30 17% 14% 58 7.6 $342,584 $320,449 93.54% 89 92 139.45 2,298 349,999 350,000 - 134 22 14% 13% 35 11.5 $397,080 $370,645 93.34% 102 102 137.79 2,690 399,999 400,000 - 63 13 17% 6% 21 9.0 $444,490 $417,519 93.93% 78 129 143.72 2,905 449,999 450,000 - 64 8 11% 6% 11 17.5 $517,868 $446,590 86.24% 118 150 131.54 3,395 499,999 500,000 - 21 4 16% 2% 8 7.9 $542,587 $502,391 92.59% 72 98 147.20 3,413 549,999 550,000 - 20 7 26% 2% 6 10.0 $609,949 $531,250 87.10% 113 177 148.06 3,588 599,999 600,000 - 33 5 13% 3% 4 24.8 $746,558 $611,250 81.88% 171 152 129.15 4,733 699,999 700,000 - 25 2 7% 2% 2 37.5 $974,750 $722,500 74.12% 475 174 150.40 4,804 799,999 800.000 - 14 1 7% 1% 2 21.0 $892,500 $813,195 91.11% 98 205 170.91 4,758 899,999 900,000 + 43 6 12% 4% 6 21.5 $1,417,083 $1,190,333 84.00% 176 179 245.03 4,858 Totals 1030 192 16% 100% 356 8.7 $583,016 $505,547 88.94% 135 139 $150.67 3,236
- 12. Total Market Overview 9755 SW Barnes Rd. Residential Single Family, Condos Suite 560 Portland, OR 97225 Hillsboro - Forest Grove - Area 152 January 2010 Number Average List Price Average Average Average Average Number % of Closed in Months of Price of % of Total Original List Average Sold to Sold Days on Days on $ Per SF SF of of Active Market Last 90 Unsold Range Pending Market Price of Sold Price Price Market of Market of of Sold Sold Listings Pending Days Inventory Listings Homes Ratio Solds Actives Homes Homes 0- 277 70 20% 34% 126 6.6 $174,392 $165,052 94.64% 88 137 118.32 1,395 199,999 200,000 - 208 37 15% 24% 85 7.3 $230,138 $218,875 95.11% 86 107 134.03 1,633 249,999 250,000 - 152 36 19% 18% 42 10.9 $285,504 $265,426 92.97% 82 122 125.20 2,120 299,999 300,000 - 77 16 17% 9% 22 10.5 $340,856 $326,337 95.74% 92 119 134.91 2,419 349,999 350,000 - 54 12 18% 6% 18 9.0 $387,188 $363,827 93.97% 185 147 145.24 2,505 399,999 400,000 - 13 3 19% 2% 2 19.5 $409,500 $408,250 99.69% 99 108 141.75 2,880 449,999 450,000 - 17 2 11% 2% 2 25.5 $504,300 $442,500 87.75% 89 113 143.67 3,080 499,999 500,000 - 7 0 0% 1% 3 7.0 $586,600 $499,600 85.17% 231 107 130.27 3,835 549,999 550,000 - 5 0 0% 0% 3 5.0 $634,300 $572,466 90.25% 103 109 140.66 4,070 599,999 600,000 - 14 2 13% 2% 1 42.0 $645,000 $570,000 88.37% 77 161 247.40 2,304 699,999 700,000 - 9 0 0% 1% 1 27.0 $899,000 $700,000 77.86% 57 286 178.66 3,918 799,999 800.000 - 6 0 0% 1% 1 18.0 $850,000 $715,000 84.12% 2 82 245.37 2,914 899,999 900,000 + 11 0 0% 1% 1 33.0 $999,950 $825,000 82.50% 321 226 206.10 4,003 Totals 850 178 17% 100% 307 8.3 $534,364 $467,103 89.86% 116 140 $160.89 2,852