SlideShare una empresa de Scribd logo
1 de 7
Descargar para leer sin conexión
A Publication of RMLS™, The Source for Real Estate Statistics in Your Community
Residential Review: Metro Portland, Oregon                                                                                October 2010 Reporting Period
October Residential Highlights                             Sale Prices
                                                                                                                                     Inventory in Months*
     Comparing October 2010 to                                The average sale price for October                                                  2008 2009                    2010
October 2009, closed sales decreased                       2010 declined 2.4% compared to                                            January       12.8 19.2                    12.6
by 35.7%. Pending sales and new                            October 2009. The median sale price                                       February      10.4 16.6                    12.9
listings also fell by 21.5% and 9.4%,                      also fell 4.7%.                                                           March          9.1   12                     7.8
respectively. The number of closed                                                                                                   April         10.3   11                     7.3
                                                               On a month-to-month basis,
sales and new listings are the lowest                                                                                                May            9.2 10.2                       7
                                                           c o m p a r i n g O c t o b e r 2 010 t o                                 June           9.5 8.2                      7.3
they have been in October in a                             September 2010, the average sale                                          July            10 7.3                     10.8
comparison of the past three years                         price went down 1.1% ($276,800                                            August         9.9 7.8                       11
(see graphs on pages 3 and 4).                             v. $279,900) and the median sale                                          September 10.4 7.6                         10.5
    A comparison of October                                price also dropped 2.7% ($233,500                                         October       11.1 6.5                     10.7
2010 with the previous month,                              v. $240,000).                                                             November        15 7.1
September 2010, shows closed sales                                                                                                   December      14.1 7.7
                                                           Year-to-Date
decreased by 7.7% (1,292 v. 1,399).                                                                                                  *Inventory in Months is calculated by dividing
                                                               When comparing January-                                               the Active Listings at the end of the month in
Additionally, pending sales grew by                        October 2010 with the same period                                         question by the number of closed sales for
3% (1,632 v. 1,584), and new listings                      in 2009, closed sales increased 3.7%.                                     that month.
fell by 12.1% (3,119 v. 3,549).                            Pending sales were 3.4% lower, but
                                                                                                                                        Percent Change of 12-Month Sale Price
   At the month’s rate of sales, the                       new listings were up 4%.                                                     Compared With The Previous 12 Months
13,805 active residential listings
                                                            AFFORDABILITY: According to a formula from                                       Average Sale Price % Change:
would last approximately 10.7                               the National Association of REALTORS® , housing                                    -3.3% ($283,100 v. $292,900)
months. Inventory in October 2010                           in the Portland metro area remains affordable for
                                                            families earning the median income. Read more                                     Median Sale Price % Change:
rose by 4.2 months compared to                              on page 7.                                                                          -3.6% ($240,000 v. $249,000)
October 2009 (6.5 months).
                                                                                                                                    For further explanation of this measure, see
                                                                                                                                    the second footnote on page 2.


             Portland Metro
                                                                                                                                                                      Total
             Residential
                                                     New              Pending                Closed              Average                   Median                    Market
             Highlights                          Listings               Sales                 Sales             Sale Price               Sale Price                   Time

                     October                            3,119                1,632                1,292              276,800                  233,500                    131
            2010


                     Year-to-date                     41,051               17,167               16,033               283,400                  240,000                    130
                     October                            3,443                2,079                2,009              283,500                  245,000                    135
            2009


                     Year-to-date                     39,490               17,775               15,467               292,000                  249,900                    143
            Change


                     October                            -9.4%              -21.5%               -35.7%                   -2.4%                    -4.7%                -3.3%
                     Year-to-date                        4.0%                -3.4%                 3.7%                  -2.9%                    -4.0%                -8.7%
                         *Total Market Time is the number of days from when a property is listed to when an offer is accepted on that same property. If a property
                             is re-listed within 31 days, Total Market Time continues to accrue; however, it does not include the time that it was off the market.


                                                           © Copyright RMLS™ 2010. All Rights Reserved.
AREA REPORT • 10/2010
       Metro Portland & Adjacent Regions, Oregon
                                                                                                                                                                                                  RESIDENTIAL                                                                                                                                                                                      COMMERCIAL                                            LAND                             MULTIFAMILY

                                                                                                            Current Month                                                                                                                                                                       Year-To-Date                                                                                          Year-To-Date                                Year-To-Date                                 Year-To-Date


                                                                                                                         1
                                                                                                                         Pending Sales 2010 v. 2009


                                                                                                                                                                                                                                                                   Pending Sales 2010 v. 2009


                                                                                                                                                                                                                                                                                                                                                                   2
                                                                        Expired/Canceled Listings


                                                                                                                                                                                                                                                                                                                                                                   Avg. Sale Price % Change
                                                                                                    Pending Sales 2010


                                                                                                                                                                                                                                     Pending Sales 2010
                                                                                                                                                                                                  3
                                                                                                                                                                         Average Sale Price


                                                                                                                                                                                                                                                                                                                          Average Sale Price


                                                                                                                                                                                                                                                                                                                                                                                                                 Average Sale Price


                                                                                                                                                                                                                                                                                                                                                                                                                                                           Average Sale Price


                                                                                                                                                                                                                                                                                                                                                                                                                                                                                                       Average Sale Price
                                                                                                                                                                                                  Total Market Time


                                                                                                                                                                                                                                                                                                                                               Median Sale Price
                                  Active Listings


                                                                                                                                                      Closed Sales


                                                                                                                                                                                                                                                                                                      Closed Sales


                                                                                                                                                                                                                                                                                                                                                                                              Closed Sales


                                                                                                                                                                                                                                                                                                                                                                                                                                          Closed Sales


                                                                                                                                                                                                                                                                                                                                                                                                                                                                                Closed Sales
                                                    New Listings


                                                                                                                                                                                                                      New Listings
        141


                  N Portland                535             155                     147                            70    -36.9%                                 45       239,100                             96        1,813                     719               -18.6%                                     645         231,600              225,000                  -1.2%                                7   239,300                       23              79,200                    17              281,600
        142


                  NE Portland      1,061                    337                     248                     157          -31.1%                            137           279,200                      132              3,992          1,772                                  -4.5%                     1,671              284,700              249,000                  -1.3%                         18         368,800                       28          101,300                       40              381,100
        143


                  SE Portland      1,413                    397                     315                     212          -34.4%                            155           225,300                             90        5,005          2,241                        -11.2%                              2,110              238,100              208,000                  -3.4%                         24         366,800                       34          182,300                       74              430,300

                  Gresham/
        144


                  Troutdale                 968             186                     168                     126          -10.0%                                 90       214,000                      106              2,758          1,149                                  -1.5%                     1,059              213,900              202,000                  -3.8%                                9   250,300                       40              97,500                    23              248,900
                  Milwaukie/
        145


                  Clackamas        1,104                    263                     188                     127                 -6.6%                      111           262,300                      132              3,113          1,276                                  -3.5%                     1,180              262,800              240,000                  -6.7%                                2   123,900                       60          104,700                       13              184,900
                  Oregon City/
        146


                  Canby                     816             142                     128                            68    -32.0%                                 62       251,300                      143              2,114                     824                         -1.6%                            790         257,500              230,000                  -8.4%                         12         224,000                       34          139,000                             7         317,700
                  Lake Oswego/
        147


                  West Linn                 956             186                     187                            84    -16.0%                                 72       414,200                      209              2,596                     936                     10.6%                                886         436,700              385,000                  -8.0%                                4   378,800                       31          253,300                             2         417,500
        148


                  W Portland       1,676                    351                     343                     211                 -5.4%                      146           411,100                      175              4,957          1,944                              11.0%                         1,786              409,900              340,000                  -5.0%                                4   592,300                       28          198,800                       19              525,600
        149


                  NW Wash Co.               591             137                     100                            87       26.1%                               69       375,300                      110              1,877                     874                               9.5%                       819         368,100              338,000                  -2.8%                                3   168,000                       18          291,700                             5         274,000

                  Beaverton/
        150


                  Aloha            1,201                    289                     220                     143          -35.9%                            114           207,600                      120              3,787          1,576                        -13.4%                              1,484              240,800              217,000                  -0.8%                                6   209,800                       17          381,300                       27              254,000

                  Tigard/
        151


                  Wilsonville      1,137                    261                     215                     126          -16.0%                            110           297,800                      126              3,330          1,415                                        0.1%                1,338              304,200              278,500                  -4.5%                                3   201,700                       30          250,900                       19              245,900
                  Hillsboro/
        152


                  Forest Grove              856             187                     139                            95    -31.7%                                 88       216,900                      127              2,558          1,203                                  -5.5%                     1,128              228,100              209,000                  -7.6%                                9   265,000                       32          349,600                       20              172,800
        153


                  Mt. Hood                  142                    22                         27                   13    -23.5%                                      8   230,500                             70               290                         89                 -3.3%                                   81   207,000              180,000             -19.7%                          -                                  -        10          108,200                    -                                     -
        155


                  Columbia Co.              510                    65                         79                   46                  0.0%                     33       174,700                      127              1,089                     398                         -6.6%                            373         185,000              178,400                  -9.4%                                4   192,000                       15          124,000                             4         223,300
        156


                  Yamhill Co.               839             141                     148                            67           -9.5%                           52       210,200                      157              1,772                     751                         -1.8%                            683         217,400              192,000                  -6.9%                                8   204,900                       29          139,000                             9         201,600
        168-178


                  Marion/Polk
                  Counties         1,160                 175                              188                      81    -24.3%                                 65       177,300                      171              2,216                     748               -12.0%                                     697         199,100              176,000                  -5.4%                         10         274,800                       59              76,400                    14              454,500
     180-195


                  North Coastal
       200


                  Counties         1,585                 179                              239                      76    -10.6%                                 54       276,700                      148              2,405                     710                     12.7%                                640         279,200              225,000                  -4.9%                         18         482,900                       95          158,200                       12              234,700

1
    Percent change in number of pending sales this year compared to last year. The Current Month section compares October 2010 with October 2009. The Year-To-
    Date section compares year-to-date statistics from October 2010 with year-to-date statistics from October 2009.
2
    % Change is based on a comparison of the rolling average sale price for the last 12 months (11/1/09-10/31/10) with 12 months before (11/1/08-10/31/09).
3
    Total Market Time is the number of days from when a property is listed to when an offer is accepted on that same property. If a property is re-listed within 31 days,
    Total Market Time continues to accrue; however, it does not include the time that it was off the market.


                                                                                                                                                                                                                                                               2
                                                                                                                                                                                              © Copyright RMLS™ 2010. All Rights Reserved.
ACTIVE
                             Active Residential Listings
                                                                                                                           RESIDENTIAL
20000                                                                                                                       LISTINGS
18000                                                                                                                       PORTLAND, OR
16000
                                                                                                                      This graph shows the active
14000
12000                                                                                                                 residential listings over the
10000
 8000
                                                                                                                      past three calendar years
 6000                                                                                                                 in the greater Portland,
 4000
                                                                                                                      Oregon metropolitan area.


                                      2008           2009                  2010


    TOTAL ACTIVE
                                                                                  Total Active Listings
      LISTINGS
        PORTLAND, OR          25000
                              22500
This graph shows the          20000

total active listings over    17500
                              15000
the past three calendar       12500
                              10000
years in the greater
                               7500
Portland, Oregon               5000

metropolitan area.

                                                    Total Active Listings 2008           Total Active Listings 2009          Total Active Listings 2010


                                                                                                                         NEW LISTINGS
                                        New Listings
                                                                                                                           PORTLAND, OR
  6,000                                                                                                               This graph shows the
  5,000
                                                                                                                      new residential listings
  4,000
                                                                                                                      over the past three
  3,000

  2,000
                                                                                                                      calendar years in the
  1,000                                                                                                               greater Portland, Oregon
        0                                                                                                             metropolitan area.


                                        2008          2009                 2010


                                                                             3
                                               © Copyright RMLS™ 2010. All Rights Reserved.
PENDING LISTINGS
                                     Pending Sales
                                                                                                           PORTLAND, OR

3,500
                                                                                                   This graph represents
3,000                                                                                              monthly accepted offers
2,500
                                                                                                   in the Portland, Oregon
2,000
1,500                                                                                              metropolitan area over
1,000                                                                                              the past three calendar
 500
                                                                                                   years.
   0


                                     2008           2009          2010


   CLOSED SALES
                                                                              Closed Sales
        PORTLAND, OR
This graph shows the         2,500

closed sales over the past   2,000

three calendar years in      1,500

the greater Portland,        1,000

Oregon metropolitan           500

area.                           0


                                                                              2008          2009   2010


                             Average Market Time                                                          DAYS ON MARKET
 180
                                                                                                            PORTLAND, OR
 160                                                                                               This graph shows the
 140
 120                                                                                               average market time for
 100
  80                                                                                               sales in the Portland,
  60
  40
                                                                                                   Oregon metropolitan area.
  20                                                                                               *As of August 2008, graph
   0
                                                                                                   now reports “Total Days
                                                                                                   on Market” - for details
                                      2008
                                      2009 TMT
                                                             2008 TMT
                                                             2010 TMT
                                                                                                   read footnotes on page 2.


                                                                    4
                                             © Copyright RMLS™ 2010. All Rights Reserved.
AVERAGE SALE                                This graph represents the average sale price for all homes sold in the Portland,
    PRICE                                   Oregon metropolitan area.
  PORTLAND, OR


                                                                                   Average Sale Price

 $400,000


 $350,000


 $300,000


 $250,000


 $200,000


 $150,000


 $100,000
               Oct-00


                                   Oct-01


                                                        Oct-02


                                                                          Oct-03


                                                                                             Oct-04


                                                                                                               Oct-05


                                                                                                                                 Oct-06


                                                                                                                                                   Oct-07


                                                                                                                                                                     Oct-08


                                                                                                                                                                                          Oct-09


                                                                                                                                                                                                            Oct-10
                         Apr-01


                                            Apr-02


                                                                 Apr-03


                                                                                    Apr-04


                                                                                                      Apr-05


                                                                                                                        Apr-06


                                                                                                                                          Apr-07


                                                                                                                                                            Apr-08


                                                                                                                                                                                Apr-09


                                                                                                                                                                                                   Apr-10
                        Median Sale Price: Portland, OR & Clark Co., WA                                                                                                          MEDIAN SALE
                                                                                                                                                                                    PRICE
260000
                                                                                                                                                                                         PORTLAND, OR
240000
                                                                                                                                                                              This graph shows the
220000
200000
                                                                                                                                                                              median sale price over
180000                                                                                                                                                                        the past 12 months in the
160000                                                                                                                                                                        greater Portland, Oregon
140000
                                                                                                                                                                              metropolitan area and
120000
                                                                                                                                                                              Clark County.
100000
         OCT       NOV            DEC       JAN          FEB         MAR           APR       MAY JUNE JULY AUG SEPT OCT

                                                     Clark County                   Metro Portland, OR


                                                                                                      5
                                                                      © Copyright RMLS™ 2010. All Rights Reserved.
MEDIAN SALE PRICE
October 2010                                                                                                   SW
                                                                                           WASHINGTON


                                                                $250,000                                                     $214,300

                                                                Woodland                                                N/NE Clark County


                                                                                                           $215,200
PORTLAND                                                                    $241,500                    Battle Ground
                                                                    Ridgefield/La Center

 METRO                                 $ 156,800
                                    Columbia County
                                                                            $201,000                                     $254,900
                                                                            Salmon Creek                                Brush Prairie
                                                                               $221,500                                  Hockinson
                                                                                Felida
                                                                                       $180,000
                       $ 345,000                                                         Hazel     $165,000
                                                                                          Dell     5 Corners
                                                                                       Minnehaha     Orch.
                 North Washington County
                                                                             $158,000                    $179,000
                       Sauvie Island
                                                                            Cent. Vancouver            Cascade Park
                                                                                          $192,200
                                                                                             Heights
                                                               $225,900
                                                                                                                                  $240,000
                                                               N Portland
                                                                                                                                  Camas/Washougal
                                                                                $ 241,500
                                                                                NE
       $ 200,300                                                                Portland
                                                                $ 316,800
        Hillsboro                                                  West                                         $ 190,500
                                                                                $ 182,600                        Gresham
      Forest Grove                                                Portland
                                           $ 195,200                            SE                               Troutdale
                                                                                Portland                          Sandy
                                           Beaverton
                                                                                                                  Corbett
                                             Aloha                               $ 235,000                       Fairview                  $ 170,000
                                                                                 Milwaukie/Gladstone/
                                                                                                                                            Mt. Hood:
                                                                                 Boring/Clackamas
                                                                                                                                             Zigzag
                                                                                 Estacada
                                               $ 265,500          $ 383,000                                                                 Welches
                                                                                                                                         Rhododendron
                                             Tigard/Tualatin
                                                                                                                                            Wemme
                                               Sherwood           Lake Oswego                                                              Brightwood
                                               Wilsonville        West                                                                  Government Camp
                                                                   Linn
     $ 193,500
    Yamhill County                                                                 $ 238,000
                                                                                   Oregon City
                                                                                     Canby
                                                                                     Molalla
                                                                                  Beavercreek


                                                                  6
                                           © Copyright RMLS™ 2010. All Rights Reserved.
MULTIPLE LISTING SERVICE


                                                     MEDIAN SALE                                                                                   This graph represents the median sale price for all
             Corporate
    825 NE Multnomah, Suite 270                     PRICE CONDOS                                                                                   condos sold in the last three calendar years in the
        Portland, OR 97232
          (503) 236-7657                                 PORTLAND, OR
        Fax: (503) 230-0689                                                                                                                        Portland, Oregon metropolitan area.
       Southwest Washington
      1514 Broadway, Suite 101
        Vancouver, WA 98663                                                                                                           Median Condo Sale Price
           (360) 696-0718
         Fax: (360) 696-9342
                                                 $250,000
               Salem
   2110 Mission St. SE, Suite 305
         Salem, OR 97302                         $225,000
          (503) 587-8810
        Fax: (503) 585-3817
        Lane County: Eugene                      $200,000
        2139 Centennial Plaza
         Eugene, OR 97401
                                                 $175,000
           (541) 686-2885
         Fax: (541) 484-3854
        Lane County: Florence                    $150,000
             PO Box 414
         Florence, OR 97439
           (541) 902-2560
         Fax: (541) 902-1341
           Douglas County                                                                                                                                       2008                               2009                              2010
         3510 NE Edenbower
         Roseburg, OR 97470
            (541) 673-3571
         Fax: (541) 673-6581                      AFFORDABILITY                                                                   This graph shows affordability for housing in the
             Curry County
             PO Box 6307                               PORTLAND, OR                                                               Portland, Oregon metropolitan area in September 2010.
         Brookings, OR 97415
            (541) 469-0219
         Fax: (541) 469-9695
            Mid-Columbia
            PO Box 1088
                                                                                                                                                   Affordability Index
        Hood River, OR 97031
           (541) 436-2956                          180
         Fax: (541) 387-6657                       160
           Eastern Oregon                          140
             PO Box 751
        Hermiston, OR 97838                        120
           (541) 567-5186                          100
         Fax: (541) 289-7320
                                                    80
            Coos County
    1946 Sherman Ave., Suite 101                    60
       North Bend, OR 97459                         40
          (541) 751-1070
        Fax: (541) 751-1083                         20
                                                     0
                                                                                                                                                                                       Mar-07


                                                                                                                                                                                                                           Mar-08


                                                                                                                                                                                                                                                               Mar-09


                                                                                                                                                                                                                                                                                                   Mar-10
                                                                           Mar-04
                                                                                    Jun-04


                                                                                                               Mar-05
                                                                                                                        Jun-05


                                                                                                                                                   Mar-06
                                                                                                                                                            Jun-06


                                                                                                                                                                                                Jun-07


                                                                                                                                                                                                                                    Jun-08


                                                                                                                                                                                                                                                                        Jun-09


                                                                                                                                                                                                                                                                                                            Jun-10
                                                         Sep-03
                                                                  Dec-03


                                                                                             Sep-04
                                                                                                      Dec-04


                                                                                                                                 Sep-05
                                                                                                                                          Dec-05


                                                                                                                                                                     Sep-06
                                                                                                                                                                              Dec-06


                                                                                                                                                                                                         Sep-07


                                                                                                                                                                                                                                             Sep-08


                                                                                                                                                                                                                                                                                 Sep-09


                                                                                                                                                                                                                                                                                                                     Sep-10
                                                                                                                                                                                                                  Dec-07


                                                                                                                                                                                                                                                      Dec-08


                                                                                                                                                                                                                                                                                          Dec-09


   The statistics presented in Market
Action are compiled monthly based on
figures generated by RMLS™.
    Statistics reflect reported activity for
the greater Portland, Oregon metropolitan
area, to include Multnomah, Washington,
Clackamas, Yamhill, & Columbia counties;
                                                AFFORDABILITY - According to a formula from the National Association of REALTORS®, buying a house in the Portland
Lane, Douglas, Coos & Curry Counties in
                                                metro area is affordable for a family earning the median income. A family earning the median income ($71,200 in 2010, per
Oregon; portions of other Oregon Counties;
                                                HUD) can afford 155% of a monthly mortgage payment on a median priced home ($240,000 in September). The formula
and Clark, Cowlitz & Pacific Counties in
                                                assumes that the buyer has a 20% down payment and a 30 year fixed rate of 4.35% (per Freddie Mac).
Washington.
   RMLS™ was formed by area Boards and
Associations of REALTORS® in 1991.
                                                                                                                                                               Gary Whiting, Chairman of the Board
    E-mail subscriptions are available for
$45 per year by contacting RMLS™, (503)                                                                                                                        Kurt von Wasmuth, President/CEO
236-7657. Reproduction of any portion of                                                                                                                       Kelsey Brunson, Editor
this copyrighted material is prohibited
without prior approval of RMLS™.
                                                                                                                                                               Danny Gottleib, Assistant Editor


                                                                   © Copyright RMLS™ 2010. All Rights Reserved.

Más contenido relacionado

La actualidad más candente

BC Leading Housing Market - March 2011
BC Leading Housing Market -  March 2011BC Leading Housing Market -  March 2011
BC Leading Housing Market - March 2011Matt Collinge
 
Market Watch for Toronto June 2011
Market Watch for Toronto June 2011Market Watch for Toronto June 2011
Market Watch for Toronto June 2011Brent Reid
 
This Month in Real Estate for Canada - December 2011
This Month in Real Estate for Canada - December 2011This Month in Real Estate for Canada - December 2011
This Month in Real Estate for Canada - December 2011Keller Williams Careers
 
Greater Boston Real Estate Market Data, September 2012
Greater Boston Real Estate Market Data, September 2012Greater Boston Real Estate Market Data, September 2012
Greater Boston Real Estate Market Data, September 2012Unit Realty Group
 
Princeton Area Real Estate July 24 12
Princeton Area Real Estate July 24 12Princeton Area Real Estate July 24 12
Princeton Area Real Estate July 24 12Ann Harwood
 
atmos enerrgy 36_pres
atmos enerrgy 36_presatmos enerrgy 36_pres
atmos enerrgy 36_presfinance35
 
SAR Monthly Statistics Released for June 2011
SAR Monthly Statistics Released for June 2011SAR Monthly Statistics Released for June 2011
SAR Monthly Statistics Released for June 2011Sarasota Real Estate
 
u.s.bancorp2Q 2007 Earnings Release
u.s.bancorp2Q 2007 Earnings Release  u.s.bancorp2Q 2007 Earnings Release
u.s.bancorp2Q 2007 Earnings Release finance13
 
Home prices rise in more metro areas, first quarter resales up from a year ago
Home prices rise in more metro areas, first quarter resales up from a year agoHome prices rise in more metro areas, first quarter resales up from a year ago
Home prices rise in more metro areas, first quarter resales up from a year agokeithcwhite
 

La actualidad más candente (14)

BC Leading Housing Market - March 2011
BC Leading Housing Market -  March 2011BC Leading Housing Market -  March 2011
BC Leading Housing Market - March 2011
 
Market Watch for Toronto June 2011
Market Watch for Toronto June 2011Market Watch for Toronto June 2011
Market Watch for Toronto June 2011
 
Joe's march presentation
Joe's march presentationJoe's march presentation
Joe's march presentation
 
December 2012 MLS Statistics
December 2012 MLS StatisticsDecember 2012 MLS Statistics
December 2012 MLS Statistics
 
This Month in Real Estate for Canada - December 2011
This Month in Real Estate for Canada - December 2011This Month in Real Estate for Canada - December 2011
This Month in Real Estate for Canada - December 2011
 
Rei0410
Rei0410Rei0410
Rei0410
 
Greater Boston Real Estate Market Data, September 2012
Greater Boston Real Estate Market Data, September 2012Greater Boston Real Estate Market Data, September 2012
Greater Boston Real Estate Market Data, September 2012
 
Princeton Area Real Estate July 24 12
Princeton Area Real Estate July 24 12Princeton Area Real Estate July 24 12
Princeton Area Real Estate July 24 12
 
atmos enerrgy 36_pres
atmos enerrgy 36_presatmos enerrgy 36_pres
atmos enerrgy 36_pres
 
SAR Monthly Statistics Released for June 2011
SAR Monthly Statistics Released for June 2011SAR Monthly Statistics Released for June 2011
SAR Monthly Statistics Released for June 2011
 
ravi_jonathan_asirvatham-2
ravi_jonathan_asirvatham-2ravi_jonathan_asirvatham-2
ravi_jonathan_asirvatham-2
 
u.s.bancorp2Q 2007 Earnings Release
u.s.bancorp2Q 2007 Earnings Release  u.s.bancorp2Q 2007 Earnings Release
u.s.bancorp2Q 2007 Earnings Release
 
Home prices rise in more metro areas, first quarter resales up from a year ago
Home prices rise in more metro areas, first quarter resales up from a year agoHome prices rise in more metro areas, first quarter resales up from a year ago
Home prices rise in more metro areas, first quarter resales up from a year ago
 
September 2012 Toronto Real Estate Market Watch
September 2012 Toronto Real Estate Market WatchSeptember 2012 Toronto Real Estate Market Watch
September 2012 Toronto Real Estate Market Watch
 

Destacado (8)

Ecomonic forecast 2011 handout
Ecomonic forecast 2011 handoutEcomonic forecast 2011 handout
Ecomonic forecast 2011 handout
 
This Month In Real Estate March 2010
This  Month In  Real  Estate   March 2010This  Month In  Real  Estate   March 2010
This Month In Real Estate March 2010
 
Aug 2010 update
Aug 2010 updateAug 2010 update
Aug 2010 update
 
Market overview april 2010
Market overview april 2010Market overview april 2010
Market overview april 2010
 
Re Insights Graphs Oct
Re Insights Graphs OctRe Insights Graphs Oct
Re Insights Graphs Oct
 
Totalmarketoverview june10
Totalmarketoverview june10Totalmarketoverview june10
Totalmarketoverview june10
 
Jan Tmo
Jan TmoJan Tmo
Jan Tmo
 
This Month In Real Estate September Us
This Month In Real Estate   September   UsThis Month In Real Estate   September   Us
This Month In Real Estate September Us
 

Similar a RMLS oct market action report

TREB Market Watch October 2012
TREB Market Watch October 2012TREB Market Watch October 2012
TREB Market Watch October 2012realestatesnatch
 
Toronto real estate statistics august 2011
Toronto real estate statistics august 2011Toronto real estate statistics august 2011
Toronto real estate statistics august 2011John Helfrich
 
Toronto real estate statistics October 2011
Toronto real estate statistics October 2011Toronto real estate statistics October 2011
Toronto real estate statistics October 2011John Helfrich
 
Toronto Real Estate Statistics september 2011
Toronto Real Estate Statistics september 2011Toronto Real Estate Statistics september 2011
Toronto Real Estate Statistics september 2011John Helfrich
 
Toronto real estate statistics may 2011
Toronto real estate statistics may 2011Toronto real estate statistics may 2011
Toronto real estate statistics may 2011John Helfrich
 
Toronto real estate statistics november 2011
Toronto real estate statistics november 2011Toronto real estate statistics november 2011
Toronto real estate statistics november 2011John Helfrich
 
Market Watch: August 2012
Market Watch: August 2012Market Watch: August 2012
Market Watch: August 2012lauragolbeck
 
TREB Market Watch Report November 2012
TREB Market Watch Report November 2012TREB Market Watch Report November 2012
TREB Market Watch Report November 2012realestatesnatch
 
Jan - June 2012 Newsletter
Jan - June 2012 NewsletterJan - June 2012 Newsletter
Jan - June 2012 NewsletterJohn D Parce
 
Charleston Real Estate Sales
Charleston Real Estate SalesCharleston Real Estate Sales
Charleston Real Estate SalesSteve DeGuzman
 
Toronto real estate statistics june 2011
Toronto real estate statistics june 2011Toronto real estate statistics june 2011
Toronto real estate statistics june 2011John Helfrich
 

Similar a RMLS oct market action report (20)

TREB Market Watch October 2012
TREB Market Watch October 2012TREB Market Watch October 2012
TREB Market Watch October 2012
 
Toronto real estate statistics august 2011
Toronto real estate statistics august 2011Toronto real estate statistics august 2011
Toronto real estate statistics august 2011
 
Toronto real estate statistics October 2011
Toronto real estate statistics October 2011Toronto real estate statistics October 2011
Toronto real estate statistics October 2011
 
Mw1110
Mw1110Mw1110
Mw1110
 
MARKET WATCH FOR JUNE 2010
MARKET WATCH FOR JUNE 2010MARKET WATCH FOR JUNE 2010
MARKET WATCH FOR JUNE 2010
 
Toronto Real Estate Statistics september 2011
Toronto Real Estate Statistics september 2011Toronto Real Estate Statistics september 2011
Toronto Real Estate Statistics september 2011
 
Srmag june2011 stats
Srmag june2011 statsSrmag june2011 stats
Srmag june2011 stats
 
Toronto real estate statistics may 2011
Toronto real estate statistics may 2011Toronto real estate statistics may 2011
Toronto real estate statistics may 2011
 
November 2011 Market Watch
November 2011 Market WatchNovember 2011 Market Watch
November 2011 Market Watch
 
Toronto real estate statistics november 2011
Toronto real estate statistics november 2011Toronto real estate statistics november 2011
Toronto real estate statistics november 2011
 
Market Watch August 2012
Market Watch August 2012Market Watch August 2012
Market Watch August 2012
 
Market Watch: August 2012
Market Watch: August 2012Market Watch: August 2012
Market Watch: August 2012
 
Mw1209
Mw1209Mw1209
Mw1209
 
TREB Market Watch Report November 2012
TREB Market Watch Report November 2012TREB Market Watch Report November 2012
TREB Market Watch Report November 2012
 
Jan - June 2012 Newsletter
Jan - June 2012 NewsletterJan - June 2012 Newsletter
Jan - June 2012 Newsletter
 
Cw12 q3
Cw12 q3Cw12 q3
Cw12 q3
 
Commercial Real Estate Market Watch for Toronto: September 2012
Commercial Real Estate Market Watch for Toronto: September 2012Commercial Real Estate Market Watch for Toronto: September 2012
Commercial Real Estate Market Watch for Toronto: September 2012
 
Charleston Real Estate Sales
Charleston Real Estate SalesCharleston Real Estate Sales
Charleston Real Estate Sales
 
Toronto real estate statistics june 2011
Toronto real estate statistics june 2011Toronto real estate statistics june 2011
Toronto real estate statistics june 2011
 
Manhattan First Quarter 2011 Real Estate Market Report
Manhattan First Quarter 2011 Real Estate Market Report Manhattan First Quarter 2011 Real Estate Market Report
Manhattan First Quarter 2011 Real Estate Market Report
 

Más de Keller Williams Realty Professionals

Listing presentation generic (john hatch's conflicted copy 2014 10-09) (john ...
Listing presentation generic (john hatch's conflicted copy 2014 10-09) (john ...Listing presentation generic (john hatch's conflicted copy 2014 10-09) (john ...
Listing presentation generic (john hatch's conflicted copy 2014 10-09) (john ...Keller Williams Realty Professionals
 

Más de Keller Williams Realty Professionals (20)

Listing presentation generic (john hatch's conflicted copy 2014 10-09) (john ...
Listing presentation generic (john hatch's conflicted copy 2014 10-09) (john ...Listing presentation generic (john hatch's conflicted copy 2014 10-09) (john ...
Listing presentation generic (john hatch's conflicted copy 2014 10-09) (john ...
 
Sellers packet
Sellers packetSellers packet
Sellers packet
 
Listing presentation generic
Listing presentation genericListing presentation generic
Listing presentation generic
 
Sellers packet
Sellers packetSellers packet
Sellers packet
 
Newsletter dec 2010t
Newsletter dec 2010tNewsletter dec 2010t
Newsletter dec 2010t
 
Sellers information package
Sellers information packageSellers information package
Sellers information package
 
Sept2010marketupdate
Sept2010marketupdateSept2010marketupdate
Sept2010marketupdate
 
Realtor.com listing presentation_excerpt
Realtor.com listing presentation_excerptRealtor.com listing presentation_excerpt
Realtor.com listing presentation_excerpt
 
School boundary
School boundarySchool boundary
School boundary
 
Winning with foreclosures
Winning with foreclosuresWinning with foreclosures
Winning with foreclosures
 
Total Market overview may us_2010
Total Market overview may us_2010Total Market overview may us_2010
Total Market overview may us_2010
 
Tmo Feb
Tmo FebTmo Feb
Tmo Feb
 
02 This Month In Real Estate February Us 2010[1]
02 This Month In Real Estate   February   Us 2010[1]02 This Month In Real Estate   February   Us 2010[1]
02 This Month In Real Estate February Us 2010[1]
 
Total Market Overview
Total Market OverviewTotal Market Overview
Total Market Overview
 
Total Market overview for Portland
Total Market overview for PortlandTotal Market overview for Portland
Total Market overview for Portland
 
This Month In Real Estate December Us
This Month In Real Estate December   UsThis Month In Real Estate December   Us
This Month In Real Estate December Us
 
This Month In Real Estate November Us
This Month In Real Estate   November   UsThis Month In Real Estate   November   Us
This Month In Real Estate November Us
 
This Month In Real Estate October
This Month In Real Estate   OctoberThis Month In Real Estate   October
This Month In Real Estate October
 
Tmire Us August
Tmire   Us   AugustTmire   Us   August
Tmire Us August
 
This Month in Real Estate- July 09
This Month in Real Estate- July 09This Month in Real Estate- July 09
This Month in Real Estate- July 09
 

Último

The Gale at Godrej Park World Hinjewadi Pune Brochure.pdf
The Gale at Godrej Park World Hinjewadi Pune Brochure.pdfThe Gale at Godrej Park World Hinjewadi Pune Brochure.pdf
The Gale at Godrej Park World Hinjewadi Pune Brochure.pdfPrachiRudram
 
Vanam At Purva Soukhyam Guduvanchery.pdf.pdf
Vanam At Purva Soukhyam Guduvanchery.pdf.pdfVanam At Purva Soukhyam Guduvanchery.pdf.pdf
Vanam At Purva Soukhyam Guduvanchery.pdf.pdfkratirudram
 
BPTP THE AMAARIO Luxury Project Invest Like Royalty in Sector 37D Gurgaon Dwa...
BPTP THE AMAARIO Luxury Project Invest Like Royalty in Sector 37D Gurgaon Dwa...BPTP THE AMAARIO Luxury Project Invest Like Royalty in Sector 37D Gurgaon Dwa...
BPTP THE AMAARIO Luxury Project Invest Like Royalty in Sector 37D Gurgaon Dwa...ApartmentWala1
 
Yedi Mavi TOBB Zeytinburnu - Listing Turkey
Yedi Mavi TOBB Zeytinburnu - Listing TurkeyYedi Mavi TOBB Zeytinburnu - Listing Turkey
Yedi Mavi TOBB Zeytinburnu - Listing TurkeyListing Turkey
 
Bptp The Amaario Launch Luxury Project Sector 37D Gurgaon Dwarka Expressway...
Bptp The Amaario Launch  Luxury Project  Sector 37D Gurgaon Dwarka Expressway...Bptp The Amaario Launch  Luxury Project  Sector 37D Gurgaon Dwarka Expressway...
Bptp The Amaario Launch Luxury Project Sector 37D Gurgaon Dwarka Expressway...ApartmentWala1
 
Call girls in Shakti Nagar Delhi~8447779280°/=@/ Short 1500 Night 6000}ESCORT...
Call girls in Shakti Nagar Delhi~8447779280°/=@/ Short 1500 Night 6000}ESCORT...Call girls in Shakti Nagar Delhi~8447779280°/=@/ Short 1500 Night 6000}ESCORT...
Call girls in Shakti Nagar Delhi~8447779280°/=@/ Short 1500 Night 6000}ESCORT...asmaqueen5
 
BPTP THE AMAARIO For The Royals Of Tomorrow in Sector 37D Gurgaon Dwarka Expr...
BPTP THE AMAARIO For The Royals Of Tomorrow in Sector 37D Gurgaon Dwarka Expr...BPTP THE AMAARIO For The Royals Of Tomorrow in Sector 37D Gurgaon Dwarka Expr...
BPTP THE AMAARIO For The Royals Of Tomorrow in Sector 37D Gurgaon Dwarka Expr...ApartmentWala1
 
Prestige Sancoale Goa Residneces Brochure.pdf
Prestige Sancoale Goa Residneces Brochure.pdfPrestige Sancoale Goa Residneces Brochure.pdf
Prestige Sancoale Goa Residneces Brochure.pdfkishor21012022
 
Call Girls in Maurice Nagar (Delhi) ꧁8447779280꧂ Female Escorts Service in De...
Call Girls in Maurice Nagar (Delhi) ꧁8447779280꧂ Female Escorts Service in De...Call Girls in Maurice Nagar (Delhi) ꧁8447779280꧂ Female Escorts Service in De...
Call Girls in Maurice Nagar (Delhi) ꧁8447779280꧂ Female Escorts Service in De...asmaqueen5
 
Madhugiri Boucher Managed Farmland (knx)
Madhugiri Boucher Managed Farmland (knx)Madhugiri Boucher Managed Farmland (knx)
Madhugiri Boucher Managed Farmland (knx)knoxdigital1
 
Cheap Rate ✨➥9582086666▻✨Call Girls In Gurgaon Sector 1 (Gurgaon)
Cheap Rate ✨➥9582086666▻✨Call Girls In Gurgaon Sector 1 (Gurgaon)Cheap Rate ✨➥9582086666▻✨Call Girls In Gurgaon Sector 1 (Gurgaon)
Cheap Rate ✨➥9582086666▻✨Call Girls In Gurgaon Sector 1 (Gurgaon)delhi24hrs1
 
Best Interior Design Services in Haldwani
Best Interior Design Services in HaldwaniBest Interior Design Services in Haldwani
Best Interior Design Services in HaldwaniGeomatrix
 
MEQ Mainstreet Equity Corp Q2 2024 Investor Presentation
MEQ Mainstreet Equity Corp Q2 2024 Investor PresentationMEQ Mainstreet Equity Corp Q2 2024 Investor Presentation
MEQ Mainstreet Equity Corp Q2 2024 Investor PresentationMEQ - Mainstreet Equity Corp.
 
Acibadem Konaklari Uskudar - Listin Turkey
Acibadem Konaklari Uskudar - Listin TurkeyAcibadem Konaklari Uskudar - Listin Turkey
Acibadem Konaklari Uskudar - Listin TurkeyListing Turkey
 
Nyati Elite NIBM Road Pune E Brochure.pdf
Nyati Elite NIBM Road Pune E Brochure.pdfNyati Elite NIBM Road Pune E Brochure.pdf
Nyati Elite NIBM Road Pune E Brochure.pdfabbu831446
 
Low Rate ✨➥9711108085▻✨Call Girls In East Of Kailash (E.K) (Delhi)
Low Rate ✨➥9711108085▻✨Call Girls In East Of Kailash (E.K) (Delhi)Low Rate ✨➥9711108085▻✨Call Girls In East Of Kailash (E.K) (Delhi)
Low Rate ✨➥9711108085▻✨Call Girls In East Of Kailash (E.K) (Delhi)delhi24hrs1
 
ACE Terra Yamuna Expressway | 8929888700
ACE Terra Yamuna Expressway | 8929888700ACE Terra Yamuna Expressway | 8929888700
ACE Terra Yamuna Expressway | 8929888700Truhomes
 
Top tourism places in Dubai - Inch & Brick Realty
Top tourism places in Dubai - Inch & Brick RealtyTop tourism places in Dubai - Inch & Brick Realty
Top tourism places in Dubai - Inch & Brick Realtypunitranainchbrick02
 
Kohinoor Courtyard One Wakad Pune | Elegant Living Spaces
Kohinoor Courtyard One Wakad Pune | Elegant Living SpacesKohinoor Courtyard One Wakad Pune | Elegant Living Spaces
Kohinoor Courtyard One Wakad Pune | Elegant Living Spacesaidasheikh47
 
Parksville 96 Surrey Floor Plans May 2024
Parksville 96 Surrey Floor Plans May 2024Parksville 96 Surrey Floor Plans May 2024
Parksville 96 Surrey Floor Plans May 2024VickyAulakh1
 

Último (20)

The Gale at Godrej Park World Hinjewadi Pune Brochure.pdf
The Gale at Godrej Park World Hinjewadi Pune Brochure.pdfThe Gale at Godrej Park World Hinjewadi Pune Brochure.pdf
The Gale at Godrej Park World Hinjewadi Pune Brochure.pdf
 
Vanam At Purva Soukhyam Guduvanchery.pdf.pdf
Vanam At Purva Soukhyam Guduvanchery.pdf.pdfVanam At Purva Soukhyam Guduvanchery.pdf.pdf
Vanam At Purva Soukhyam Guduvanchery.pdf.pdf
 
BPTP THE AMAARIO Luxury Project Invest Like Royalty in Sector 37D Gurgaon Dwa...
BPTP THE AMAARIO Luxury Project Invest Like Royalty in Sector 37D Gurgaon Dwa...BPTP THE AMAARIO Luxury Project Invest Like Royalty in Sector 37D Gurgaon Dwa...
BPTP THE AMAARIO Luxury Project Invest Like Royalty in Sector 37D Gurgaon Dwa...
 
Yedi Mavi TOBB Zeytinburnu - Listing Turkey
Yedi Mavi TOBB Zeytinburnu - Listing TurkeyYedi Mavi TOBB Zeytinburnu - Listing Turkey
Yedi Mavi TOBB Zeytinburnu - Listing Turkey
 
Bptp The Amaario Launch Luxury Project Sector 37D Gurgaon Dwarka Expressway...
Bptp The Amaario Launch  Luxury Project  Sector 37D Gurgaon Dwarka Expressway...Bptp The Amaario Launch  Luxury Project  Sector 37D Gurgaon Dwarka Expressway...
Bptp The Amaario Launch Luxury Project Sector 37D Gurgaon Dwarka Expressway...
 
Call girls in Shakti Nagar Delhi~8447779280°/=@/ Short 1500 Night 6000}ESCORT...
Call girls in Shakti Nagar Delhi~8447779280°/=@/ Short 1500 Night 6000}ESCORT...Call girls in Shakti Nagar Delhi~8447779280°/=@/ Short 1500 Night 6000}ESCORT...
Call girls in Shakti Nagar Delhi~8447779280°/=@/ Short 1500 Night 6000}ESCORT...
 
BPTP THE AMAARIO For The Royals Of Tomorrow in Sector 37D Gurgaon Dwarka Expr...
BPTP THE AMAARIO For The Royals Of Tomorrow in Sector 37D Gurgaon Dwarka Expr...BPTP THE AMAARIO For The Royals Of Tomorrow in Sector 37D Gurgaon Dwarka Expr...
BPTP THE AMAARIO For The Royals Of Tomorrow in Sector 37D Gurgaon Dwarka Expr...
 
Prestige Sancoale Goa Residneces Brochure.pdf
Prestige Sancoale Goa Residneces Brochure.pdfPrestige Sancoale Goa Residneces Brochure.pdf
Prestige Sancoale Goa Residneces Brochure.pdf
 
Call Girls in Maurice Nagar (Delhi) ꧁8447779280꧂ Female Escorts Service in De...
Call Girls in Maurice Nagar (Delhi) ꧁8447779280꧂ Female Escorts Service in De...Call Girls in Maurice Nagar (Delhi) ꧁8447779280꧂ Female Escorts Service in De...
Call Girls in Maurice Nagar (Delhi) ꧁8447779280꧂ Female Escorts Service in De...
 
Madhugiri Boucher Managed Farmland (knx)
Madhugiri Boucher Managed Farmland (knx)Madhugiri Boucher Managed Farmland (knx)
Madhugiri Boucher Managed Farmland (knx)
 
Cheap Rate ✨➥9582086666▻✨Call Girls In Gurgaon Sector 1 (Gurgaon)
Cheap Rate ✨➥9582086666▻✨Call Girls In Gurgaon Sector 1 (Gurgaon)Cheap Rate ✨➥9582086666▻✨Call Girls In Gurgaon Sector 1 (Gurgaon)
Cheap Rate ✨➥9582086666▻✨Call Girls In Gurgaon Sector 1 (Gurgaon)
 
Best Interior Design Services in Haldwani
Best Interior Design Services in HaldwaniBest Interior Design Services in Haldwani
Best Interior Design Services in Haldwani
 
MEQ Mainstreet Equity Corp Q2 2024 Investor Presentation
MEQ Mainstreet Equity Corp Q2 2024 Investor PresentationMEQ Mainstreet Equity Corp Q2 2024 Investor Presentation
MEQ Mainstreet Equity Corp Q2 2024 Investor Presentation
 
Acibadem Konaklari Uskudar - Listin Turkey
Acibadem Konaklari Uskudar - Listin TurkeyAcibadem Konaklari Uskudar - Listin Turkey
Acibadem Konaklari Uskudar - Listin Turkey
 
Nyati Elite NIBM Road Pune E Brochure.pdf
Nyati Elite NIBM Road Pune E Brochure.pdfNyati Elite NIBM Road Pune E Brochure.pdf
Nyati Elite NIBM Road Pune E Brochure.pdf
 
Low Rate ✨➥9711108085▻✨Call Girls In East Of Kailash (E.K) (Delhi)
Low Rate ✨➥9711108085▻✨Call Girls In East Of Kailash (E.K) (Delhi)Low Rate ✨➥9711108085▻✨Call Girls In East Of Kailash (E.K) (Delhi)
Low Rate ✨➥9711108085▻✨Call Girls In East Of Kailash (E.K) (Delhi)
 
ACE Terra Yamuna Expressway | 8929888700
ACE Terra Yamuna Expressway | 8929888700ACE Terra Yamuna Expressway | 8929888700
ACE Terra Yamuna Expressway | 8929888700
 
Top tourism places in Dubai - Inch & Brick Realty
Top tourism places in Dubai - Inch & Brick RealtyTop tourism places in Dubai - Inch & Brick Realty
Top tourism places in Dubai - Inch & Brick Realty
 
Kohinoor Courtyard One Wakad Pune | Elegant Living Spaces
Kohinoor Courtyard One Wakad Pune | Elegant Living SpacesKohinoor Courtyard One Wakad Pune | Elegant Living Spaces
Kohinoor Courtyard One Wakad Pune | Elegant Living Spaces
 
Parksville 96 Surrey Floor Plans May 2024
Parksville 96 Surrey Floor Plans May 2024Parksville 96 Surrey Floor Plans May 2024
Parksville 96 Surrey Floor Plans May 2024
 

RMLS oct market action report

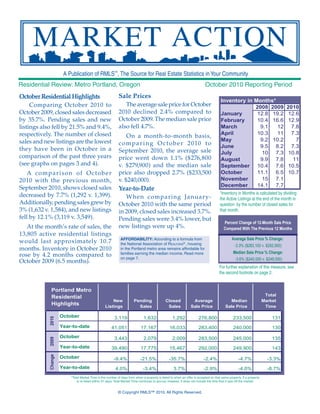
  • 1. A Publication of RMLS™, The Source for Real Estate Statistics in Your Community Residential Review: Metro Portland, Oregon October 2010 Reporting Period October Residential Highlights Sale Prices Inventory in Months* Comparing October 2010 to The average sale price for October 2008 2009 2010 October 2009, closed sales decreased 2010 declined 2.4% compared to January 12.8 19.2 12.6 by 35.7%. Pending sales and new October 2009. The median sale price February 10.4 16.6 12.9 listings also fell by 21.5% and 9.4%, also fell 4.7%. March 9.1 12 7.8 respectively. The number of closed April 10.3 11 7.3 On a month-to-month basis, sales and new listings are the lowest May 9.2 10.2 7 c o m p a r i n g O c t o b e r 2 010 t o June 9.5 8.2 7.3 they have been in October in a September 2010, the average sale July 10 7.3 10.8 comparison of the past three years price went down 1.1% ($276,800 August 9.9 7.8 11 (see graphs on pages 3 and 4). v. $279,900) and the median sale September 10.4 7.6 10.5 A comparison of October price also dropped 2.7% ($233,500 October 11.1 6.5 10.7 2010 with the previous month, v. $240,000). November 15 7.1 September 2010, shows closed sales December 14.1 7.7 Year-to-Date decreased by 7.7% (1,292 v. 1,399). *Inventory in Months is calculated by dividing When comparing January- the Active Listings at the end of the month in Additionally, pending sales grew by October 2010 with the same period question by the number of closed sales for 3% (1,632 v. 1,584), and new listings in 2009, closed sales increased 3.7%. that month. fell by 12.1% (3,119 v. 3,549). Pending sales were 3.4% lower, but Percent Change of 12-Month Sale Price At the month’s rate of sales, the new listings were up 4%. Compared With The Previous 12 Months 13,805 active residential listings AFFORDABILITY: According to a formula from Average Sale Price % Change: would last approximately 10.7 the National Association of REALTORS® , housing -3.3% ($283,100 v. $292,900) months. Inventory in October 2010 in the Portland metro area remains affordable for families earning the median income. Read more Median Sale Price % Change: rose by 4.2 months compared to on page 7. -3.6% ($240,000 v. $249,000) October 2009 (6.5 months). For further explanation of this measure, see the second footnote on page 2. Portland Metro Total Residential New Pending Closed Average Median Market Highlights Listings Sales Sales Sale Price Sale Price Time October 3,119 1,632 1,292 276,800 233,500 131 2010 Year-to-date 41,051 17,167 16,033 283,400 240,000 130 October 3,443 2,079 2,009 283,500 245,000 135 2009 Year-to-date 39,490 17,775 15,467 292,000 249,900 143 Change October -9.4% -21.5% -35.7% -2.4% -4.7% -3.3% Year-to-date 4.0% -3.4% 3.7% -2.9% -4.0% -8.7% *Total Market Time is the number of days from when a property is listed to when an offer is accepted on that same property. If a property is re-listed within 31 days, Total Market Time continues to accrue; however, it does not include the time that it was off the market. © Copyright RMLS™ 2010. All Rights Reserved.
  • 2. AREA REPORT • 10/2010 Metro Portland & Adjacent Regions, Oregon RESIDENTIAL COMMERCIAL LAND MULTIFAMILY Current Month Year-To-Date Year-To-Date Year-To-Date Year-To-Date 1 Pending Sales 2010 v. 2009 Pending Sales 2010 v. 2009 2 Expired/Canceled Listings Avg. Sale Price % Change Pending Sales 2010 Pending Sales 2010 3 Average Sale Price Average Sale Price Average Sale Price Average Sale Price Average Sale Price Total Market Time Median Sale Price Active Listings Closed Sales Closed Sales Closed Sales Closed Sales Closed Sales New Listings New Listings 141 N Portland 535 155 147 70 -36.9% 45 239,100 96 1,813 719 -18.6% 645 231,600 225,000 -1.2% 7 239,300 23 79,200 17 281,600 142 NE Portland 1,061 337 248 157 -31.1% 137 279,200 132 3,992 1,772 -4.5% 1,671 284,700 249,000 -1.3% 18 368,800 28 101,300 40 381,100 143 SE Portland 1,413 397 315 212 -34.4% 155 225,300 90 5,005 2,241 -11.2% 2,110 238,100 208,000 -3.4% 24 366,800 34 182,300 74 430,300 Gresham/ 144 Troutdale 968 186 168 126 -10.0% 90 214,000 106 2,758 1,149 -1.5% 1,059 213,900 202,000 -3.8% 9 250,300 40 97,500 23 248,900 Milwaukie/ 145 Clackamas 1,104 263 188 127 -6.6% 111 262,300 132 3,113 1,276 -3.5% 1,180 262,800 240,000 -6.7% 2 123,900 60 104,700 13 184,900 Oregon City/ 146 Canby 816 142 128 68 -32.0% 62 251,300 143 2,114 824 -1.6% 790 257,500 230,000 -8.4% 12 224,000 34 139,000 7 317,700 Lake Oswego/ 147 West Linn 956 186 187 84 -16.0% 72 414,200 209 2,596 936 10.6% 886 436,700 385,000 -8.0% 4 378,800 31 253,300 2 417,500 148 W Portland 1,676 351 343 211 -5.4% 146 411,100 175 4,957 1,944 11.0% 1,786 409,900 340,000 -5.0% 4 592,300 28 198,800 19 525,600 149 NW Wash Co. 591 137 100 87 26.1% 69 375,300 110 1,877 874 9.5% 819 368,100 338,000 -2.8% 3 168,000 18 291,700 5 274,000 Beaverton/ 150 Aloha 1,201 289 220 143 -35.9% 114 207,600 120 3,787 1,576 -13.4% 1,484 240,800 217,000 -0.8% 6 209,800 17 381,300 27 254,000 Tigard/ 151 Wilsonville 1,137 261 215 126 -16.0% 110 297,800 126 3,330 1,415 0.1% 1,338 304,200 278,500 -4.5% 3 201,700 30 250,900 19 245,900 Hillsboro/ 152 Forest Grove 856 187 139 95 -31.7% 88 216,900 127 2,558 1,203 -5.5% 1,128 228,100 209,000 -7.6% 9 265,000 32 349,600 20 172,800 153 Mt. Hood 142 22 27 13 -23.5% 8 230,500 70 290 89 -3.3% 81 207,000 180,000 -19.7% - - 10 108,200 - - 155 Columbia Co. 510 65 79 46 0.0% 33 174,700 127 1,089 398 -6.6% 373 185,000 178,400 -9.4% 4 192,000 15 124,000 4 223,300 156 Yamhill Co. 839 141 148 67 -9.5% 52 210,200 157 1,772 751 -1.8% 683 217,400 192,000 -6.9% 8 204,900 29 139,000 9 201,600 168-178 Marion/Polk Counties 1,160 175 188 81 -24.3% 65 177,300 171 2,216 748 -12.0% 697 199,100 176,000 -5.4% 10 274,800 59 76,400 14 454,500 180-195 North Coastal 200 Counties 1,585 179 239 76 -10.6% 54 276,700 148 2,405 710 12.7% 640 279,200 225,000 -4.9% 18 482,900 95 158,200 12 234,700 1 Percent change in number of pending sales this year compared to last year. The Current Month section compares October 2010 with October 2009. The Year-To- Date section compares year-to-date statistics from October 2010 with year-to-date statistics from October 2009. 2 % Change is based on a comparison of the rolling average sale price for the last 12 months (11/1/09-10/31/10) with 12 months before (11/1/08-10/31/09). 3 Total Market Time is the number of days from when a property is listed to when an offer is accepted on that same property. If a property is re-listed within 31 days, Total Market Time continues to accrue; however, it does not include the time that it was off the market. 2 © Copyright RMLS™ 2010. All Rights Reserved.
  • 3. ACTIVE Active Residential Listings RESIDENTIAL 20000 LISTINGS 18000 PORTLAND, OR 16000 This graph shows the active 14000 12000 residential listings over the 10000 8000 past three calendar years 6000 in the greater Portland, 4000 Oregon metropolitan area. 2008 2009 2010 TOTAL ACTIVE Total Active Listings LISTINGS PORTLAND, OR 25000 22500 This graph shows the 20000 total active listings over 17500 15000 the past three calendar 12500 10000 years in the greater 7500 Portland, Oregon 5000 metropolitan area. Total Active Listings 2008 Total Active Listings 2009 Total Active Listings 2010 NEW LISTINGS New Listings PORTLAND, OR 6,000 This graph shows the 5,000 new residential listings 4,000 over the past three 3,000 2,000 calendar years in the 1,000 greater Portland, Oregon 0 metropolitan area. 2008 2009 2010 3 © Copyright RMLS™ 2010. All Rights Reserved.
  • 4. PENDING LISTINGS Pending Sales PORTLAND, OR 3,500 This graph represents 3,000 monthly accepted offers 2,500 in the Portland, Oregon 2,000 1,500 metropolitan area over 1,000 the past three calendar 500 years. 0 2008 2009 2010 CLOSED SALES Closed Sales PORTLAND, OR This graph shows the 2,500 closed sales over the past 2,000 three calendar years in 1,500 the greater Portland, 1,000 Oregon metropolitan 500 area. 0 2008 2009 2010 Average Market Time DAYS ON MARKET 180 PORTLAND, OR 160 This graph shows the 140 120 average market time for 100 80 sales in the Portland, 60 40 Oregon metropolitan area. 20 *As of August 2008, graph 0 now reports “Total Days on Market” - for details 2008 2009 TMT 2008 TMT 2010 TMT read footnotes on page 2. 4 © Copyright RMLS™ 2010. All Rights Reserved.
  • 5. AVERAGE SALE This graph represents the average sale price for all homes sold in the Portland, PRICE Oregon metropolitan area. PORTLAND, OR Average Sale Price $400,000 $350,000 $300,000 $250,000 $200,000 $150,000 $100,000 Oct-00 Oct-01 Oct-02 Oct-03 Oct-04 Oct-05 Oct-06 Oct-07 Oct-08 Oct-09 Oct-10 Apr-01 Apr-02 Apr-03 Apr-04 Apr-05 Apr-06 Apr-07 Apr-08 Apr-09 Apr-10 Median Sale Price: Portland, OR & Clark Co., WA MEDIAN SALE PRICE 260000 PORTLAND, OR 240000 This graph shows the 220000 200000 median sale price over 180000 the past 12 months in the 160000 greater Portland, Oregon 140000 metropolitan area and 120000 Clark County. 100000 OCT NOV DEC JAN FEB MAR APR MAY JUNE JULY AUG SEPT OCT Clark County Metro Portland, OR 5 © Copyright RMLS™ 2010. All Rights Reserved.
  • 6. MEDIAN SALE PRICE October 2010 SW WASHINGTON $250,000 $214,300 Woodland N/NE Clark County $215,200 PORTLAND $241,500 Battle Ground Ridgefield/La Center METRO $ 156,800 Columbia County $201,000 $254,900 Salmon Creek Brush Prairie $221,500 Hockinson Felida $180,000 $ 345,000 Hazel $165,000 Dell 5 Corners Minnehaha Orch. North Washington County $158,000 $179,000 Sauvie Island Cent. Vancouver Cascade Park $192,200 Heights $225,900 $240,000 N Portland Camas/Washougal $ 241,500 NE $ 200,300 Portland $ 316,800 Hillsboro West $ 190,500 $ 182,600 Gresham Forest Grove Portland $ 195,200 SE Troutdale Portland Sandy Beaverton Corbett Aloha $ 235,000 Fairview $ 170,000 Milwaukie/Gladstone/ Mt. Hood: Boring/Clackamas Zigzag Estacada $ 265,500 $ 383,000 Welches Rhododendron Tigard/Tualatin Wemme Sherwood Lake Oswego Brightwood Wilsonville West Government Camp Linn $ 193,500 Yamhill County $ 238,000 Oregon City Canby Molalla Beavercreek 6 © Copyright RMLS™ 2010. All Rights Reserved.
  • 7. MULTIPLE LISTING SERVICE MEDIAN SALE This graph represents the median sale price for all Corporate 825 NE Multnomah, Suite 270 PRICE CONDOS condos sold in the last three calendar years in the Portland, OR 97232 (503) 236-7657 PORTLAND, OR Fax: (503) 230-0689 Portland, Oregon metropolitan area. Southwest Washington 1514 Broadway, Suite 101 Vancouver, WA 98663 Median Condo Sale Price (360) 696-0718 Fax: (360) 696-9342 $250,000 Salem 2110 Mission St. SE, Suite 305 Salem, OR 97302 $225,000 (503) 587-8810 Fax: (503) 585-3817 Lane County: Eugene $200,000 2139 Centennial Plaza Eugene, OR 97401 $175,000 (541) 686-2885 Fax: (541) 484-3854 Lane County: Florence $150,000 PO Box 414 Florence, OR 97439 (541) 902-2560 Fax: (541) 902-1341 Douglas County 2008 2009 2010 3510 NE Edenbower Roseburg, OR 97470 (541) 673-3571 Fax: (541) 673-6581 AFFORDABILITY This graph shows affordability for housing in the Curry County PO Box 6307 PORTLAND, OR Portland, Oregon metropolitan area in September 2010. Brookings, OR 97415 (541) 469-0219 Fax: (541) 469-9695 Mid-Columbia PO Box 1088 Affordability Index Hood River, OR 97031 (541) 436-2956 180 Fax: (541) 387-6657 160 Eastern Oregon 140 PO Box 751 Hermiston, OR 97838 120 (541) 567-5186 100 Fax: (541) 289-7320 80 Coos County 1946 Sherman Ave., Suite 101 60 North Bend, OR 97459 40 (541) 751-1070 Fax: (541) 751-1083 20 0 Mar-07 Mar-08 Mar-09 Mar-10 Mar-04 Jun-04 Mar-05 Jun-05 Mar-06 Jun-06 Jun-07 Jun-08 Jun-09 Jun-10 Sep-03 Dec-03 Sep-04 Dec-04 Sep-05 Dec-05 Sep-06 Dec-06 Sep-07 Sep-08 Sep-09 Sep-10 Dec-07 Dec-08 Dec-09 The statistics presented in Market Action are compiled monthly based on figures generated by RMLS™. Statistics reflect reported activity for the greater Portland, Oregon metropolitan area, to include Multnomah, Washington, Clackamas, Yamhill, & Columbia counties; AFFORDABILITY - According to a formula from the National Association of REALTORS®, buying a house in the Portland Lane, Douglas, Coos & Curry Counties in metro area is affordable for a family earning the median income. A family earning the median income ($71,200 in 2010, per Oregon; portions of other Oregon Counties; HUD) can afford 155% of a monthly mortgage payment on a median priced home ($240,000 in September). The formula and Clark, Cowlitz & Pacific Counties in assumes that the buyer has a 20% down payment and a 30 year fixed rate of 4.35% (per Freddie Mac). Washington. RMLS™ was formed by area Boards and Associations of REALTORS® in 1991. Gary Whiting, Chairman of the Board E-mail subscriptions are available for $45 per year by contacting RMLS™, (503) Kurt von Wasmuth, President/CEO 236-7657. Reproduction of any portion of Kelsey Brunson, Editor this copyrighted material is prohibited without prior approval of RMLS™. Danny Gottleib, Assistant Editor © Copyright RMLS™ 2010. All Rights Reserved.