
Recomendados
Más contenido relacionado
La actualidad más candente
La actualidad más candente (20)
Destacado
Destacado (10)
Similar a 61107576 rallis-india
Similar a 61107576 rallis-india (20)
Último
Último (20)
61107576 rallis-india
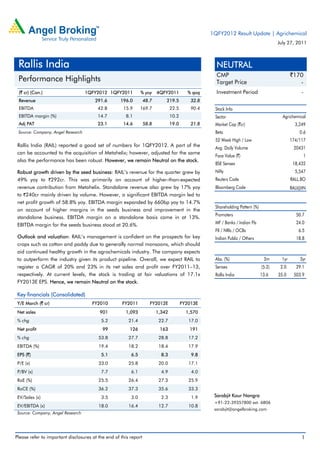
- 1. 1QFY2012 Result Update | Agrichemical July 27, 2011 Rallis India NEUTRAL CMP `170 Performance Highlights Target Price - (` cr) (Con.) 1QFY2012 1QFY2011 % yoy 4QFY2011 % qoq Investment Period - Revenue 291.6 196.0 48.7 219.5 32.8 EBITDA 42.8 15.9 169.7 22.5 90.4 Stock Info EBITDA margin (%) 14.7 8.1 10.2 Sector Agrichemical Adj PAT 23.1 14.6 58.8 19.0 21.8 Market Cap (`cr) 3,249 Source: Company, Angel Research Beta 0.6 52 Week High / Low 174/117 Rallis India (RAIL) reported a good set of numbers for 1QFY2012. A part of the Avg. Daily Volume 20431 can be accounted to the acquisition of Metahelix; however, adjusted for the same Face Value (`) 1 also the performance has been robust. However, we remain Neutral on the stock. BSE Sensex 18,432 Robust growth driven by the seed business: RAIL’s revenue for the quarter grew by Nifty 5,547 49% yoy to `292cr. This was primarily on account of higher-than-expected Reuters Code RALL.BO revenue contribution from Metahelix. Standalone revenue also grew by 17% yoy Bloomberg Code RALI@IN to `240cr mainly driven by volume. However, a significant EBITDA margin led to net profit growth of 58.8% yoy. EBITDA margin expanded by 660bp yoy to 14.7% Shareholding Pattern (%) on account of higher margins in the seeds business and improvement in the Promoters 50.7 standalone business. EBITDA margin on a standalone basis came in at 13%. EBITDA margin for the seeds business stood at 20.6%. MF / Banks / Indian Fls 24.0 FII / NRIs / OCBs 6.5 Outlook and valuation: RAIL’s management is confident on the prospects for key Indian Public / Others 18.8 crops such as cotton and paddy due to generally normal monsoons, which should aid continued healthy growth in the agrochemicals industry. The company expects to outperform the industry given its product pipeline. Overall, we expect RAIL to Abs. (%) 3m 1yr 3yr register a CAGR of 20% and 23% in its net sales and profit over FY2011–13, Sensex (5.2) 2.0 29.1 respectively. At current levels, the stock is trading at fair valuations of 17.1x Rallis India 13.6 35.0 503.9 FY2013E EPS. Hence, we remain Neutral on the stock. Key financials (Consolidated) Y/E March (` cr) FY2010 FY2011 FY2012E FY2013E Net sales 901 1,093 1,342 1,570 % chg 5.2 21.4 22.7 17.0 Net profit 99 126 163 191 % chg 53.8 27.7 28.8 17.2 EBITDA (%) 19.4 18.2 18.4 17.9 EPS (`) 5.1 6.5 8.3 9.8 P/E (x) 33.0 25.8 20.0 17.1 P/BV (x) 7.7 6.1 4.9 4.0 RoE (%) 25.5 26.4 27.3 25.9 RoCE (%) 36.2 37.3 35.6 33.3 EV/Sales (x) 3.5 3.0 2.3 1.9 Sarabjit Kour Nangra +91-22-39357800 ext. 6806 EV/EBITDA (x) 18.0 16.4 12.7 10.8 sarabjit@angelbroking.com Source: Company, Angel Research Please refer to important disclosures at the end of this report 1
- 2. Rallis India | 1QFY2012 Result Update Exhibit 1: 1QFY2012 Performance (Consolidated) Y/E March (` cr) 1QFY2012 4QFY2011 % chg (qoq) 1QFY2011 % chg (yoy) FY2011 FY2010 % chg Net sales 292 220 32.8 196 48.7 1,066 879 21.3 Other income 6 13 (53.8) 8 (26.0) 33.1 28.4 16.6 Total income 298 233 28.0 204 45.8 1,099 907 21.1 Gross profit 125 83 50.2 74 68.8 418 372 12.6 Gross margin (%) 42.9 38.0 37.8 39.3 42.3 Operating profit 43 22 90.4 15.9 169.7 171.3 144.9 18.3 Operating margin (%) 14.7 10.2 8.1 16.1 16.5 Financial cost 3 2 59.9 -1 (414.4) 3 2 10.6 Depreciation 5 5 3.8 4 52.0 17 19 -9.5 PBT 41 29 42.2 21 90.0 184 152 21.6 Provision for taxation 8 10 (18.6) 7 14.6 58 51 13.3 PAT before Extra-ordinary item 33 19 72.7 15 125.2 126 100 25.8 Exceptional 0 0 0 0 0 Minority 5 0 0 0 0 PAT after extra-ordinary item & MI 23 19 21.8 15 58.8 126 100 25.4 EPS (`) 1.2 1.0 0.8 6.5 5.3 Source: Company, Angel Research Sales growth driven by the seeds business RAIL posted top-line growth of 48.7% yoy to `292cr, driven by robust performance in the domestic market and the seeds business. This was primarily on account of higher-than-expected revenue contribution from Metahelix. Standalone revenue also grew by 17% yoy to `240cr mainly driven by volume. The company acquired a majority stake of 53.5% in Metahelix Life Sciences in December 2010, with an investment of `99.5cr funded through internal accruals. Metahelix is an agricultural biotechnology company focusing on developing traits and technologies for crop protection and improved productivity. It reported revenue of `58.9cr, EBITDA of `12.3cr with EBITDA margin of 20.6% and PAT (after minority) of `6.6cr during the quarter. July 27, 2011 2
- 3. Rallis India | 1QFY2012 Result Update Exhibit 2: Total revenue performance 400 368 320 297 271 232 240 203 203 (` cr) 160 80 0 4Q2010 1Q2011 2Q2011 3Q2011 4Q2011 1Q2012 Source: Company, Angel Research Overall improvement in operating performance… For 1QFY2012, RAIL reported EBITDA margin of 14.7% (8.1%), registering 660bp yoy expansion, on account of higher margins in the seeds business and improvement in the standalone business. On a standalone basis, EBITDA margin stood at 13%. EBITDA margin of the seeds business stood at 20.6%. Exhibit 3: Margin trend 80 74 70 60 50 45 42 41 38 38 40 (%) 30 20 24 21 19 10 16 15 12 0 4Q2010 1Q2011 2Q2011 3Q2011 4Q2011 1Q2012 Gross margin EBITDA Source: Company, Angel Research …Resulting in robust earnings growth Adjusted PAT for the quarter came in at `23cr, registering a 58.8% yoy increase. Growth in net profit was on the back of the 169.7% yoy rise in operating profit. However, a decline in other income along with higher interest expenses during the quarter resulted in net profit growth. July 27, 2011 3
- 4. Rallis India | 1QFY2012 Result Update Exhibit 4: Adj. PAT trend 75 59 60 45 (` cr) 34 30 24 23 19 15 15 0 4Q2010 1Q2011 2Q2011 3Q2011 4Q2011 1Q2012 Source: Company, Angel Research Management meet – Key takeaways Management indicated that RAIL is in the process of getting the requisite approvals for contract manufacturing from Dahej plant and capacity would be ramped-up over the course of FY2012. The plant is expected to operate at close to its peak capacity from FY2013. Management announced that so far the company has introduced three products in the domestic formulations business in FY2012. Management is confident on the prospects for key crops such as cotton and paddy due to generally normal monsoons, which should aid continued healthy growth in the agrochemicals industry. RAIL expects to outperform the industry given its product pipeline. Investment arguments Set to seize rising opportunities in the domestic pesticides market: India's overall pesticide consumption is one of the lowest in the world, and we believe RAIL is well placed to seize this opportunity on the back of its wide distribution network, strong brands and robust new product pipeline. According to industry estimates, the unorganised market accounts for another 50% of the industry. Nonetheless, we believe RAIL is in a position to wrest market share as well as charge a premium for its products. Exports to register steady growth: Closing down of capacity in China before the 2008 Olympics and MNCs diversifying their base to India had resulted in the company’s exports spiking by 80% to `295cr in FY2009. The scenario, however, changed post the Olympics and many closed capacities have come on stream and prices of commodities have corrected, due to which exports declined by 35% in FY2010; however, exports improved by ~41% in FY2011. Against this backdrop, we estimate RAIL to post a 27% CAGR in exports over FY2011–13. July 27, 2011 4
- 5. Rallis India | 1QFY2012 Result Update Contract manufacturing to be the next growth driver: RAIL plans to focus on contract manufacturing for exports and selectively target and supply to the top players. To facilitate the same, the company is setting up a new plant at Dahej. Overall, RAIL targets to achieve cumulative revenue of `1,000cr over the next five years from this segment alone. Outlook and valuation Management is confident of the prospects for key crops such as cotton and paddy due to generally normal monsoons, which should aid continued healthy growth in the agrochemicals industry. RAIL expects to outperform the industry given its product pipeline. Overall, we expect RAIL to register a CAGR of 20% and 23% in its net sales and profit over FY2011–13, respectively. At current levels, the stock is trading at fair valuations of 17.4x FY2013E EPS. Hence, we remain Neutral on the stock. Exhibit 5: Key assumptions Particulars (%) FY2012E FY2013E Comment Domestic growth 15.0 12.0 Robust volume growth on account of normal monsoons Export growth 30.0 25.0 Revival in the export market, lower inventory in Latin American markets Total revenue growth 22.7 17.0 Gross margin 41.5 41.0 Higher penetration to see marginal reduction in prices EBITDA margin 18.4 17.9 Higher contribution from the low-margin contract manufacturing business Tax rate 25.0 25.0 Lower rate due to SEZ benefit Source: Company, Angel Research Exhibit 6: Peer valuation Company Reco Mcap CMP TP Upside P/E (x) EV/Sales (x) EV/EBITDA (x) RoE (%) CAGR (%) (` cr) (`) (`) (%) FY12E FY13E FY12E FY13E FY12E FY13E FY12E FY13E Sales PAT RAIL Neutral 3,249 167 - - 20.0 17.1 2.3 1.9 12.7 10.8 27.3 25.9 19.8 22.9 Bayer CropScience Neutral 3,500 899 - - 19.5 17.8 1.4 1.2 11.6 10.1 23.5 21.3 13.6 11.9 United Phosphorus Buy 7,545 163 224 38 9.7 8.7 1.1 1.1 5.9 5.6 17.6 17.1 9.3 18.0 Source: Company, Angel Research, Bloomberg Exhibit 7: One-year forward P/E band 180.0 160.0 140.0 Share price (`) 120.0 100.0 80.0 60.0 40.0 20.0 0.0 Apr-07 Jul-07 Apr-08 Jul-08 Apr-09 Jul-09 Apr-10 Jul-10 Apr-11 Oct-07 Oct-08 Oct-09 Oct-10 Jan-08 Jan-09 Jan-10 Jan-11 Price 7x 9x 11x 13x 15x Source: C-line, Angel Research July 27, 2011 5
- 6. Rallis India | 1QFY2012 Result Update Profit & loss (Consolidated) Y/E March (` cr) FY08 FY09 FY10 FY11E FY12E FY13E Total operating income 675 856 901 1,093 1,342 1,570 % chg 9.4 26.9 5.2 21.4 22.7 17.0 Total Expenditure 615 719 726 894 1,095 1,289 Net Raw Materials 411 507 506 634 785 926 Other Mfg costs 134 134 137 188 170 199 Personnel 62 67 67 73 113 132 Other 9 11 15 - 27 31 EBITDA 59 137 175 199 247 281 % chg 340.6 131.2 28.0 13.9 23.9 13.8 (% of Net Sales) 8.8 16.0 19.4 18.2 18.4 17.9 Depreciation& Amortisation 20 23 18 17 33 35 EBIT 39 114 157 182 214 246 % chg (322.1) 191.3 37.7 16.0 17.6 15.1 (% of Net Sales) 5.8 13.3 17.4 16.6 15.9 15.7 Interest & other Charges 12 11 5 3 - - Other Income 112 3 7 5 3 8 (% of PBT) 81 3 4 3 2 3 Share in profit of Associates Recurring PBT 139 106 158 185 217 254 % chg 190.4 (23.6) 49.5 16.6 17.4 17.2 Extraordinary Expense/(Inc.) (87) (6) (8) - - - PBT (reported) 52 100 150 185 217 254 Tax 21 35 51 58 54 64 (% of PBT) 15.2 33.3 32.3 31.4 25.0 25.0 PAT (reported) 31 64 99 127 163 191 Add: Share of earnings of associate - - - - - - Less: Minority interest (MI) - - - - - - Prior period items - - - - - - PAT after MI (reported) 31 64 99 126 163 191 ADJ. PAT 31 64 99 126 163 191 % chg (592.5) 110.2 53.8 27.7 28.8 17.2 (% of Net Sales) 3.9 7.5 10.9 11.5 12.1 12.1 Basic EPS (`) 2 4 5 6 8 10 Fully Diluted EPS (`) 2 4 5 6 8 10 % chg (592.5) 110.2 41.9 27.7 28.8 17.2 July 27, 2011 6
- 7. Rallis India | 1QFY2012 Result Update Balance sheet (Consolidated) Y/E March (` cr) FY08 FY09 FY10 FY11E FY12E FY13E SOURCES OF FUNDS Equity Share Capital 18 18 20 20 20 20 Preference Capital 88 88 - - - - Reserves & Surplus 202 244 405 513 641 793 Shareholders’ Funds 308 350 424 532 660 812 Minority Interest - - - - - - Total Loans 47 82 8 10 - - Deferred Tax Liability - - - - - 8 Total Liabilities 354 432 433 542 660 820 APPLICATION OF FUNDS Gross Block 296 338 309 496 521 547 Less: Acc. Depreciation 161 179 156 174 207 242 Net Block 135 159 153 322 314 305 Capital Work-in-Progress 13 29 112 18 18 18 Goodwill - - - - - - Investments 56 136 140 28 28 28 Current Assets 338 352 326 533 698 892 Cash 8 8 12 5 130 231 Loans & Advances 79 77 89 103 107 126 Other 250 266 226 425 461 535 Current liabilities 201 261 304 365 397 424 Net Current Assets 137 91 22 168 301 468 Mis. Exp. not written off 13 10 5 7 - 1 Total Assets 354 432 433 542 660 820 July 27, 2011 7
- 8. Rallis India | 1QFY2012 Result Update Cash flow statement (Consolidated) Y/E March (` cr) FY08 FY09 FY10 FY11E FY12E FY13E Profit before tax 146 107 153 185 217 254 Depreciation 20 23 18 17 33 35 Change in Working Capital (100) 33 110 (160) (17) (71) Less: Other income - -- - - - - Direct taxes paid (26) (31) (67) (51) (48) (56) Cash Flow from Operations (45) 139 215 (9) 185 162 (Inc.)/ Dec. in Fixed Assets 63 (64) (95) (93) (25) (26) (Inc.)/ Dec. in Investments (21) (78) 3 113 - - Inc./ (Dec.) in loans and advances - - - - - - Other income - - - - - - Cash Flow from Investing 42 (142) (91) 20 (25) (26) Issue of Equity - - 1 - - - Inc./(Dec.) in loans 11 37 (74) 2 (10) - Dividend Paid (Incl. Tax) (19) (30) (44) (15) (25) (34) Others (4) (3) (3) (3) (0) - Cash Flow from Financing (13) 3 (120) (16) (35) (34) Inc./(Dec.) in Cash (15) (0) 3 (5) 124 102 Opening Cash balances 22 8 8 12 5 130 Closing Cash balances 8 8 12 5 130 231 July 27, 2011 8
- 9. Rallis India | 1QFY2012 Result Update Key ratios Y/E March FY08 FY09 FY10 FY11E FY12E FY13E Valuation Ratio (x) P/E (on FDEPS) 98.3 46.8 33.0 25.8 20.0 17.1 P/CEPS 59.4 34.5 27.8 22.7 16.7 14.5 P/BV 13.7 11.5 7.7 6.1 4.9 4.0 Dividend yield (%) 0.6 0.6 0.7 0.7 0.9 1.0 EV/Sales 4.5 3.5 3.5 3.0 2.3 1.9 EV/EBITDA 51.5 21.8 18.0 16.4 12.7 10.8 EV / Total Assets 8.6 6.9 7.3 6.0 4.7 3.7 Per Share Data (`) EPS (Basic) 1.7 3.6 5.1 6.5 8.3 9.8 EPS (fully diluted) 1.7 3.6 5.1 6.5 8.3 9.8 Cash EPS 2.8 4.8 6.0 7.4 10.0 11.6 DPS 1.1 1.1 1.2 1.1 1.5 1.7 Book Value 12.2 14.5 21.8 27.3 33.9 41.7 Dupont Analysis EBIT margin 5.8 13.3 17.4 16.6 15.9 15.7 Tax retention ratio 84.8 66.7 67.7 68.6 75.0 75.0 Asset turnover (x) 2.4 2.6 2.9 2.6 2.5 2.8 ROIC (Post-tax) 11.6 22.9 33.9 29.5 30.1 33.0 Cost of Debt (Post Tax) 8.9 3.2 4.1 19.0 6.0 - Leverage (x) 0.2 - - - - - Operating ROE 24.9 22.9 33.9 29.5 30.1 33.0 Returns (%) ROCE (Pre-tax) 13.0 28.9 36.2 37.3 35.6 33.3 Angel ROIC (Pre-tax) 11.7 39.4 79.9 35.0 41.7 43.1 ROE 11.8 19.6 25.5 26.4 27.3 25.9 Turnover ratios (x) Asset Turnover (Gross Block) 2.3 2.7 2.8 2.7 2.6 2.9 Inventory / Sales (days) 74 63 60 65 68 64 Receivables (days) 52 46 39 43 53 51 Payables (days) 105 86 115 115 105 95 Working capital cycle (ex-cash) (days) 44 45 19 29 45 47 Solvency ratios (x) Net debt to equity 0.2 (0.1) (0.3) (0.1) (0.2) (0.4) Net debt to EBITDA 0.8 (0.1) (0.8) (0.3) (0.5) (1.1) Interest Coverage (EBIT / Interest) 3.2 10.6 29.3 72.4 534.6 - July 27, 2011 9
- 10. Rallis India | 1QFY2012 Result Update Research Team Tel: 022 - 39357800 E-mail: research@angelbroking.com Website: www.angelbroking.com DISCLAIMER This document is solely for the personal information of the recipient, and must not be singularly used as the basis of any investment decision. Nothing in this document should be construed as investment or financial advice. Each recipient of this document should make such investigations as they deem necessary to arrive at an independent evaluation of an investment in the securities of the companies referred to in this document (including the merits and risks involved), and should consult their own advisors to determine the merits and risks of such an investment. Angel Broking Limited, its affiliates, directors, its proprietary trading and investment businesses may, from time to time, make investment decisions that are inconsistent with or contradictory to the recommendations expressed herein. The views contained in this document are those of the analyst, and the company may or may not subscribe to all the views expressed within. Reports based on technical and derivative analysis center on studying charts of a stock's price movement, outstanding positions and trading volume, as opposed to focusing on a company's fundamentals and, as such, may not match with a report on a company's fundamentals. The information in this document has been printed on the basis of publicly available information, internal data and other reliable sources believed to be true, but we do not represent that it is accurate or complete and it should not be relied on as such, as this document is for general guidance only. Angel Broking Limited or any of its affiliates/ group companies shall not be in any way responsible for any loss or damage that may arise to any person from any inadvertent error in the information contained in this report. Angel Broking Limited has not independently verified all the information contained within this document. Accordingly, we cannot testify, nor make any representation or warranty, express or implied, to the accuracy, contents or data contained within this document. While Angel Broking Limited endeavours to update on a reasonable basis the information discussed in this material, there may be regulatory, compliance, or other reasons that prevent us from doing so. This document is being supplied to you solely for your information, and its contents, information or data may not be reproduced, redistributed or passed on, directly or indirectly. Angel Broking Limited and its affiliates may seek to provide or have engaged in providing corporate finance, investment banking or other advisory services in a merger or specific transaction to the companies referred to in this report, as on the date of this report or in the past. Neither Angel Broking Limited, nor its directors, employees or affiliates shall be liable for any loss or damage that may arise from or in connection with the use of this information. Note: Please refer to the important `Stock Holding Disclosure' report on the Angel website (Research Section). Also, please refer to the latest update on respective stocks for the disclosure status in respect of those stocks. Angel Broking Limited and its affiliates may have investment positions in the stocks recommended in this report. Disclosure of Interest Statement Rallis India 1. Analyst ownership of the stock No 2. Angel and its Group companies ownership of the stock No 3. Angel and its Group companies' Directors ownership of the stock No 4. Broking relationship with company covered No Note: We have not considered any Exposure below ` 1 lakh for Angel, its Group companies and Directors Ratings (Returns): Buy (> 15%) Accumulate (5% to 15%) Neutral (-5 to 5%) Reduce (-5% to 15%) Sell (< -15%) July 27, 2011 10