

Recomendados
Recomendados
Más contenido relacionado
La actualidad más candente
La actualidad más candente (20)
Destacado
Destacado (20)
Similar a GBF2007 - Urban Form + Public Health -David Sisam
Similar a GBF2007 - Urban Form + Public Health -David Sisam (20)
Más de Toronto 2030 District
Más de Toronto 2030 District (20)
Último
Último (20)
GBF2007 - Urban Form + Public Health -David Sisam
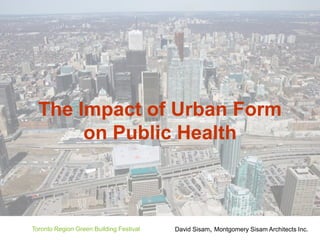
- 1. The Impact of Urban Form on Public Health Toronto Region Green Building Festival David Sisam, Montgomery Sisam Architects Inc.
- 2. 1. Some Background 2. The Health and Sustainability Iceberg 3. Definitions 4. Hype in Atlanta 5. Green in New York 6. Heat in Chicago 7. Opportunity in Toronto Toronto Region Green Building Festival
- 3. 1. Some Background Toronto Region Green Building Festival Healthcare
- 4. 1. Some Background Toronto Region Green Building Festival Urban Design
- 5. 1. Some Background Toronto Region Green Building Festival Green Building
- 6. 2. The Sustainability and Health Iceberg • Healthcare • Green Roofs • Solar Panels • LEED Buildings • Health • Urban Density • Mixture of Uses • Design Quality Toronto Region Green Building Festival
- 7. 3. Definitions Sustainable Development “Development … that meets the needs of the present without compromising the ability of future generations to meet their own needs.” Bruntland Commission 1987 Toronto Region Green Building Festival
- 8. 3. Definitions Health, as defined by the World Health Organization “Health is a state of complete physical, mental and social well-being and not merely the absence of disease or infirmity.” Toronto Region Green Building Festival
- 9. 3. Definitions “If you want to improve health, you have to look beyond the health care system. Most of the important policy decisions that affect the health of the population are not made by the Ministry of Health.” Dr. Trevor Hancock, BC Public Health Consultant Toronto Region Green Building Festival
- 10. 4. Hype in Atlanta “Atlanta has been a quiet but significant leader in the green building movement.” Atlanta, November 2005, United States Green Building Council Annual Conference Toronto Region Green Building Festival
- 11. 4. Hype in Atlanta The unmentioned reality… Atlanta has the lowest population density of any American metropolitan area. Toronto Region Green Building Festival
- 12. 4. Hype in Atlanta The unmentioned reality… Between 1982 an 1997 Atlanta’s population increased by 1,300,000 people. Its area increased by 650,000 acres. Toronto Region Green Building Festival
- 13. 4. Hype in Atlanta The unmentioned reality… Atlanta residents commute an average of 58 km a day. Toronto Region Green Building Festival
- 14. 4. Hype in Atlanta The unmentioned reality… Atlanta’s obesity rate more than doubled between 1993 and 2000 and it is now the highest of any American city. Toronto Region Green Building Festival
- 15. 4. Hype in Atlanta Obesity Trends* Among US Adults 1990 (*BMI ≥30, or ~ 30 lbs overweight for 5’ 4” person) Source: Centers for Disease Control and Prevention. No Data <10% 10%–14% Behavioral Risk Factor Surveillance System Survey Data. Atlanta, Georgia: U.S. Department of Health and Human Services, Centers for Disease Control and Prevention, 1990-2001 Toronto Region Green Building Festival
- 16. 4. Hype in Atlanta Obesity Trends* Among US Adults 1991 (*BMI ≥30, or ~ 30 lbs overweight for 5’ 4” person) Source: Centers for Disease Control and Prevention. No Data <10% 10%–14% 15%–19% Behavioral Risk Factor Surveillance System Survey Data. Atlanta, Georgia: U.S. Department of Health and Human Services, Centers for Disease Control and Prevention, 1990-2001 Toronto Region Green Building Festival
- 17. 4. Hype in Atlanta Obesity Trends* Among US Adults 1993 (*BMI ≥30, or ~ 30 lbs overweight for 5’ 4” person) Source: Centers for Disease Control and Prevention. No Data <10% 10%–14% 15%–19% Behavioral Risk Factor Surveillance System Survey Data. Atlanta, Georgia: U.S. Department of Health and Human Services, Centers for Disease Control and Prevention, 1990-2001 Toronto Region Green Building Festival
- 18. 4. Hype in Atlanta Obesity Trends* Among US Adults 1995 (*BMI ≥30, or ~ 30 lbs overweight for 5’ 4” person) Source: Center for Disease Control and Prevention. No Data <10% 10%–14% 15%–19% Behavioral Risk Factor Surveillance System Survey Data. Atlanta, Georgia: U.S. Department of Health and Human Services, Centers for Disease Control and Prevention, 1990-2001 Toronto Region Green Building Festival
- 19. 4. Hype in Atlanta Obesity Trends* Among US Adults 1997 (*BMI ≥30, or ~ 30 lbs overweight for 5’ 4” person) Source: Center for Disease Control and Prevention. No Data <10% 10%–14% 15%–19% ≥20% Behavioral Risk Factor Surveillance System Survey Data. Atlanta, Georgia: U.S. Department of Health and Human Services, Centers for Disease Control and Prevention, 1990-2001 Toronto Region Green Building Festival
- 20. 4. Hype in Atlanta Obesity Trends* Among US Adults 1999 (*BMI ≥30, or ~ 30 lbs overweight for 5’ 4” person) Source: Center for Disease Control and Prevention. No Data <10% 10%–14% 15%–19% ≥20% Behavioral Risk Factor Surveillance System Survey Data. Atlanta, Georgia: U.S. Department of Health and Human Services, Centers for Disease Control and Prevention, 1990-2001 Toronto Region Green Building Festival
- 21. 4. Hype in Atlanta Obesity Trends* Among US Adults 2001 (*BMI ≥30, or ~ 30 lbs overweight for 5’ 4” person) Source: Center for Disease Control and Prevention. No Data <10% 10%–14% 15%–19% 20%–24% ≥25% Behavioral Risk Factor Surveillance System Survey Data. Atlanta, Georgia: U.S. Department of Health and Human Services, Centers for Disease Control and Prevention, 1990-2001 Toronto Region Green Building Festival
- 22. 4. Hype in Atlanta The unmentioned reality… Traffic fatality rates in Atlanta are 5 times what they are in New York City. Toronto Region Green Building Festival
- 23. 4. Hype in Atlanta Toronto Region Green Building Festival
- 24. 5. Green in New York Manhattan’s density is more than 800 times US national average Toronto Region Green Building Festival
- 25. 5. Green in New York 82% of Manhattan residents travel to work by public transit, bicycle or on foot Toronto Region Green Building Festival
- 26. 5. Green in New York If Manhattan were a state it would be the 12th most populous state and the most energy efficient one. Toronto Region Green Building Festival
- 27. 5. Green in New York A New Yorker generates 7.1 metric tons of greenhouse gases a year, 2/3 less than the 24.5 metric ton average for a typical US resident. Toronto Region Green Building Festival
- 28. 5. Green in New York Toronto Region Green Building Festival
- 29. 5. Green in New York The Rocky Mountain Institute has 4,000 sq. ft. of office space for six people in a thinly populated area only accessible by car. A second office with 12 people is located one mile away. Toronto Region Green Building Festival
- 30. 6. Heat in Chicago 1995 Heat wave July 14 – July 20 There are 739 more deaths than typical for a hot summer week Toronto Region Green Building Festival
- 31. 6. Heat in Chicago A team of eighty researchers was brought in from the US Centre of Disease Control and Prevention (CDC) to see what they could learn about preventing a reoccurrence. Toronto Region Green Building Festival
- 32. 6. Heat in Chicago The death rate in North Lawndale was 10 times that of South Lawndale Toronto Region Green Building Festival
- 33. 6. Heat in Chicago Toronto Region Green Building Festival North Lawndale
- 34. 6. Heat in Chicago Toronto Region Green Building Festival South Lawndale
- 35. 7. Opportunity in Toronto Toronto Region Green Building Festival
- 36. 7. Opportunity in Toronto Toronto Region Green Building Festival
- 37. 7. Opportunity in Toronto Toronto Region Green Building Festival
- 38. 7. Opportunity in Toronto Toronto Region Green Building Festival
- 39. 7. Opportunity in Toronto Toronto Region Green Building Festival
- 40. 7. Opportunity in Toronto Toronto Region Green Building Festival
- 41. 7. Opportunity in Toronto Toronto Region Green Building Festival
- 42. 7. Opportunity in Toronto Daily Walking / Biking Trips per Person Source: 2001 Transportation Tomorrow Survey (UofT) Neighbourhood Environments and Resources for Healthy Toronto Region Green Building Festival Living: A Focus on Diabetes. A Joint Initiative of St. Michael’s Hospital and the Institute for Clinical Evaluative Sciences
- 43. 7. Opportunity in Toronto Average Number of Cars per Household Source: 2001 Transportation Tomorrow Survey (UofT) Neighbourhood Environments and Resources for Healthy Toronto Region Green Building Festival Living: A Focus on Diabetes. A Joint Initiative of St. Michael’s Hospital and the Institute for Clinical Evaluative Sciences
- 44. 7. Opportunity in Toronto Age-Sex-Adjusted Diabetes Rates Source: Ontario Diabetes Database Neighbourhood Environments and Resources for Healthy Toronto Region Green Building Festival Living: A Focus on Diabetes. A Joint Initiative of St. Michael’s Hospital and the Institute for Clinical Evaluative Sciences
- 45. 7. Opportunity in Toronto Toronto Region Green Building Festival
- 46. 7. Opportunity in Toronto Toronto Region Green Building Festival
- 47. 7. Opportunity in Toronto Toronto Region Green Building Festival
- 48. 7. Opportunity in Toronto Toronto Region Green Building Festival
- 49. 7. Opportunity in Toronto Toronto Region Green Building Festival
- 50. 7. Opportunity in Toronto Toronto Region Green Building Festival
- 51. 7. Opportunity in Toronto Toronto Region Green Building Festival
- 52. 7. Opportunity in Toronto Toronto Region Green Building Festival
- 53. 7. Opportunity in Toronto Toronto Region Green Building Festival
- 54. 7. Opportunity in Toronto Toronto Region Green Building Festival
- 55. 7. Opportunity in Toronto Toronto Region Green Building Festival
- 56. 7. Opportunity in Toronto Toronto Region Green Building Festival
- 57. 7. Opportunity in Toronto Source: The Regent Park Collaborative Team Toronto Region Green Building Festival
- 58. 7. Opportunity in Toronto Toronto Region Green Building Festival
- 59. 7. Opportunity in Toronto Toronto Region Green Building Festival
- 60. 7. Opportunity in Toronto Toronto Region Green Building Festival
- 61. 7. Opportunity in Toronto Toronto Region Green Building Festival
- 62. 7. Opportunity in Toronto Source: Cities for a Small Planet. Toronto Region Green Building Festival Richard Rogers and Philip Gumuchdjiam