Correlation with R in R-Studio
•
3 recomendaciones•3,250 vistas

Correlation with R - Not for beginners One should have the basic concept in statistics to understand this and the different terms associated with this work sheet. #Correlation #R #Data & Analytics

Recomendados
Más contenido relacionado
Destacado
Destacado (15)
Último
Último (20)
Correlation with R in R-Studio
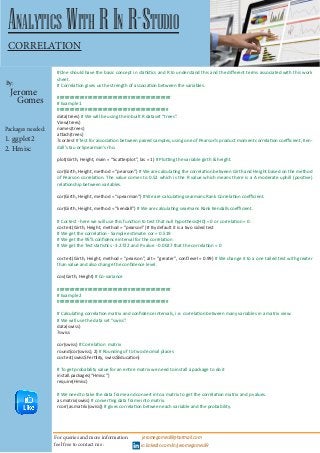
- 1. Analytics With RIn R-Studio CORRELATION #One should have the basic concept in statistics and R to understand this and the different terms associated with this work sheet. # Correlation gives us the strength of association between the variables. ############################################# # Example 1 ############################################ data(trees) # We will be using the inbuilt R dataset “trees”. View(trees) names(trees) attach(trees) ?cor.test # Test for association between paired samples, using one of Pearson’s product moment correlation coefficient, Ken- dall’s tau or Spearman’s rho. plot(Girth, Height, main = “Scatterplot”, las = 1) # Plotting the variable girth & height. cor(Girth, Height, method = “pearson”) # We are calculating the correlation between Girth and Height based on the method of Pearson correlation. The value comes to 0.52 which is the R value which means there is a A moderate uphill (positive) relationship between variables. cor(Girth, Height, method = “spearman”) # We are calculating searmans Rank Correlation coefficient. cor(Girth, Height, method = “kendall”) # We are calculating searmans Rank Kendalls coefficient. # Cor.test - here we will use this function to test that null hypothesis(H0) = 0 or correlation = 0. cor.test(Girth, Height, method = “pearson”) # By default it is a two sided test # We get the correlation - Sample estimate: cor = 0.519 # We get the 95% confidence interval for the correlation # We get the Test statistics - 3.2722 and P value - 0.0027 that the correlation = 0 cor.test(Girth, Height, method = “pearson”, alt = “greater”, conf.level = 0.99) # We change it to a one tailed test with greater than value and also change the confidence level. cov(Girth, Height) # Co-variance ############################################# # Example 2 ############################################ # Calculating correlation matrix and confidence intervals, i.e. correlation between many variables in a matrix view. # We will use the data set “swiss”. data(swiss) ?swiss cor(swiss) # Correlation matrix round(cor(swiss), 2) # Rounding of to two decimal places cor.test(swiss$Fertility, swiss$Education) # To get probability value for an entire matrix we need to install a package to do it install.packages(“Hmisc”) require(Hmisc) # We need to take the data frame and convert into a matrix to get the correlation matrix and p values. as.matrix(swiss) # converting data frame into matrix. rcorr(as.matrix(swiss)) # gives correlation between each variable and the probability. For queries and more information feel free to contact me : jeromegomes89@hotmail.com in.linkedin.com/in/jeromegomes89 By: Jerome Gomes Packages needed: 1. ggplot2 2. Hmisc