Rise using ethnography_jon_freach_final
•Descargar como PPTX, PDF•
4 recomendaciones•474 vistas

This is a presentation that I gave that 2011 RISE University day at the University of Texas - a one day event held on the UT campus for undergraduate and graduate entrepreneurs and entrepreneurs-to-be.

Recomendados
Recomendados
Más contenido relacionado
La actualidad más candente
La actualidad más candente (20)
Similar a Rise using ethnography_jon_freach_final
Similar a Rise using ethnography_jon_freach_final (20)
Último
Último (20)
Rise using ethnography_jon_freach_final
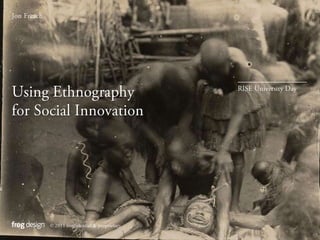
- 1. Jon Freach Using Ethnography for Social Innovation RISE University Day © 2011 confidential & proprietary
- 3. Language Sex Yams Currency Food Cricket Marriage Spells Mourning
- 6. “ If I had asked my customers what they wanted, they would have said a faster horse.” Henry Ford
- 8. Don’t just ask. Learn to see.
- 9. Ethnography is a tool for better designbecause it provides context for designers.
- 10. It helps us learn about and connect with the people we are designing for.
- 11. By collecting data about what they do, what they think, what they expect, and how they relate.
- 12. And it provides us a glimpse of what people need (and what they don’t know they need).
- 13. It can tell us something about how people interpret things in their life – how they construct meaning through the stories they tell themselves and others.
- 14. “ Most things are experienced indirectly. When we encounter anything, whether strange or familiar, we experience it though a set of expectations which we use to construct the meaning for ourselves.” Rick Robinson, Consumer Anthropologist
- 15. Other people (in all of their complexity) Other people (in all of their complexity) Other people (in all of their complexity) Other people (in all of their complexity) Natural events and forces Other people (in all of their complexity) Other people (in all of their complexity) Other people (in all of their complexity) You, in all of your complexity an experience Designed artifacts Your morals Your religious views Your political views Your hairstyle The way people have treated you The things you read and watch Your capacity for love The car you drive The things you’ve done Your ability for empathy Your dreams The places you’ve visited The way you feel today The place you live Your manual dexterity Your prejudices Slide courtesy Jon Kolko, AC4D Designed artifacts Designed artifacts Designed artifacts Designed artifacts Designed artifacts
- 16. Today’s Topics: History Examples Doing Fieldwork Sensemaking Design
- 17. 1 An Incomplete History of Ethnography
- 19. Margaret Mead and Gregory Bateson
- 20. Jane Goodall
- 22. Xerox PARC
- 23. IIT Institute of Design
- 24. e-Lab
- 25. Doblin Group
- 26. IDEO
- 27. frog
- 28. 2Examples of Applied Ethnography to Social Problems
- 30. Project M
- 34. Austin Center for Design
- 35. 3 Doing Fieldwork
- 36. What should we study?
- 37. Overview Key Questions Desired Outcomes Methodology Participant Profiles Compensation Schedule Research Plan
- 38. Who should we study?
- 39. Recruiting criteria Who NOT to recruit Phone script Screening questions Screener
- 40. Where should we study them?
- 41. Access
- 43. Digital camera
- 46. Spiral notebook
- 47. LiveScribe
- 48. Word or Excel
- 50. Unpacked
- 52. Activities Environments Interactions Objects Users AEIOU framework
- 54. Shadowing
- 55. Interviews
- 59. 4 Sensemaking
- 60. “ Sensemaking involves turning circumstances into a situation that is comprehended explicitly in wordsand that serves as a springboard into action.” Karl Weick, Organizing and The Process of Sensemaking
- 65. Expectations
- 66. Frustrations
- 67. Distractions
- 68. Enablers Insights are drawn from the observations in each bucket. An insight is a summary of similar data points in a concise statement. Needs are abducted from the collective student insights. Needs provide the primary conditions for design concepts. Opportunities are formed by combining user insights with market evidence or another data source. They are a tangible way to fulfill needs and impact the user experience. Turning research into design
- 71. Judging the data
- 72. Abduction
- 73. Observations
- 74. Insights
- 75. Themes
- 76. “ To work with the idea of sensemakingis to appreciate that smallness does not equate with insignificance. Small structures can have large consequences.” Karl Weick, Organizing and The Process of Sensemaking
- 77. “ In our social-impact work we are not looking for a silver bullet, to invent something new that never existed before and will instantly transform people’s lives. Rather, we are looking to help magnify the scale and impact of many different, small ideas to improve the “design” of these initiatives so that they work better and work better together. In the process, we turn local participants, such as community organizers, into design researchers of a sort, able to see new opportunities differently and adapt their skills to drive a collaborative process.” Robert Fabricant, Vice-President of Creative, frog design
- 78. Readings
- 79. 5 Design
- 81. ARCH research
- 82. Hour School
- 83. Hour School
- 84. Hour School
- 85. Nudge Us
- 87. OneUp
- 88. Pocket Hotline
- 90. Austin Center for Design www.austincenterfordesign.com jfreach@austincenterfordesign.com frog design www.frogdesign.com jon.freach@frogdesign.com
- 91. COMMUNITY SUPPORT Did you enjoy this session? Please support your local entrepreneurs and help us to keep this conference free. Your contributions help us continue delivering the value of a high-dollar conference along with that unbeatable price tag. Pledge to donate by sending keyword ‘RISE’ and your desired amount to 91011. The mission of RISE is to inspire and empower entrepreneurs of all stages.
Notas del editor
- I’m a designer and also a teacher so I prefer to treat this like a class and field questions throughout – so fire away when you have one.Let’s go around the room and introduce ourselves and make sure you tell why you’re attending RISE University Day and this session.I’ll go first. I’m Jon….This cover slide deserves some explanationSo this is one of the first examples of photographic data from field ethnography by an anthropologist in about 1920…It’s a funeral, or what the natives referred to as “mourning”
- These people were from the Trobriand Islands off the coast of Papaua New Guinea
- And you can read all about it in this book by Malinovvvvsky called Argonauts of the Western Pacific, an original ethnographyAnd in it he documents his research findings…Go quickly through a few of the list itemsWe’ll learn more about Malinovvvsky and why this is such an important book a bit later
- And this is a picture of where a wealthy consultant conceals his family’s health and financial data in their upstairs playroom. Under an out of tune guitar and behind a bunch of clutter…
- And the point is that THIS MEANS SOMETHING.It tells you something about people’s behavior and what they’re doing to overcompensate for a lack of something elseIt gives you ideas about what they NEED.in this case, convenient and reliable privacy and security for their personal data
- This is an often used quoteAnd the reason I use it here to make the point that you can’t just ask.
- You have to learn to see
- and ethnography is the tool by which you can perceive a people and their waysAnd what we learn from Ethnography can provide a useful and stimulating context for design and designers.
- Because it helps us to empathize with our user base
- Through learning about their customs
- And giving us a peek under the tent of what they need – think back to that lady’s van and the corner of that guy’s family room
- But the most important data ethnography yields is an understanding of how people construct meaning about what they do, what they use, and who they do all this with.
- And this quote by a mentor of mine says it best
- I think what he means is this…When we have an experience, any experience, we interpret that through a biased lens of learned behaviors, customs, and other past experiences.And knowing that is fertile ground for design and innovation of any kind.
- This is what we’ll cover:I’ll walk through an incomplete history of ethnography and explain how it evolved into the design tool that it is todayI’ll show you some examples of designed things that benefited from researchThen we’ll switch gears and discuss some tactics for doing research and making sense out of what you findAnd finally see some current example of social innovations that are being made out of ethnographic research
- Malinovvvsky was the first social scientist to “get off the desk” and go immerse himself in the society and culture that he was studying. Prior to his act, much of social science was theoretical, using secondary data, not empirical data.
- That inspired many others like Margaret Mead and her husband Gregory Bateson whose studies of Southeast Asian cultures influenced the sexual revolution in the 60s
- And I’m sure most of you are familiar with Jane Goodall’s work studying the social structures of chimpanzees
- Claude Levi Strauss didn’t really study chimps, except for this one, but he did invent structural anthropology – the notion that all people think about the world in terms of opposites – high/low., life/death, etc. and use signs to make sense of things
- Fast forwarding to the 70s and 80s American corporate culture we started to see anthropology and its methods being practiced in technology design such as at Xerox PARC…and Apple
- And in the 90s the Institute of Design gained traction with its human-centered design curriculum which was based on using ethnography as a means to gather data about situations and people’s needs.
- Around the mid-90s I started to frequent the Institute of Design and began working with some firms that were some of the first to actually practice applied ethnography for consumer product design and a form of design consulting
- Jay Doblin and Larry Keeley are credited with forming and evolving the research-driven strategic consulting of Doblin Group – another user centered design firm that I worked with and learned how to use ethnography in design practice while I was working at Texas Instruments
- Ideo is one of the foremost practitioners of using ethnography in their design process. You may remember their shopping cart redesign for ABC’s Nightline in the late 90s. This is a great book by their human factors lead– Jane Fulton Suri – which documents all the “thoughtless acts” that we execute in innocent ways on a daily basis and offers ideas about how to use it for design ideas. Great book, you should get it.
- Which brings me to frog, IDEOs main competitor and some of the research methods we use for designing things. Contextual inquiries for medical devices, participatory design for women’s beauty products, and a new DIY ethnographic tool called frogMob which crowdsources visual ethnography
- The Access Wayfinding System is a project that I led in which we used ethnographic research to figure our the best navigational logic and tools for cancer patients and their families
- Project M leveraged a small ethnographic insight – the widespread use of texting in South Africa – to deliver a single text message about calling to get a self-testing kit for HIV. The daily call volume to the National AIDS hotline has since tripled.
- In the 80s, the guy that taught me how to do and use ethnography applied it to redesign the basic photocopier for Xerox
- EmilyPillotson and her design firm at Project H redesigned the basic mechanism that women use in Africa by following them along on their daily treks to get water. This simple innovation is suited to the variety of terrains that the women walk across on these trips.
- Mothers 2 Mothers is a counseling service in Africa that employs HIV positive “Women Mentors” to counsel HIV positive mothers. Mitch Besser was working as a doctor at a clinic in South Africa and finding it hard to explain to affected mothers how they should begin treating their disease. So, he had some of his patients – also HIV infected mothers – do it for him. These women had the empathy, nuance, and communication skills to get through to women whom they shared a condition with and help them navigate the road to better health.
- Our students at the Austin Center for Design conducted ethnographic research with local homeless people that utilize the downtown resource center. Later in this deck, I’ll show you some of the concepts they developed this semester using their findings.
- Break at this point and ask for questions.By “fieldwork” I mean that act of going out into the world and studying it. “In the field” is a metaphor the social sciences use.
- But, before you go out there, start with identifying what you should be studying
- Which is generally determined through collaboration with your client and written up in a research PLAN.
- You also need to work with your client to determine WHO to study. This isn’t your sole responsibility, but you need to bring a strong POV and some secondary market data to support your recommendations.
- A SCREENER is a mechanism that you or a recruiting firm will use to find and filter potential participants.
- And the other critical factor to determine is WHERE you will conduct the research – also a collaborative decision. A lot of factors weigh in to choosing place – access, authenticity, demographics, navigability, safety, survival…Your job as the researcher is to fight for the most authentic and relevant place to do the research in and keep and open mind when doing it.
- The logistics of the research should tell you what tools you need to use. I think the fewer, the better and prefer a laptop, a camera, and an audio recorder if necessary. The general rule of thumb is that the more tools you bring into the field, the more data types you have to review, transcribe, interpret, manage, archive. That takes time and energy and money and you never have it when you return from research.Be conservative.
- Any one of these will work
- This is okay, but battery life and storage capacity are issues in between sessions.Clients love video, but never want to pay for the time to produce it.
- This one works great. Audio is really useful as a reference or for full transcription if its necessary but you have to be FAST. Otherwise it takes too much time.
- Another reliable tool. Cheap, fast, and portable. Great for shadowing.
- This is a new digital version of the spiral notebook that combines audio recording. I think it has a lot of promise. Some colleagues use it, but I haven’t yet.
- My preferred method for a number of reasons:I can type faster than I can writeThe data is native digitalWhich means its sortable and can be formatted and re-used and archived
- Get a light, portable, bag that doesn’t take a lot of room on a plane, in a taxi, on a bike, or in a home
- This is what it looks like unpacked – one of my students did this useful diagram…a good explanatory graphic for clients.
- There are about 5 basic methods to consider, each one particular to the kind of data you need to capture
- The first method is more of a conceptual one – a framework to keep in mind so you capture the right kind of dataIts easy to remember and guarantees a lot of coverage and its general enough to apply to just about any project.Explain each one…
- Immersive research means that you are immersed in the location and the lives of the people you’re studying. It enables you to take in the culture of the place as a PARTICIPANT-OBSERVERI did a form of immersive research when I did research in Mumbai and driving across the city gave us an important perspective of city life there
- Shadowing literally means following your research participants around to see and document and learn about where they go and what they do in the places and spaces that they go to.
- Interviews are a common form of research – you’ll do more of these than anything elseAnd you’ll do them in all kinds of different places. But, don’t be fooled, it requires a lot of nuance to get people to talk about the things that you want them to without leading them onThe more you do the better you get
- Contextual inquiries are in-depth studies of a specific place of work or life. They require the participant to guide you and show you around a workspace or a tool or demonstrate an interaction.This image is from a contextual inquiry that we did for the redesign of an online university.This is a typical context for a distance learner – classroom in the middle of a chaotic living area, baby asleep or crying near them, lots of distractions which mean short attention spans and periods of study
- Participatory design is used to evaluate a design that you might have and/or make a new one together using a kit of parts.This image is also from that online university and the research participant is building her ideal user interface to show us.
- Participatory design can also be used for more conceptual exercises like this one where we had the particint show us what kind of personal data he would be willing to share with a health insurance company.
- So you’ve gone out into the field to collect all this data about people, places, and things.Now what? You have to make sense out of it.
- The concept of “sensemaking” was introduced by Karl Weick, an organizational theorist. And he was studying, literally, how people make sense of circumstances to act through them.We tend not to formally reflect on this during the course of an action, but when we have a lot data to make sense out of we must.This part of the process is also called “synthesis” because you’re synthesizing a bunch of different kinds of data.
- In order to make sense out of your data, you need a space to work in. Vertical surfaces are required.At frog, this is what a project room looks like during the research phase.These are called gator foam boards, 4 x 8, they’re very firm.
- And you can put a lot of post-it notes on them.This is a scene after about a week of work – note how organized everything is – that’s purposeful and you’ll see why in a few slides.
- This is a structured process for sensemaking that’s easy to learn and fun to do. Alone or with a group.Here’s how it works:…
- So here’s an example of the process:Externalizing the data is the first step in the process. GET THE DATA OUT OF YOUR NOTEBOOK OR LAPTOP.This is a picture of a whiteboard in another project room at frog. The circle in the middle and all the red and green writing around it is a business cycle that an energy plant engineering company takes to sell, build, and implement their products and services. We built it with the help of our client.The white strips of paper are parts of notes that we took during interviews with staff and customers. They’re the most important notes that relate to different parts of the business process.
- Over the course of a few days, we added more notes and organized them around the process and started to group notes that were alike.
- And these groupings enabled us to see patterns and relationships in the data through a literal process of “judgment” – forcing comparisons.
- And fast forwarding a bit, here is concept model that we generated based on our research and sensemakingThe green cards at the top are design principles, the yellow diamonds are the business process, and the yellow cards below it are a bunch of ideas about products and services in each step of the process.
- So let’s look closer at an example of how we created a design principle – this one is called “Build a sustainable and efficient future”The red rectangle highlites an observation we made during an interview about a change in the sales force and the loss of knowledge
- The yellow post-its are insights generated from comparing the observations – this insight speaks to the fact that the company doesn’t have a ecological component to the product platform, which is something that a younger generation of workers will be expecting.
- And the green card is a developed design theme that is written in a prescriptive manner providing actionable recommendations.
- And one last thought from Weick is the notion that a small finding yield big changes. Think back to the examples I showed earlier in the deck – text messaging to raise AIDS care awareness, the Hippo water roller – these designs are based on really small research findings but they’ve made a world of difference.
- Our VP of creative at frog echoes this idea in his quote here.At frog, we sell ourselves as an innovation firm and that word has a lot of BIG expectations around it.In fact, innovation usually occurs in small ways as well – and so as Robert says we’re not looking for a silver bullet, just small improvements that impact a broader system.
- This is my class at Austin Center for Design and I’m going to show you some examples of how their research last semester has informed their social design work this semester
- To begin, remember that they conducted research with the Austin Resource Center for the Homeless staff and many different homeless peopleTheir task this semester was to design a product or service and business that addresses some of the needs and themes surfaced during research using communications technology.
- Hour School is a way for homeless people to teach classes to others (homeless and not homeless) using skills and knowledge they already have. The students are creating a website that enables teachers and students to come together across the community.
- The next two slides are prototypes of the service
- Nudge Us is a text messaging service that encourages individuals to reach out to each other. It creates a database of moods and feelings through text pings, identifies patterns, then contacts friends or family members to nudge them towards help.
- eBay for Benefits provides a legal platform for economically-challenged moms to trade each other for baby needs – the fair trade of goods.
- OneUp provides youth with financial planning services
- The Pocket Hotline is a mobile app that routes calls from the front desk of social programs to the cell phones of remote volunteers.