SlideShare una empresa de Scribd logo
1 de 7
Descargar para leer sin conexión
Square of Nine
The Square of Nine can be considered as an exotic section in relation to Gann analysis.
Square of Nine Structure
Starting from the center(1) and following the numbers as they unwind, an infimite spiral becomes
apparent. Looking at lower right corner of the grid, you see the squares of odd
numbers...3,5,7,9,11..giving.. 9,25,49,81,121, with each square being a distinct Square within
the structure.
This tool is an effective marker of price support and resistance.
Here's how this structure becomes a calculator...
Find the number 15 on the Square of Nine . If a stock was trading at a price of $15, what are the
price objectives using a Gann Wheel? The number 15 is perfectly aligned under the zero and
360 degree angle marked on the top of the Wheel. Because the number 15 is aligned with zero
we need make no further adjustments, just read the Gann targets straight off the wheel. The 45
degree price objective from 15 is 17. It is the next number that aligns with the 45 degree line that
travels towards the top right corner. The number 19 crosses were the 90 degree line was drawn.
We would use the phrase, "$19 is 90 degrees up from $15." Now skip over to 180 degrees and
find $23 is directly opposite $15. We would still say, "23 is 180 degrees up from 15". At 270
degrees $28 is the price objective. A full 360 degrees up from 15 is $34. That is how a Gann
Wheel is used.
Why did we skip the bottom right corner angle which would be 135 degrees? Because like
Fibonacci, some calculations are more important than others. The Fibonacci ratios 0.382, 0.500.
0.618, 1.000, and 1.618 are relationships we know are the critical ratios to identify. This is also
how the various Gann angles are interpreted. We have a circle that is divided into quarters and
sixths, but we also need to divide 360 degrees into thirds because 120 degrees and 240 are
extremely important. The angles of greatest interest in financial markets are 45, 90, 120, 180,
240, 270, 315, and 360.
Sampels Usage of Square of 9
(1) Find potential turning point dates: count the # of calendar days between significant
A. high and low.
B. high to high
C. low to lwo .
Find that number on the Sq. of 9. Now note the numbers which are on the same angle as your
starting number, and watch for possible swings at those dates.
Example: A move for low A to low B takes up 39 calendars days. You locate the number 39 on
the square, and note the nubmers which are on the same angle. These would be:
67,105,150,201,262...
Now go back to your original low; you would look for another swing point at 67 calendar days
from this low, then 105 calendar days, etc.
(2) Calculate potential turning point prices: take the price of a major high/low and locate that
value on the Square. Note the values which are 45, 90, 120, 180, 240, 270, and 360 degrees on
the Square. If you are using a major low, you would note the numbers on those angles which are
greater than your starting value. If using a major high, you would use the numbers which are
lower.
Examples: S&P 500 07/24/2002 make a low at 775. You expect prices are going to rally and
want to find potential points of resistance as price move higher. locate 775 on the Square of 9
chart, and note the following angles:
45 deg. = 909
90 deg. = 909
120 deg. = 815,933
180 deg. = 832,952
240 deg. = 853,974
270 deg. = 861
©2002 Global View Technology (http://www.globalviewtech.com/onlinehelp)
Gann Hexagon Chart
The Hexagon Chart Structure
Let's see how Gann explains the Chart.
"Since everything moves in a circle and nothing moves in straight lines , this chart is to show to
you how the angles influence stocks at very low levels and very high levels and why stocks
move faster the higher they get , because they have moved out to where the distance between
the angles of 45* are so far apart that there is nothing to stop them and their moves are naturally
rapid up and down ."
We begin with a circle of “1” , yet the circle is 360* just the same . We then place a circle of
circles around this circle and six circles complete the second circle , making a gain of 6 over the
first one , ending the second circle at 7, making 7 on this angle a very important month, year ,
and week as well as days , the seventh day being sacred and a day of rest . The third circle is
completed at 19 . The fourth circle around is completed at 37 – a gain of 18 over the previous
circle . The fifth circle is completed at 61 , a gain of 24 over the previous circle . The sixth circle
is completed at 91 , a gain of 30 over the previous circle , and the seventh circle at 127 , a gain
of 36 over the last circle . Note that from the first the gain is 6 each time we go around . In other
words, when ‘is’ have traveled six times around we have gained 36 . Note that this completes
the first Hexagon and as this equals 127 months , shows why some campaigns will run 10 years
and seven months , or until they reach a square of the Hexagon , or the important last angle of
45* .
The eighth circle around is completed at 169 , a gain of 42 over the first . This is a very important
angle and an important time factor for more reasons than one . It is 14 years and one month , or
double our cycle of 7 years . Important tops and bottoms culminate at this angle as you will see
by going over your charts .
The ninth circle is completed at 217 , a gain of 48 over the previous circle . The tenth circle is
completed at 271 , a gain of 54 . Note that 271 is the ninth circle from the first , or is the third 90*
angle or 270* , three fourths of a circle , a strong point .. All this is confirmed by the Master
Twelve Chart , by the four seasons and by the Square of Nine Chart , and also confirmed by the
Hexagon chart ., showing that mathematical proof is always exact no matter how many ways or
from what directions you figure it .
The eleventh circle is completed at 331 , a gain of 60 over the last circle . The twelfth circle is
completed at 397 , which completes the Hexagon ., making a gain in 11 circles of 66 from the
beginning .
66 months , or 5 years and six months , marks the culmination of major campaigns in stocks .
Note how often they culminate on the 60th month , then have a reaction , and make a second
top or bottom in the 66th month . Note the number 66 on the Master Twelve Chart . Note it on
the Square of Nine and note that 66 occurs on an angle of 180* on the Hexagon chart , all of
which confirms the strong angle at this point .
We have an angle of 66* , one of 67.5* and one at 68 , confirming this point to be doubly strong
for tops and bottoms or space movements up or down .
Note the number 360* on the Hexagon Chart . It completes a circle of 360* . From our beginning
point this occurs at an angle of 180 * on the Hexagon Chart going around , but measuring from
the center , it would equal an angle of 90* or 180* , making this a strong point , hard and difficult
to pass, and the ending of one campaign and the beginning of another .
Again with the center of the Hexagon Chart at “1” notice that 7, 19, 37, 61, 91, 127, 169, 217,
271, 331, and 397 are all on this direct angle and are important points in time measurement .
Beginning with “1” and following the other angle , note that 2,9,22,41,66,97,134,177,226,281,
and 342 are all on a same angle of 90*, or an angle of 60* and 240* as measured by the
Hexagon Chart .
Go over this Chart and the important angles each way and you will see why the resistance is
met either on days , weeks, months or years, and why stocks stop and make tops and bottoms
at these strong important points according to time .
When any stock has passed out above 120* or especially above 127* or 127 points and gone
out of the square of the first Hexagon , its fluctuations will be more rapid and it will move faster
up and down . Notice near the center that in traveling from 66 to 7 you strike the angle of 180* or
90* , but when the stock gets out to 162, it can travel up to 169 before striking another strong
angle . That is why fast moves occur up and down as stocks get higher and as they move from a
center of time .
Remember that everything seeks the center of gravity and important tops and bottoms are
formed according to centers and measurements of time from a center , base or beginning point ,
either top or bottom . The angles formed going straight up and across , ‘may a com’ just the
same going across as the stock travels over for days,weeks,months or years . Thus , a stock
going up to 22.5 would strike an angle of 22.5 * . If it moves over 22.5 days it would strike the
angle or 22.5 weeks or 22.5 months , it would also strike an angle of 22.5 * , and the higher it is
when those angles are struck and the angle it hits going up , the greater the resistance to be
met. Reverse that rule going down .
Market movements are made just the same as any other thing which is constructed . It is just the
same as constructing a building . First the foundation has to be laid down and then the four walls
have to be completed and last , but not least of all , the top has to be put on . The cube or
hexagon proves exactly the law which works because of time and space in the market . When a
building is put up it is built according to a square or hexagon. It has four walls or four sides , a
bottom and a top ; therefore , it is a cube .
In working out the 20- year Cycle in the stock market , the first 60* or 5 years , from the
beginning forms the bottom of the cube . The second 60* , running to 120* , completes the first
angle or the first side and runs out the 10 year Cycle . The third 60 * or the second side , ends
15 years or 180 *. It is very important because we have the building half completed and must
meet the strongest resistance at this point . The fourth 60 * , or at the end of 20 yrs or 240
months , completes the third side . We are now two thirds around the building , a very strong
point which culminates and completes our 20 – year Cycle . The fifth 60 * , or 300 * point ,days
,weeks , or months completes 25 years , a repetition of the first five years , but it completes the
fourth side of our building and is a very important angle . The sixth 60 * , or 360 * , completing
the circle and ending 30 years as measured by our Time Factor , which runs 1* per month on an
angle of 45 * , completes the top .This is a complete cube and we begin over again . "
"Study this in connection with the Hexagon Chart . It will help you . "
Jan 1931
WD Gann.
©2002 Global View Technology (http://www.globalviewtech.com/onlinehelp)

Más contenido relacionado

La actualidad más candente

Cmt learning objective 7 volume ,open interest & breadth Part-3
Cmt learning objective 7   volume ,open interest & breadth Part-3Cmt learning objective 7   volume ,open interest & breadth Part-3
Cmt learning objective 7 volume ,open interest & breadth Part-3Professional Training Academy
 
Japanese standart is a profitable strategy by OLYMP TRADE
Japanese standart is a profitable strategy by OLYMP TRADEJapanese standart is a profitable strategy by OLYMP TRADE
Japanese standart is a profitable strategy by OLYMP TRADEOlymp Trade
 
Magic Breakout Forex Trading Strategy PDF eBook
Magic Breakout Forex Trading Strategy PDF eBookMagic Breakout Forex Trading Strategy PDF eBook
Magic Breakout Forex Trading Strategy PDF eBookeforexcourse web
 
Technical Analysis
Technical AnalysisTechnical Analysis
Technical Analysisluv_sharma
 
eq new april 2011
eq new april 2011eq new april 2011
eq new april 2011Eaglefx
 
Oliver velez swing trading tactics
Oliver velez   swing trading tacticsOliver velez   swing trading tactics
Oliver velez swing trading tacticsAislan Pereira
 
Simple scalping secret strategy
Simple scalping secret strategySimple scalping secret strategy
Simple scalping secret strategyHeri Valiant
 
Trading divergences
Trading divergencesTrading divergences
Trading divergencesAnkit Gupta
 
Pull Back Swing Trading Strategy I The Only Way To Trade Stocks and E-Mini Re...
Pull Back Swing Trading Strategy I The Only Way To Trade Stocks and E-Mini Re...Pull Back Swing Trading Strategy I The Only Way To Trade Stocks and E-Mini Re...
Pull Back Swing Trading Strategy I The Only Way To Trade Stocks and E-Mini Re...Marketgeekschannel
 
LC's Forex Trading System
LC's Forex Trading SystemLC's Forex Trading System
LC's Forex Trading Systemlcchong76
 
Price Action Trading.pdf
Price Action Trading.pdfPrice Action Trading.pdf
Price Action Trading.pdfShreya292338
 
Candlestick cheat-sheet-rgb-final
Candlestick cheat-sheet-rgb-finalCandlestick cheat-sheet-rgb-final
Candlestick cheat-sheet-rgb-finalMichael Kleven
 
Support resistance trading strategies - a comparison
Support resistance trading strategies - a comparisonSupport resistance trading strategies - a comparison
Support resistance trading strategies - a comparisonHimanshu Patil
 
Trade Forex From Home - 10 Biggest Mistakes New Forex Traders Make (And How T...
Trade Forex From Home - 10 Biggest Mistakes New Forex Traders Make (And How T...Trade Forex From Home - 10 Biggest Mistakes New Forex Traders Make (And How T...
Trade Forex From Home - 10 Biggest Mistakes New Forex Traders Make (And How T...ForexTraining
 
Forex Trading - How to Create a Trading Strategy
Forex Trading - How to Create a Trading StrategyForex Trading - How to Create a Trading Strategy
Forex Trading - How to Create a Trading StrategyBlueMax Capital
 
W D GANN TECHNIQUE | Gann SQ 9 | GANN WAVE
W D GANN TECHNIQUE | Gann SQ 9 | GANN WAVEW D GANN TECHNIQUE | Gann SQ 9 | GANN WAVE
W D GANN TECHNIQUE | Gann SQ 9 | GANN WAVEartoftrading
 
Technical Analysis in Forex Trading
Technical Analysis in Forex TradingTechnical Analysis in Forex Trading
Technical Analysis in Forex TradingIFC Markets Corp.
 
High Probability Trading Setups
High Probability Trading SetupsHigh Probability Trading Setups
High Probability Trading Setupsbtrader
 
Section 2 - Chapter 9 Part II - Short Tem Pattern - Bar Chart Reversal Patterns
Section 2 - Chapter 9 Part II - Short Tem Pattern  - Bar Chart Reversal PatternsSection 2 - Chapter 9 Part II - Short Tem Pattern  - Bar Chart Reversal Patterns
Section 2 - Chapter 9 Part II - Short Tem Pattern - Bar Chart Reversal PatternsProfessional Training Academy
 
Section 2 - Chapter 8 - Bar Chart Pattern (Price Pattern)
Section 2 - Chapter 8 - Bar Chart Pattern (Price Pattern)Section 2 - Chapter 8 - Bar Chart Pattern (Price Pattern)
Section 2 - Chapter 8 - Bar Chart Pattern (Price Pattern)Professional Training Academy
 

La actualidad más candente (20)

Cmt learning objective 7 volume ,open interest & breadth Part-3
Cmt learning objective 7   volume ,open interest & breadth Part-3Cmt learning objective 7   volume ,open interest & breadth Part-3
Cmt learning objective 7 volume ,open interest & breadth Part-3
 
Japanese standart is a profitable strategy by OLYMP TRADE
Japanese standart is a profitable strategy by OLYMP TRADEJapanese standart is a profitable strategy by OLYMP TRADE
Japanese standart is a profitable strategy by OLYMP TRADE
 
Magic Breakout Forex Trading Strategy PDF eBook
Magic Breakout Forex Trading Strategy PDF eBookMagic Breakout Forex Trading Strategy PDF eBook
Magic Breakout Forex Trading Strategy PDF eBook
 
Technical Analysis
Technical AnalysisTechnical Analysis
Technical Analysis
 
eq new april 2011
eq new april 2011eq new april 2011
eq new april 2011
 
Oliver velez swing trading tactics
Oliver velez   swing trading tacticsOliver velez   swing trading tactics
Oliver velez swing trading tactics
 
Simple scalping secret strategy
Simple scalping secret strategySimple scalping secret strategy
Simple scalping secret strategy
 
Trading divergences
Trading divergencesTrading divergences
Trading divergences
 
Pull Back Swing Trading Strategy I The Only Way To Trade Stocks and E-Mini Re...
Pull Back Swing Trading Strategy I The Only Way To Trade Stocks and E-Mini Re...Pull Back Swing Trading Strategy I The Only Way To Trade Stocks and E-Mini Re...
Pull Back Swing Trading Strategy I The Only Way To Trade Stocks and E-Mini Re...
 
LC's Forex Trading System
LC's Forex Trading SystemLC's Forex Trading System
LC's Forex Trading System
 
Price Action Trading.pdf
Price Action Trading.pdfPrice Action Trading.pdf
Price Action Trading.pdf
 
Candlestick cheat-sheet-rgb-final
Candlestick cheat-sheet-rgb-finalCandlestick cheat-sheet-rgb-final
Candlestick cheat-sheet-rgb-final
 
Support resistance trading strategies - a comparison
Support resistance trading strategies - a comparisonSupport resistance trading strategies - a comparison
Support resistance trading strategies - a comparison
 
Trade Forex From Home - 10 Biggest Mistakes New Forex Traders Make (And How T...
Trade Forex From Home - 10 Biggest Mistakes New Forex Traders Make (And How T...Trade Forex From Home - 10 Biggest Mistakes New Forex Traders Make (And How T...
Trade Forex From Home - 10 Biggest Mistakes New Forex Traders Make (And How T...
 
Forex Trading - How to Create a Trading Strategy
Forex Trading - How to Create a Trading StrategyForex Trading - How to Create a Trading Strategy
Forex Trading - How to Create a Trading Strategy
 
W D GANN TECHNIQUE | Gann SQ 9 | GANN WAVE
W D GANN TECHNIQUE | Gann SQ 9 | GANN WAVEW D GANN TECHNIQUE | Gann SQ 9 | GANN WAVE
W D GANN TECHNIQUE | Gann SQ 9 | GANN WAVE
 
Technical Analysis in Forex Trading
Technical Analysis in Forex TradingTechnical Analysis in Forex Trading
Technical Analysis in Forex Trading
 
High Probability Trading Setups
High Probability Trading SetupsHigh Probability Trading Setups
High Probability Trading Setups
 
Section 2 - Chapter 9 Part II - Short Tem Pattern - Bar Chart Reversal Patterns
Section 2 - Chapter 9 Part II - Short Tem Pattern  - Bar Chart Reversal PatternsSection 2 - Chapter 9 Part II - Short Tem Pattern  - Bar Chart Reversal Patterns
Section 2 - Chapter 9 Part II - Short Tem Pattern - Bar Chart Reversal Patterns
 
Section 2 - Chapter 8 - Bar Chart Pattern (Price Pattern)
Section 2 - Chapter 8 - Bar Chart Pattern (Price Pattern)Section 2 - Chapter 8 - Bar Chart Pattern (Price Pattern)
Section 2 - Chapter 8 - Bar Chart Pattern (Price Pattern)
 

Destacado

Financial Astrology 101 - Astro Finance Timing Technique & History
Financial Astrology 101 - Astro Finance Timing Technique & HistoryFinancial Astrology 101 - Astro Finance Timing Technique & History
Financial Astrology 101 - Astro Finance Timing Technique & HistoryWD Gann Khit Wong
 
Könyvek - Gann - Master Commodities Course
Könyvek - Gann - Master Commodities CourseKönyvek - Gann - Master Commodities Course
Könyvek - Gann - Master Commodities CourseTozsde Okossag
 
Financial Astrology Forecasts, Predictions & Timing by Planets & Moon Cycles ...
Financial Astrology Forecasts, Predictions & Timing by Planets & Moon Cycles ...Financial Astrology Forecasts, Predictions & Timing by Planets & Moon Cycles ...
Financial Astrology Forecasts, Predictions & Timing by Planets & Moon Cycles ...WD Gann Khit Wong
 
Könyvek - Jenkins - The Geometry Of Stock Market Profits
Könyvek - Jenkins - The Geometry Of Stock Market ProfitsKönyvek - Jenkins - The Geometry Of Stock Market Profits
Könyvek - Jenkins - The Geometry Of Stock Market ProfitsTozsde Okossag
 
Analytical Modeling of Vibration Signals from a Planetary Gear in Normal and ...
Analytical Modeling of Vibration Signals from a Planetary Gear in Normal and ...Analytical Modeling of Vibration Signals from a Planetary Gear in Normal and ...
Analytical Modeling of Vibration Signals from a Planetary Gear in Normal and ...Jungho Park
 
Technical analysis OF STOCK MARKET presentation of mba 4 sem FINANCE PPT
Technical analysis OF STOCK MARKET  presentation of mba 4 sem FINANCE PPTTechnical analysis OF STOCK MARKET  presentation of mba 4 sem FINANCE PPT
Technical analysis OF STOCK MARKET presentation of mba 4 sem FINANCE PPTBabasab Patil
 

Destacado (8)

Part i
Part iPart i
Part i
 
Financial Astrology 101 - Astro Finance Timing Technique & History
Financial Astrology 101 - Astro Finance Timing Technique & HistoryFinancial Astrology 101 - Astro Finance Timing Technique & History
Financial Astrology 101 - Astro Finance Timing Technique & History
 
Könyvek - Gann - Master Commodities Course
Könyvek - Gann - Master Commodities CourseKönyvek - Gann - Master Commodities Course
Könyvek - Gann - Master Commodities Course
 
Financial Astrology Forecasts, Predictions & Timing by Planets & Moon Cycles ...
Financial Astrology Forecasts, Predictions & Timing by Planets & Moon Cycles ...Financial Astrology Forecasts, Predictions & Timing by Planets & Moon Cycles ...
Financial Astrology Forecasts, Predictions & Timing by Planets & Moon Cycles ...
 
Könyvek - Jenkins - The Geometry Of Stock Market Profits
Könyvek - Jenkins - The Geometry Of Stock Market ProfitsKönyvek - Jenkins - The Geometry Of Stock Market Profits
Könyvek - Jenkins - The Geometry Of Stock Market Profits
 
Analytical Modeling of Vibration Signals from a Planetary Gear in Normal and ...
Analytical Modeling of Vibration Signals from a Planetary Gear in Normal and ...Analytical Modeling of Vibration Signals from a Planetary Gear in Normal and ...
Analytical Modeling of Vibration Signals from a Planetary Gear in Normal and ...
 
Technical analysis OF STOCK MARKET presentation of mba 4 sem FINANCE PPT
Technical analysis OF STOCK MARKET  presentation of mba 4 sem FINANCE PPTTechnical analysis OF STOCK MARKET  presentation of mba 4 sem FINANCE PPT
Technical analysis OF STOCK MARKET presentation of mba 4 sem FINANCE PPT
 
Vibration
VibrationVibration
Vibration
 

Similar a (1931) usage of gann sq9 & hexagon chart

Similar a (1931) usage of gann sq9 & hexagon chart (20)

Y5 t2u5bd1 3
Y5 t2u5bd1 3Y5 t2u5bd1 3
Y5 t2u5bd1 3
 
STRAND 4.0 GEOMETRY.pptx GRADE 8 CBC LEARNERS
STRAND 4.0 GEOMETRY.pptx GRADE 8 CBC LEARNERSSTRAND 4.0 GEOMETRY.pptx GRADE 8 CBC LEARNERS
STRAND 4.0 GEOMETRY.pptx GRADE 8 CBC LEARNERS
 
Medidas Angulares
Medidas AngularesMedidas Angulares
Medidas Angulares
 
Ac1.4bPracticeProblems
Ac1.4bPracticeProblemsAc1.4bPracticeProblems
Ac1.4bPracticeProblems
 
Trigonometry functions of general angles reference angles
Trigonometry functions of general angles reference anglesTrigonometry functions of general angles reference angles
Trigonometry functions of general angles reference angles
 
Graph of Cosine functions.pptx
Graph of Cosine functions.pptxGraph of Cosine functions.pptx
Graph of Cosine functions.pptx
 
Kristi's Trig. for Dummies
Kristi's Trig. for DummiesKristi's Trig. for Dummies
Kristi's Trig. for Dummies
 
Basic geometric elements
Basic geometric elementsBasic geometric elements
Basic geometric elements
 
Angulos
AngulosAngulos
Angulos
 
Triangle
Triangle Triangle
Triangle
 
Polygons b.ing math. citra
Polygons b.ing math. citraPolygons b.ing math. citra
Polygons b.ing math. citra
 
Angles PPT.pptx
Angles PPT.pptxAngles PPT.pptx
Angles PPT.pptx
 
Trigonometry functions of general angles reference angles
Trigonometry functions of general angles reference anglesTrigonometry functions of general angles reference angles
Trigonometry functions of general angles reference angles
 
Podi
PodiPodi
Podi
 
Classifying Different Kinds of Angles.pptx
Classifying Different Kinds of Angles.pptxClassifying Different Kinds of Angles.pptx
Classifying Different Kinds of Angles.pptx
 
Trigonometric Function of General Angles Lecture
Trigonometric Function of General Angles LectureTrigonometric Function of General Angles Lecture
Trigonometric Function of General Angles Lecture
 
Types of angle Intro.ppt
Types of angle Intro.pptTypes of angle Intro.ppt
Types of angle Intro.ppt
 
Polygon assessment
Polygon assessmentPolygon assessment
Polygon assessment
 
angle ppt.pptx
angle ppt.pptxangle ppt.pptx
angle ppt.pptx
 
Ac1.4cMorePracticeProblems
Ac1.4cMorePracticeProblemsAc1.4cMorePracticeProblems
Ac1.4cMorePracticeProblems
 

Último

Graduate Outcomes Presentation Slides - English
Graduate Outcomes Presentation Slides - EnglishGraduate Outcomes Presentation Slides - English
Graduate Outcomes Presentation Slides - Englishneillewis46
 
General Principles of Intellectual Property: Concepts of Intellectual Proper...
General Principles of Intellectual Property: Concepts of Intellectual  Proper...General Principles of Intellectual Property: Concepts of Intellectual  Proper...
General Principles of Intellectual Property: Concepts of Intellectual Proper...Poonam Aher Patil
 
Unit 3 Emotional Intelligence and Spiritual Intelligence.pdf
Unit 3 Emotional Intelligence and Spiritual Intelligence.pdfUnit 3 Emotional Intelligence and Spiritual Intelligence.pdf
Unit 3 Emotional Intelligence and Spiritual Intelligence.pdfDr Vijay Vishwakarma
 
Towards a code of practice for AI in AT.pptx
Towards a code of practice for AI in AT.pptxTowards a code of practice for AI in AT.pptx
Towards a code of practice for AI in AT.pptxJisc
 
Basic Civil Engineering first year Notes- Chapter 4 Building.pptx
Basic Civil Engineering first year Notes- Chapter 4 Building.pptxBasic Civil Engineering first year Notes- Chapter 4 Building.pptx
Basic Civil Engineering first year Notes- Chapter 4 Building.pptxDenish Jangid
 
Interdisciplinary_Insights_Data_Collection_Methods.pptx
Interdisciplinary_Insights_Data_Collection_Methods.pptxInterdisciplinary_Insights_Data_Collection_Methods.pptx
Interdisciplinary_Insights_Data_Collection_Methods.pptxPooja Bhuva
 
Food safety_Challenges food safety laboratories_.pdf
Food safety_Challenges food safety laboratories_.pdfFood safety_Challenges food safety laboratories_.pdf
Food safety_Challenges food safety laboratories_.pdfSherif Taha
 
How to Manage Global Discount in Odoo 17 POS
How to Manage Global Discount in Odoo 17 POSHow to Manage Global Discount in Odoo 17 POS
How to Manage Global Discount in Odoo 17 POSCeline George
 
ICT Role in 21st Century Education & its Challenges.pptx
ICT Role in 21st Century Education & its Challenges.pptxICT Role in 21st Century Education & its Challenges.pptx
ICT Role in 21st Century Education & its Challenges.pptxAreebaZafar22
 
Making communications land - Are they received and understood as intended? we...
Making communications land - Are they received and understood as intended? we...Making communications land - Are they received and understood as intended? we...
Making communications land - Are they received and understood as intended? we...Association for Project Management
 
Sociology 101 Demonstration of Learning Exhibit
Sociology 101 Demonstration of Learning ExhibitSociology 101 Demonstration of Learning Exhibit
Sociology 101 Demonstration of Learning Exhibitjbellavia9
 
Jamworks pilot and AI at Jisc (20/03/2024)
Jamworks pilot and AI at Jisc (20/03/2024)Jamworks pilot and AI at Jisc (20/03/2024)
Jamworks pilot and AI at Jisc (20/03/2024)Jisc
 
Application orientated numerical on hev.ppt
Application orientated numerical on hev.pptApplication orientated numerical on hev.ppt
Application orientated numerical on hev.pptRamjanShidvankar
 
Introduction to Nonprofit Accounting: The Basics
Introduction to Nonprofit Accounting: The BasicsIntroduction to Nonprofit Accounting: The Basics
Introduction to Nonprofit Accounting: The BasicsTechSoup
 
Unit-V; Pricing (Pharma Marketing Management).pptx
Unit-V; Pricing (Pharma Marketing Management).pptxUnit-V; Pricing (Pharma Marketing Management).pptx
Unit-V; Pricing (Pharma Marketing Management).pptxVishalSingh1417
 
Sensory_Experience_and_Emotional_Resonance_in_Gabriel_Okaras_The_Piano_and_Th...
Sensory_Experience_and_Emotional_Resonance_in_Gabriel_Okaras_The_Piano_and_Th...Sensory_Experience_and_Emotional_Resonance_in_Gabriel_Okaras_The_Piano_and_Th...
Sensory_Experience_and_Emotional_Resonance_in_Gabriel_Okaras_The_Piano_and_Th...Pooja Bhuva
 
Python Notes for mca i year students osmania university.docx
Python Notes for mca i year students osmania university.docxPython Notes for mca i year students osmania university.docx
Python Notes for mca i year students osmania university.docxRamakrishna Reddy Bijjam
 
This PowerPoint helps students to consider the concept of infinity.
This PowerPoint helps students to consider the concept of infinity.This PowerPoint helps students to consider the concept of infinity.
This PowerPoint helps students to consider the concept of infinity.christianmathematics
 
Jual Obat Aborsi Hongkong ( Asli No.1 ) 085657271886 Obat Penggugur Kandungan...
Jual Obat Aborsi Hongkong ( Asli No.1 ) 085657271886 Obat Penggugur Kandungan...Jual Obat Aborsi Hongkong ( Asli No.1 ) 085657271886 Obat Penggugur Kandungan...
Jual Obat Aborsi Hongkong ( Asli No.1 ) 085657271886 Obat Penggugur Kandungan...ZurliaSoop
 

Último (20)

Graduate Outcomes Presentation Slides - English
Graduate Outcomes Presentation Slides - EnglishGraduate Outcomes Presentation Slides - English
Graduate Outcomes Presentation Slides - English
 
General Principles of Intellectual Property: Concepts of Intellectual Proper...
General Principles of Intellectual Property: Concepts of Intellectual  Proper...General Principles of Intellectual Property: Concepts of Intellectual  Proper...
General Principles of Intellectual Property: Concepts of Intellectual Proper...
 
Unit 3 Emotional Intelligence and Spiritual Intelligence.pdf
Unit 3 Emotional Intelligence and Spiritual Intelligence.pdfUnit 3 Emotional Intelligence and Spiritual Intelligence.pdf
Unit 3 Emotional Intelligence and Spiritual Intelligence.pdf
 
Towards a code of practice for AI in AT.pptx
Towards a code of practice for AI in AT.pptxTowards a code of practice for AI in AT.pptx
Towards a code of practice for AI in AT.pptx
 
Basic Civil Engineering first year Notes- Chapter 4 Building.pptx
Basic Civil Engineering first year Notes- Chapter 4 Building.pptxBasic Civil Engineering first year Notes- Chapter 4 Building.pptx
Basic Civil Engineering first year Notes- Chapter 4 Building.pptx
 
Interdisciplinary_Insights_Data_Collection_Methods.pptx
Interdisciplinary_Insights_Data_Collection_Methods.pptxInterdisciplinary_Insights_Data_Collection_Methods.pptx
Interdisciplinary_Insights_Data_Collection_Methods.pptx
 
Food safety_Challenges food safety laboratories_.pdf
Food safety_Challenges food safety laboratories_.pdfFood safety_Challenges food safety laboratories_.pdf
Food safety_Challenges food safety laboratories_.pdf
 
How to Manage Global Discount in Odoo 17 POS
How to Manage Global Discount in Odoo 17 POSHow to Manage Global Discount in Odoo 17 POS
How to Manage Global Discount in Odoo 17 POS
 
ICT Role in 21st Century Education & its Challenges.pptx
ICT Role in 21st Century Education & its Challenges.pptxICT Role in 21st Century Education & its Challenges.pptx
ICT Role in 21st Century Education & its Challenges.pptx
 
Spatium Project Simulation student brief
Spatium Project Simulation student briefSpatium Project Simulation student brief
Spatium Project Simulation student brief
 
Making communications land - Are they received and understood as intended? we...
Making communications land - Are they received and understood as intended? we...Making communications land - Are they received and understood as intended? we...
Making communications land - Are they received and understood as intended? we...
 
Sociology 101 Demonstration of Learning Exhibit
Sociology 101 Demonstration of Learning ExhibitSociology 101 Demonstration of Learning Exhibit
Sociology 101 Demonstration of Learning Exhibit
 
Jamworks pilot and AI at Jisc (20/03/2024)
Jamworks pilot and AI at Jisc (20/03/2024)Jamworks pilot and AI at Jisc (20/03/2024)
Jamworks pilot and AI at Jisc (20/03/2024)
 
Application orientated numerical on hev.ppt
Application orientated numerical on hev.pptApplication orientated numerical on hev.ppt
Application orientated numerical on hev.ppt
 
Introduction to Nonprofit Accounting: The Basics
Introduction to Nonprofit Accounting: The BasicsIntroduction to Nonprofit Accounting: The Basics
Introduction to Nonprofit Accounting: The Basics
 
Unit-V; Pricing (Pharma Marketing Management).pptx
Unit-V; Pricing (Pharma Marketing Management).pptxUnit-V; Pricing (Pharma Marketing Management).pptx
Unit-V; Pricing (Pharma Marketing Management).pptx
 
Sensory_Experience_and_Emotional_Resonance_in_Gabriel_Okaras_The_Piano_and_Th...
Sensory_Experience_and_Emotional_Resonance_in_Gabriel_Okaras_The_Piano_and_Th...Sensory_Experience_and_Emotional_Resonance_in_Gabriel_Okaras_The_Piano_and_Th...
Sensory_Experience_and_Emotional_Resonance_in_Gabriel_Okaras_The_Piano_and_Th...
 
Python Notes for mca i year students osmania university.docx
Python Notes for mca i year students osmania university.docxPython Notes for mca i year students osmania university.docx
Python Notes for mca i year students osmania university.docx
 
This PowerPoint helps students to consider the concept of infinity.
This PowerPoint helps students to consider the concept of infinity.This PowerPoint helps students to consider the concept of infinity.
This PowerPoint helps students to consider the concept of infinity.
 
Jual Obat Aborsi Hongkong ( Asli No.1 ) 085657271886 Obat Penggugur Kandungan...
Jual Obat Aborsi Hongkong ( Asli No.1 ) 085657271886 Obat Penggugur Kandungan...Jual Obat Aborsi Hongkong ( Asli No.1 ) 085657271886 Obat Penggugur Kandungan...
Jual Obat Aborsi Hongkong ( Asli No.1 ) 085657271886 Obat Penggugur Kandungan...
 

(1931) usage of gann sq9 & hexagon chart

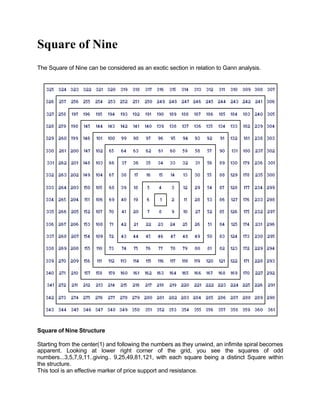
  • 1. Square of Nine The Square of Nine can be considered as an exotic section in relation to Gann analysis. Square of Nine Structure Starting from the center(1) and following the numbers as they unwind, an infimite spiral becomes apparent. Looking at lower right corner of the grid, you see the squares of odd numbers...3,5,7,9,11..giving.. 9,25,49,81,121, with each square being a distinct Square within the structure. This tool is an effective marker of price support and resistance.
  • 2. Here's how this structure becomes a calculator... Find the number 15 on the Square of Nine . If a stock was trading at a price of $15, what are the price objectives using a Gann Wheel? The number 15 is perfectly aligned under the zero and 360 degree angle marked on the top of the Wheel. Because the number 15 is aligned with zero we need make no further adjustments, just read the Gann targets straight off the wheel. The 45 degree price objective from 15 is 17. It is the next number that aligns with the 45 degree line that travels towards the top right corner. The number 19 crosses were the 90 degree line was drawn. We would use the phrase, "$19 is 90 degrees up from $15." Now skip over to 180 degrees and find $23 is directly opposite $15. We would still say, "23 is 180 degrees up from 15". At 270 degrees $28 is the price objective. A full 360 degrees up from 15 is $34. That is how a Gann Wheel is used. Why did we skip the bottom right corner angle which would be 135 degrees? Because like Fibonacci, some calculations are more important than others. The Fibonacci ratios 0.382, 0.500. 0.618, 1.000, and 1.618 are relationships we know are the critical ratios to identify. This is also how the various Gann angles are interpreted. We have a circle that is divided into quarters and sixths, but we also need to divide 360 degrees into thirds because 120 degrees and 240 are extremely important. The angles of greatest interest in financial markets are 45, 90, 120, 180, 240, 270, 315, and 360. Sampels Usage of Square of 9 (1) Find potential turning point dates: count the # of calendar days between significant A. high and low. B. high to high C. low to lwo . Find that number on the Sq. of 9. Now note the numbers which are on the same angle as your starting number, and watch for possible swings at those dates. Example: A move for low A to low B takes up 39 calendars days. You locate the number 39 on the square, and note the nubmers which are on the same angle. These would be:
  • 3. 67,105,150,201,262... Now go back to your original low; you would look for another swing point at 67 calendar days from this low, then 105 calendar days, etc. (2) Calculate potential turning point prices: take the price of a major high/low and locate that value on the Square. Note the values which are 45, 90, 120, 180, 240, 270, and 360 degrees on the Square. If you are using a major low, you would note the numbers on those angles which are greater than your starting value. If using a major high, you would use the numbers which are lower. Examples: S&P 500 07/24/2002 make a low at 775. You expect prices are going to rally and want to find potential points of resistance as price move higher. locate 775 on the Square of 9 chart, and note the following angles: 45 deg. = 909 90 deg. = 909 120 deg. = 815,933 180 deg. = 832,952 240 deg. = 853,974 270 deg. = 861
  • 4. ©2002 Global View Technology (http://www.globalviewtech.com/onlinehelp)
  • 5. Gann Hexagon Chart The Hexagon Chart Structure Let's see how Gann explains the Chart. "Since everything moves in a circle and nothing moves in straight lines , this chart is to show to you how the angles influence stocks at very low levels and very high levels and why stocks move faster the higher they get , because they have moved out to where the distance between the angles of 45* are so far apart that there is nothing to stop them and their moves are naturally rapid up and down ." We begin with a circle of “1” , yet the circle is 360* just the same . We then place a circle of circles around this circle and six circles complete the second circle , making a gain of 6 over the first one , ending the second circle at 7, making 7 on this angle a very important month, year , and week as well as days , the seventh day being sacred and a day of rest . The third circle is completed at 19 . The fourth circle around is completed at 37 – a gain of 18 over the previous circle . The fifth circle is completed at 61 , a gain of 24 over the previous circle . The sixth circle is completed at 91 , a gain of 30 over the previous circle , and the seventh circle at 127 , a gain
  • 6. of 36 over the last circle . Note that from the first the gain is 6 each time we go around . In other words, when ‘is’ have traveled six times around we have gained 36 . Note that this completes the first Hexagon and as this equals 127 months , shows why some campaigns will run 10 years and seven months , or until they reach a square of the Hexagon , or the important last angle of 45* . The eighth circle around is completed at 169 , a gain of 42 over the first . This is a very important angle and an important time factor for more reasons than one . It is 14 years and one month , or double our cycle of 7 years . Important tops and bottoms culminate at this angle as you will see by going over your charts . The ninth circle is completed at 217 , a gain of 48 over the previous circle . The tenth circle is completed at 271 , a gain of 54 . Note that 271 is the ninth circle from the first , or is the third 90* angle or 270* , three fourths of a circle , a strong point .. All this is confirmed by the Master Twelve Chart , by the four seasons and by the Square of Nine Chart , and also confirmed by the Hexagon chart ., showing that mathematical proof is always exact no matter how many ways or from what directions you figure it . The eleventh circle is completed at 331 , a gain of 60 over the last circle . The twelfth circle is completed at 397 , which completes the Hexagon ., making a gain in 11 circles of 66 from the beginning . 66 months , or 5 years and six months , marks the culmination of major campaigns in stocks . Note how often they culminate on the 60th month , then have a reaction , and make a second top or bottom in the 66th month . Note the number 66 on the Master Twelve Chart . Note it on the Square of Nine and note that 66 occurs on an angle of 180* on the Hexagon chart , all of which confirms the strong angle at this point . We have an angle of 66* , one of 67.5* and one at 68 , confirming this point to be doubly strong for tops and bottoms or space movements up or down . Note the number 360* on the Hexagon Chart . It completes a circle of 360* . From our beginning point this occurs at an angle of 180 * on the Hexagon Chart going around , but measuring from the center , it would equal an angle of 90* or 180* , making this a strong point , hard and difficult to pass, and the ending of one campaign and the beginning of another . Again with the center of the Hexagon Chart at “1” notice that 7, 19, 37, 61, 91, 127, 169, 217, 271, 331, and 397 are all on this direct angle and are important points in time measurement . Beginning with “1” and following the other angle , note that 2,9,22,41,66,97,134,177,226,281, and 342 are all on a same angle of 90*, or an angle of 60* and 240* as measured by the Hexagon Chart . Go over this Chart and the important angles each way and you will see why the resistance is met either on days , weeks, months or years, and why stocks stop and make tops and bottoms at these strong important points according to time . When any stock has passed out above 120* or especially above 127* or 127 points and gone out of the square of the first Hexagon , its fluctuations will be more rapid and it will move faster up and down . Notice near the center that in traveling from 66 to 7 you strike the angle of 180* or 90* , but when the stock gets out to 162, it can travel up to 169 before striking another strong angle . That is why fast moves occur up and down as stocks get higher and as they move from a center of time .
  • 7. Remember that everything seeks the center of gravity and important tops and bottoms are formed according to centers and measurements of time from a center , base or beginning point , either top or bottom . The angles formed going straight up and across , ‘may a com’ just the same going across as the stock travels over for days,weeks,months or years . Thus , a stock going up to 22.5 would strike an angle of 22.5 * . If it moves over 22.5 days it would strike the angle or 22.5 weeks or 22.5 months , it would also strike an angle of 22.5 * , and the higher it is when those angles are struck and the angle it hits going up , the greater the resistance to be met. Reverse that rule going down . Market movements are made just the same as any other thing which is constructed . It is just the same as constructing a building . First the foundation has to be laid down and then the four walls have to be completed and last , but not least of all , the top has to be put on . The cube or hexagon proves exactly the law which works because of time and space in the market . When a building is put up it is built according to a square or hexagon. It has four walls or four sides , a bottom and a top ; therefore , it is a cube . In working out the 20- year Cycle in the stock market , the first 60* or 5 years , from the beginning forms the bottom of the cube . The second 60* , running to 120* , completes the first angle or the first side and runs out the 10 year Cycle . The third 60 * or the second side , ends 15 years or 180 *. It is very important because we have the building half completed and must meet the strongest resistance at this point . The fourth 60 * , or at the end of 20 yrs or 240 months , completes the third side . We are now two thirds around the building , a very strong point which culminates and completes our 20 – year Cycle . The fifth 60 * , or 300 * point ,days ,weeks , or months completes 25 years , a repetition of the first five years , but it completes the fourth side of our building and is a very important angle . The sixth 60 * , or 360 * , completing the circle and ending 30 years as measured by our Time Factor , which runs 1* per month on an angle of 45 * , completes the top .This is a complete cube and we begin over again . " "Study this in connection with the Hexagon Chart . It will help you . " Jan 1931 WD Gann. ©2002 Global View Technology (http://www.globalviewtech.com/onlinehelp)