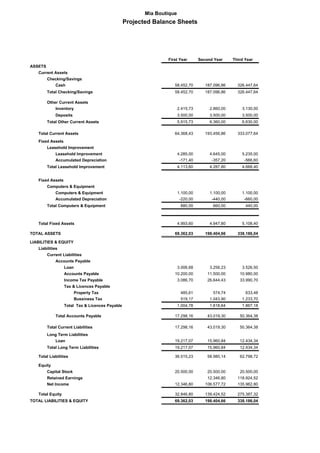
SlideShare una empresa de Scribd logo
1 de 5
Descargar para leer sin conexión
Mia Boutique
Projected Balance Sheets
First Year Second Year Third Year
ASSETS
Current Assets
Checking/Savings
Cash 58.452,70 187.096,86 326.447,64
Total Checking/Savings 58.452,70 187.096,86 326.447,64
Other Current Assets
Inventory 2.415,73 2.860,00 3.130,00
Deposits 3.500,00 3.500,00 3.500,00
Total Other Current Assets 5.915,73 6.360,00 6.630,00
Total Current Assets 64.368,43 193.456,86 333.077,64
Fixed Assets
Leasehold Improvement
Leasehold Improvement 4.285,00 4.645,00 5.235,00
Accumulated Depreciation -171,40 -357,20 -566,60
Total Leasehold Improvement 4.113,60 4.287,80 4.668,40
Fixed Assets
Computers & Equipment
Computers & Equipment 1.100,00 1.100,00 1.100,00
Accumulated Depreciation -220,00 -440,00 -660,00
Total Computers & Equipment 880,00 660,00 440,00
Total Fixed Assets 4.993,60 4.947,80 5.108,40
TOTAL ASSETS 69.362,03 198.404,66 338.186,04
LIABILITIES & EQUITY
Liabilities
Current Liabilities
Accounts Payable
Loan 3.006,68 3.256,23 3.526,50
Accounts Payable 10.200,00 11.500,00 10.980,00
Income Tax Payable 3.086,70 26.644,43 33.990,70
Tax & Licences Payable
Property Tax 485,61 574,74 633,48
Bussiness Tax 519,17 1.043,90 1.233,70
Total Tax & Licences Payable 1.004,78 1.618,64 1.867,18
Total Accounts Payable 17.298,16 43.019,30 50.364,38
Total Current Liabilities 17.298,16 43.019,30 50.364,38
Long Term Liabilities
Loan 19.217,07 15.960,84 12.434,34
Total Long Term Liabilities 19.217,07 15.960,84 12.434,34
Total Liabilities 36.515,23 58.980,14 62.798,72
Equity
Capital Stock 20.500,00 20.500,00 20.500,00
Retained Earnings 12.346,80 118.924,52
Net Income 12.346,80 106.577,72 135.962,80
Total Equity 32.846,80 139.424,52 275.387,32
TOTAL LIABILITIES & EQUITY 69.362,03 198.404,66 338.186,04
Mia Boutique
Projected Profit & Loss
Ordinary Income/Expense
Income
Sales 199680 401500 474500
Total Income 199680 401500 474500
Cost of Goods Sold
Direct Cost of Sales 65894 33,0% 132495 33,0% 156585 33,0%
Other Direct Cost 31713 15,9% 40918 10,2% 47911 10,1%
Total COGS 97607 48,9% 173413 43,2% 204496 43,1%
Gross Profit 102073 51,1% 228087 56,8% 270004 56,9%
Expense
Insurance 700 0,4% 700 0,2% 700 0,1%
Office & Printing Expenses 645 0,3% 600 0,1% 660 0,1%
Payroll Expenses 22800 11,4% 26640 6,6% 28944 6,1%
Salary Related Expenses 3192 1,6% 3730 0,9% 4052 0,9%
Professional Fees 3360 1,7% 3696 0,9% 3696 0,8%
Rent 36000 18,0% 36000 9,0% 36000 7,6%
Repairs 960 0,5% 1152 0,3% 1267 0,3%
Sales and Marketing Expense
Commissions 4992 10038 11863
Advertising 4614 2400 2400
Total Sales and Marketing Expense 9606 4,8% 12438 3,1% 14263 3,0%
Taxes & Licences 486 0,2% 575 0,1% 633 0,1%
Utilities 6600 3,3% 7260 1,8% 7986 1,7%
Subtotal Expenses 84348 42,2% 92790 23,1% 98201 20,7%
Depreciation 391 0,2% 406 0,1% 429 0,1%
Total Expenses 84740 42,4% 93196 23,2% 98631 20,8%
Net Ordinary Income 17333 8,7% 134891 33,6% 171373 36,1%
Interest 1900 1,0% 1669 0,4% 1420 0,3%
Profit before Income 15434 7,7% 133222 33,2% 169954 35,8%
Income Tax 20% 3087 1,5% 26644 6,6% 33991 7,2%
Net Profit after Tax 12347 6,2% 106578 26,5% 135963 28,7%
First Year Second Year Third Year
Mia Boutique
Projected Cash Flows
First Year Second Year Third Year
OPERATING ACTIVITIES
Net Income 12.346,80 106.577,72 135.962,80
Adjustments to reconcile Net Income
to net cash provided by operations:
Deposits -3.500,00
Inventory -2.415,73 -444,27 -270,00
Accounts Payable 10.200,00 1.300,00 -520,00
Income Tax Payable 3.086,70 23.557,73 7.346,27
Tax & Licences Payable 1.004,78 613,86 248,54
Net cash provided by Operating Activities 20.722,55 131.605,04 142.767,61
INVESTING ACTIVITIES
Computers & Equipment -1.100,00
Computers & Equipment:Accumulated Depreciat Equipment 220,00 220,00 220,00
Leasehold Improvement -4.285,00 -360,00 -590,00
Leasehold Improvement:Accumulated Depr Leasehold Impr 171,40 185,80 209,40
Net cash provided by Investing Activities -4.993,60 45,80 -160,60
FINANCING ACTIVITIES
Loan 22.223,75 -3.006,68 -3.256,23
Capital Stock 20.500,00
Net cash provided by Financing Activities 42.723,75 -3.006,68 -3.256,23
Net cash increase for period 58.452,70 128.644,16 139.350,78
Cash at beginning of period 58.452,70 187.096,86
Cash at end of period 58.452,70 187.096,86 326.447,64
Mia Boutique
Projected Monthly Profit & Loss
First Year
Sales seasons Low High High High High Low Low High Low Low High High
Jan Feb March April May Jun Jul Aug Sep Oct Nov Dec
Sales 13223 17223 18223 18223 18223 14223 15223 17723 14323 14623 19123 19327 199680 100,0%
- Cost of Goods Sold 4364 5684 6014 6014 6014 4694 5024 5849 4727 4826 6311 6378 65894 33,0%
- Other Direct Costs 2643 2643 2643 2643 2643 2643 2643 2643 2643 2643 2643 2643 31713 15,9%
Total Cost 7006 8326 8656 8656 8656 7336 7666 8491 7369 7468 8953 9020 97607 48,9%
Gross Profit 6217 8897 9567 9567 9567 6887 7557 9232 6954 7155 10170 10306 102073 51,1%
Rent 3000 3000 3000 3000 3000 3000 3000 3000 3000 3000 3000 3000 36000 18,0%
Owner's salary 1600 1600 1600 1600 1600 1600 1600 1600 1600 1600 1600 1600 19200 9,6%
Other Salaries 300 300 300 300 300 300 300 300 300 300 300 300 3600 1,8%
Salary Related Expense 266 266 266 266 266 266 266 266 266 266 266 266 3192 1,6%
Commissions 331 431 456 456 456 356 381 443 358 366 478 483 4992 2,5%
Advertising 620 333 333 333 333 333 333 333 333 333 333 333 333 4614 2,3%
Insurance 58 58 58 58 58 58 58 58 58 58 58 58 700 0,4%
Professional Fees 280 280 280 280 280 280 280 280 280 280 280 280 3360 1,7%
Repairs 80 80 80 80 80 80 80 80 80 80 80 80 960 0,5%
Office & Printing Expenses 165 40 40 40 40 40 40 40 40 40 40 40 40 645 0,3%
Utilities 550 550 550 550 550 550 550 550 550 550 550 550 6600 3,3%
Subtotal Expenses 785 6838 6938 6963 6963 6963 6863 6888 6950 6865 6873 6985 6990 83863 42,0%
- Depreciation 33 33 33 33 33 33 33 33 33 33 33 33 391 0,2%
TOTAL EXPENSES 785 6870 6970 6995 6995 6995 6895 6920 6983 6898 6905 7018 7023 84254 42,2%
Net Ordinary Income -785 -654 1926 2571 2571 2571 -9 636 2249 56 249 3152 3283 17819 8,9%
Interest Expense 158 158 158 158 158 158 158 158 158 158 158 158 1900 1,0%
-785 -812 1768 2413 2413 2413 -167 478 2091 -102 91 2994 3125 15919 8,0%
Property Tax 486 0,2%
Profit before Tax 15434
Income Tax 20% -157 -162 354 483 483 483 -33 96 418 -20 18 599 625 3087 1,5%
Net Profit after Tax -628 -650 1414 1930 1930 1930 -134 382 1672 -82 73 2395 2500 12347 6,2%
TotalStart up
Start-Up Composition
0
5000
10000
15000
20000
25000
Investments Loans Assets Expenses Cash
20500
25000
23575
785
20640

Más contenido relacionado

La actualidad más candente

Valuation Of Maruti Suzuki
Valuation Of Maruti SuzukiValuation Of Maruti Suzuki
Valuation Of Maruti Suzuki
Aakash Singh
 
Edo resultados combinado julio 2014 grupo surfax
Edo resultados combinado julio 2014 grupo surfaxEdo resultados combinado julio 2014 grupo surfax
Edo resultados combinado julio 2014 grupo surfax
Surfax
 

La actualidad más candente (19)

Financial Statement of Tata Motors
Financial Statement of Tata MotorsFinancial Statement of Tata Motors
Financial Statement of Tata Motors
 
Examen Final De InformàTico
Examen Final De InformàTicoExamen Final De InformàTico
Examen Final De InformàTico
 
Valuation Of Maruti Suzuki
Valuation Of Maruti SuzukiValuation Of Maruti Suzuki
Valuation Of Maruti Suzuki
 
samsung electronics 005930 Algorithm Investment Report
samsung electronics 005930 Algorithm Investment Reportsamsung electronics 005930 Algorithm Investment Report
samsung electronics 005930 Algorithm Investment Report
 
datasolution 263800 Algorithm Investment Report
datasolution 263800 Algorithm Investment Reportdatasolution 263800 Algorithm Investment Report
datasolution 263800 Algorithm Investment Report
 
kakao 035720 Algorithm Investment Report
kakao 035720 Algorithm Investment Reportkakao 035720 Algorithm Investment Report
kakao 035720 Algorithm Investment Report
 
Flevy.com - Excel Model for Manufacturing Firm
Flevy.com - Excel Model for Manufacturing FirmFlevy.com - Excel Model for Manufacturing Firm
Flevy.com - Excel Model for Manufacturing Firm
 
lotte chilsung 005300 Algorithm Investment Report
lotte chilsung 005300 Algorithm Investment Reportlotte chilsung 005300 Algorithm Investment Report
lotte chilsung 005300 Algorithm Investment Report
 
samsung electronics 005930 Algorithm Investment Report
samsung electronics 005930 Algorithm Investment Reportsamsung electronics 005930 Algorithm Investment Report
samsung electronics 005930 Algorithm Investment Report
 
Financial analysis of tata motors
Financial analysis of tata motorsFinancial analysis of tata motors
Financial analysis of tata motors
 
Edo resultados combinado julio 2014 grupo surfax
Edo resultados combinado julio 2014 grupo surfaxEdo resultados combinado julio 2014 grupo surfax
Edo resultados combinado julio 2014 grupo surfax
 
gs-078930-Algorithm Investment Report
gs-078930-Algorithm Investment Reportgs-078930-Algorithm Investment Report
gs-078930-Algorithm Investment Report
 
Epic research malaysia daily klse report for 2nd december 2015
Epic research malaysia   daily klse report for 2nd december 2015Epic research malaysia   daily klse report for 2nd december 2015
Epic research malaysia daily klse report for 2nd december 2015
 
Bat
BatBat
Bat
 
bKash equity valuation 2018
bKash equity valuation 2018bKash equity valuation 2018
bKash equity valuation 2018
 
lotte foods 002270 Algorithm Investment Report
lotte foods 002270 Algorithm Investment Reportlotte foods 002270 Algorithm Investment Report
lotte foods 002270 Algorithm Investment Report
 
Epic research malaysia daily klse report for 30th november 2015
Epic research malaysia   daily klse report for 30th november 2015Epic research malaysia   daily klse report for 30th november 2015
Epic research malaysia daily klse report for 30th november 2015
 
Comparing Classical and Machine Learning Algorithms for Time Series Forecasting
Comparing Classical and Machine Learning Algorithms  for Time Series ForecastingComparing Classical and Machine Learning Algorithms  for Time Series Forecasting
Comparing Classical and Machine Learning Algorithms for Time Series Forecasting
 
Resultados 1º prueba regional(gráficos)
Resultados 1º prueba regional(gráficos)Resultados 1º prueba regional(gráficos)
Resultados 1º prueba regional(gráficos)
 

Destacado

NAMA Press Release
NAMA Press ReleaseNAMA Press Release
NAMA Press Release
Gwen Murtha
 
Batman 150128063640-conversion-gate01
Batman 150128063640-conversion-gate01Batman 150128063640-conversion-gate01
Batman 150128063640-conversion-gate01
danimela
 

Destacado (13)

20th Reception
20th Reception20th Reception
20th Reception
 
NAMA Press Release
NAMA Press ReleaseNAMA Press Release
NAMA Press Release
 
부평오피, 마포오피,안양오피@(다솜넷)부평오피
부평오피, 마포오피,안양오피@(다솜넷)부평오피부평오피, 마포오피,안양오피@(다솜넷)부평오피
부평오피, 마포오피,안양오피@(다솜넷)부평오피
 
Essay
EssayEssay
Essay
 
Trinity Kings World Leadership: "The Importance of Starting Well"
Trinity Kings World Leadership: "The Importance of Starting Well"Trinity Kings World Leadership: "The Importance of Starting Well"
Trinity Kings World Leadership: "The Importance of Starting Well"
 
Elements of Byron Bay Marquee
Elements of Byron Bay MarqueeElements of Byron Bay Marquee
Elements of Byron Bay Marquee
 
Batman 150128063640-conversion-gate01
Batman 150128063640-conversion-gate01Batman 150128063640-conversion-gate01
Batman 150128063640-conversion-gate01
 
Trinity Kings World Leadership: King Terrell and his Queen, Kathryn Patillo(F...
Trinity Kings World Leadership: King Terrell and his Queen, Kathryn Patillo(F...Trinity Kings World Leadership: King Terrell and his Queen, Kathryn Patillo(F...
Trinity Kings World Leadership: King Terrell and his Queen, Kathryn Patillo(F...
 
Trinity Kings Family Leadership: How to grow a Healthy Family Tree(System)...
Trinity Kings Family Leadership: How to grow a Healthy Family Tree(System)...Trinity Kings Family Leadership: How to grow a Healthy Family Tree(System)...
Trinity Kings Family Leadership: How to grow a Healthy Family Tree(System)...
 
Rayos
RayosRayos
Rayos
 
Poster cs543
Poster cs543Poster cs543
Poster cs543
 
Trinity Kings World Leadership: If the Leaders don't grow the people won't ei...
Trinity Kings World Leadership: If the Leaders don't grow the people won't ei...Trinity Kings World Leadership: If the Leaders don't grow the people won't ei...
Trinity Kings World Leadership: If the Leaders don't grow the people won't ei...
 
Exemptions to private companies under companies act 2013 impact analysis
Exemptions to private companies under companies act 2013 impact analysisExemptions to private companies under companies act 2013 impact analysis
Exemptions to private companies under companies act 2013 impact analysis
 

Similar a Plan de Negocios - Cuadros

Financials1 P
Financials1 PFinancials1 P
Financials1 P
emronly
 
MGMT260 - Financial Projections
MGMT260 - Financial ProjectionsMGMT260 - Financial Projections
MGMT260 - Financial Projections
Amir Patel
 
Budgeting And Forecasting In Accounting PowerPoint Presentation Slides
Budgeting And Forecasting In Accounting PowerPoint Presentation SlidesBudgeting And Forecasting In Accounting PowerPoint Presentation Slides
Budgeting And Forecasting In Accounting PowerPoint Presentation Slides
SlideTeam
 
Valuation Of Maruti Suzuki
Valuation Of Maruti SuzukiValuation Of Maruti Suzuki
Valuation Of Maruti Suzuki
Aakash Singh
 
Financial InformationIn this worksheet, you will recreate both the
Financial InformationIn this worksheet, you will recreate both theFinancial InformationIn this worksheet, you will recreate both the
Financial InformationIn this worksheet, you will recreate both the
ChereCheek752
 

Similar a Plan de Negocios - Cuadros (20)

Profit and loss projection
Profit and loss projectionProfit and loss projection
Profit and loss projection
 
Financials1 P
Financials1 PFinancials1 P
Financials1 P
 
MF
MFMF
MF
 
MGMT260 - Financial Projections
MGMT260 - Financial ProjectionsMGMT260 - Financial Projections
MGMT260 - Financial Projections
 
CEO Dashboard Template in Excel
CEO Dashboard Template in ExcelCEO Dashboard Template in Excel
CEO Dashboard Template in Excel
 
Neslte India Ltd_Financial Model Working.pdf
Neslte India Ltd_Financial Model Working.pdfNeslte India Ltd_Financial Model Working.pdf
Neslte India Ltd_Financial Model Working.pdf
 
Budgeting And Forecasting In Accounting PowerPoint Presentation Slides
Budgeting And Forecasting In Accounting PowerPoint Presentation SlidesBudgeting And Forecasting In Accounting PowerPoint Presentation Slides
Budgeting And Forecasting In Accounting PowerPoint Presentation Slides
 
Valuation Of Maruti Suzuki
Valuation Of Maruti SuzukiValuation Of Maruti Suzuki
Valuation Of Maruti Suzuki
 
120981064 new-doll
120981064 new-doll120981064 new-doll
120981064 new-doll
 
Financial InformationIn this worksheet, you will recreate both the
Financial InformationIn this worksheet, you will recreate both theFinancial InformationIn this worksheet, you will recreate both the
Financial InformationIn this worksheet, you will recreate both the
 
INVESTAURA_Business-Planning-Template.pdf
INVESTAURA_Business-Planning-Template.pdfINVESTAURA_Business-Planning-Template.pdf
INVESTAURA_Business-Planning-Template.pdf
 
Current Years Estimation PowerPoint Presentation Slides
Current Years Estimation PowerPoint Presentation SlidesCurrent Years Estimation PowerPoint Presentation Slides
Current Years Estimation PowerPoint Presentation Slides
 
Work sample
Work sampleWork sample
Work sample
 
delaura 03 restaurant-projections 1
delaura 03 restaurant-projections 1delaura 03 restaurant-projections 1
delaura 03 restaurant-projections 1
 
Muthengi mike bamburi financial model - enhancement
Muthengi mike   bamburi financial model - enhancementMuthengi mike   bamburi financial model - enhancement
Muthengi mike bamburi financial model - enhancement
 
OFC BUDGET.V5
OFC BUDGET.V5OFC BUDGET.V5
OFC BUDGET.V5
 
GuessBox Financial Model 2017
GuessBox Financial Model 2017GuessBox Financial Model 2017
GuessBox Financial Model 2017
 
Big Buns Ballston (est. 2007)
Big Buns Ballston (est. 2007)Big Buns Ballston (est. 2007)
Big Buns Ballston (est. 2007)
 
Example print out-efm-de
Example print out-efm-deExample print out-efm-de
Example print out-efm-de
 
Hansson
HanssonHansson
Hansson
 

Plan de Negocios - Cuadros

  • 1. Mia Boutique Projected Balance Sheets First Year Second Year Third Year ASSETS Current Assets Checking/Savings Cash 58.452,70 187.096,86 326.447,64 Total Checking/Savings 58.452,70 187.096,86 326.447,64 Other Current Assets Inventory 2.415,73 2.860,00 3.130,00 Deposits 3.500,00 3.500,00 3.500,00 Total Other Current Assets 5.915,73 6.360,00 6.630,00 Total Current Assets 64.368,43 193.456,86 333.077,64 Fixed Assets Leasehold Improvement Leasehold Improvement 4.285,00 4.645,00 5.235,00 Accumulated Depreciation -171,40 -357,20 -566,60 Total Leasehold Improvement 4.113,60 4.287,80 4.668,40 Fixed Assets Computers & Equipment Computers & Equipment 1.100,00 1.100,00 1.100,00 Accumulated Depreciation -220,00 -440,00 -660,00 Total Computers & Equipment 880,00 660,00 440,00 Total Fixed Assets 4.993,60 4.947,80 5.108,40 TOTAL ASSETS 69.362,03 198.404,66 338.186,04 LIABILITIES & EQUITY Liabilities Current Liabilities Accounts Payable Loan 3.006,68 3.256,23 3.526,50 Accounts Payable 10.200,00 11.500,00 10.980,00 Income Tax Payable 3.086,70 26.644,43 33.990,70 Tax & Licences Payable Property Tax 485,61 574,74 633,48 Bussiness Tax 519,17 1.043,90 1.233,70 Total Tax & Licences Payable 1.004,78 1.618,64 1.867,18 Total Accounts Payable 17.298,16 43.019,30 50.364,38 Total Current Liabilities 17.298,16 43.019,30 50.364,38 Long Term Liabilities Loan 19.217,07 15.960,84 12.434,34 Total Long Term Liabilities 19.217,07 15.960,84 12.434,34 Total Liabilities 36.515,23 58.980,14 62.798,72 Equity Capital Stock 20.500,00 20.500,00 20.500,00 Retained Earnings 12.346,80 118.924,52 Net Income 12.346,80 106.577,72 135.962,80 Total Equity 32.846,80 139.424,52 275.387,32 TOTAL LIABILITIES & EQUITY 69.362,03 198.404,66 338.186,04
  • 2. Mia Boutique Projected Profit & Loss Ordinary Income/Expense Income Sales 199680 401500 474500 Total Income 199680 401500 474500 Cost of Goods Sold Direct Cost of Sales 65894 33,0% 132495 33,0% 156585 33,0% Other Direct Cost 31713 15,9% 40918 10,2% 47911 10,1% Total COGS 97607 48,9% 173413 43,2% 204496 43,1% Gross Profit 102073 51,1% 228087 56,8% 270004 56,9% Expense Insurance 700 0,4% 700 0,2% 700 0,1% Office & Printing Expenses 645 0,3% 600 0,1% 660 0,1% Payroll Expenses 22800 11,4% 26640 6,6% 28944 6,1% Salary Related Expenses 3192 1,6% 3730 0,9% 4052 0,9% Professional Fees 3360 1,7% 3696 0,9% 3696 0,8% Rent 36000 18,0% 36000 9,0% 36000 7,6% Repairs 960 0,5% 1152 0,3% 1267 0,3% Sales and Marketing Expense Commissions 4992 10038 11863 Advertising 4614 2400 2400 Total Sales and Marketing Expense 9606 4,8% 12438 3,1% 14263 3,0% Taxes & Licences 486 0,2% 575 0,1% 633 0,1% Utilities 6600 3,3% 7260 1,8% 7986 1,7% Subtotal Expenses 84348 42,2% 92790 23,1% 98201 20,7% Depreciation 391 0,2% 406 0,1% 429 0,1% Total Expenses 84740 42,4% 93196 23,2% 98631 20,8% Net Ordinary Income 17333 8,7% 134891 33,6% 171373 36,1% Interest 1900 1,0% 1669 0,4% 1420 0,3% Profit before Income 15434 7,7% 133222 33,2% 169954 35,8% Income Tax 20% 3087 1,5% 26644 6,6% 33991 7,2% Net Profit after Tax 12347 6,2% 106578 26,5% 135963 28,7% First Year Second Year Third Year
  • 3. Mia Boutique Projected Cash Flows First Year Second Year Third Year OPERATING ACTIVITIES Net Income 12.346,80 106.577,72 135.962,80 Adjustments to reconcile Net Income to net cash provided by operations: Deposits -3.500,00 Inventory -2.415,73 -444,27 -270,00 Accounts Payable 10.200,00 1.300,00 -520,00 Income Tax Payable 3.086,70 23.557,73 7.346,27 Tax & Licences Payable 1.004,78 613,86 248,54 Net cash provided by Operating Activities 20.722,55 131.605,04 142.767,61 INVESTING ACTIVITIES Computers & Equipment -1.100,00 Computers & Equipment:Accumulated Depreciat Equipment 220,00 220,00 220,00 Leasehold Improvement -4.285,00 -360,00 -590,00 Leasehold Improvement:Accumulated Depr Leasehold Impr 171,40 185,80 209,40 Net cash provided by Investing Activities -4.993,60 45,80 -160,60 FINANCING ACTIVITIES Loan 22.223,75 -3.006,68 -3.256,23 Capital Stock 20.500,00 Net cash provided by Financing Activities 42.723,75 -3.006,68 -3.256,23 Net cash increase for period 58.452,70 128.644,16 139.350,78 Cash at beginning of period 58.452,70 187.096,86 Cash at end of period 58.452,70 187.096,86 326.447,64
  • 4. Mia Boutique Projected Monthly Profit & Loss First Year Sales seasons Low High High High High Low Low High Low Low High High Jan Feb March April May Jun Jul Aug Sep Oct Nov Dec Sales 13223 17223 18223 18223 18223 14223 15223 17723 14323 14623 19123 19327 199680 100,0% - Cost of Goods Sold 4364 5684 6014 6014 6014 4694 5024 5849 4727 4826 6311 6378 65894 33,0% - Other Direct Costs 2643 2643 2643 2643 2643 2643 2643 2643 2643 2643 2643 2643 31713 15,9% Total Cost 7006 8326 8656 8656 8656 7336 7666 8491 7369 7468 8953 9020 97607 48,9% Gross Profit 6217 8897 9567 9567 9567 6887 7557 9232 6954 7155 10170 10306 102073 51,1% Rent 3000 3000 3000 3000 3000 3000 3000 3000 3000 3000 3000 3000 36000 18,0% Owner's salary 1600 1600 1600 1600 1600 1600 1600 1600 1600 1600 1600 1600 19200 9,6% Other Salaries 300 300 300 300 300 300 300 300 300 300 300 300 3600 1,8% Salary Related Expense 266 266 266 266 266 266 266 266 266 266 266 266 3192 1,6% Commissions 331 431 456 456 456 356 381 443 358 366 478 483 4992 2,5% Advertising 620 333 333 333 333 333 333 333 333 333 333 333 333 4614 2,3% Insurance 58 58 58 58 58 58 58 58 58 58 58 58 700 0,4% Professional Fees 280 280 280 280 280 280 280 280 280 280 280 280 3360 1,7% Repairs 80 80 80 80 80 80 80 80 80 80 80 80 960 0,5% Office & Printing Expenses 165 40 40 40 40 40 40 40 40 40 40 40 40 645 0,3% Utilities 550 550 550 550 550 550 550 550 550 550 550 550 6600 3,3% Subtotal Expenses 785 6838 6938 6963 6963 6963 6863 6888 6950 6865 6873 6985 6990 83863 42,0% - Depreciation 33 33 33 33 33 33 33 33 33 33 33 33 391 0,2% TOTAL EXPENSES 785 6870 6970 6995 6995 6995 6895 6920 6983 6898 6905 7018 7023 84254 42,2% Net Ordinary Income -785 -654 1926 2571 2571 2571 -9 636 2249 56 249 3152 3283 17819 8,9% Interest Expense 158 158 158 158 158 158 158 158 158 158 158 158 1900 1,0% -785 -812 1768 2413 2413 2413 -167 478 2091 -102 91 2994 3125 15919 8,0% Property Tax 486 0,2% Profit before Tax 15434 Income Tax 20% -157 -162 354 483 483 483 -33 96 418 -20 18 599 625 3087 1,5% Net Profit after Tax -628 -650 1414 1930 1930 1930 -134 382 1672 -82 73 2395 2500 12347 6,2% TotalStart up
  • 5. Start-Up Composition 0 5000 10000 15000 20000 25000 Investments Loans Assets Expenses Cash 20500 25000 23575 785 20640