
Recomendados
Más contenido relacionado
La actualidad más candente
La actualidad más candente (20)
Destacado
Similar a Rising Obesity Epidemic
Similar a Rising Obesity Epidemic (16)
Más de Julie Pal
Más de Julie Pal (20)
Rising Obesity Epidemic
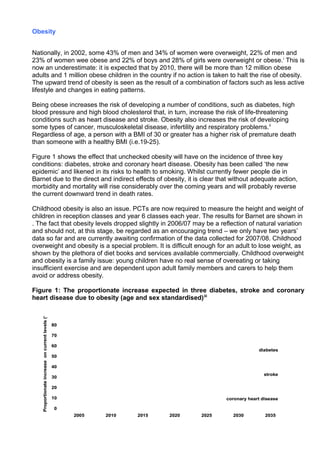
- 1. Obesity Nationally, in 2002, some 43% of men and 34% of women were overweight, 22% of men and 23% of women wee obese and 22% of boys and 28% of girls were overweight or obese.i This is now an underestimate: it is expected that by 2010, there will be more than 12 million obese adults and 1 million obese children in the country if no action is taken to halt the rise of obesity. The upward trend of obesity is seen as the result of a combination of factors such as less active lifestyle and changes in eating patterns. Being obese increases the risk of developing a number of conditions, such as diabetes, high blood pressure and high blood cholesterol that, in turn, increase the risk of life-threatening conditions such as heart disease and stroke. Obesity also increases the risk of developing some types of cancer, musculoskeletal disease, infertility and respiratory problems.ii Regardless of age, a person with a BMI of 30 or greater has a higher risk of premature death than someone with a healthy BMI (i.e.19-25). Figure 1 shows the effect that unchecked obesity will have on the incidence of three key conditions: diabetes, stroke and coronary heart disease. Obesity has been called ‘the new epidemic’ and likened in its risks to health to smoking. Whilst currently fewer people die in Barnet due to the direct and indirect effects of obesity, it is clear that without adequate action, morbidity and mortality will rise considerably over the coming years and will probably reverse the current downward trend in death rates. Childhood obesity is also an issue. PCTs are now required to measure the height and weight of children in reception classes and year 6 classes each year. The results for Barnet are shown in . The fact that obesity levels dropped slightly in 2006/07 may be a reflection of natural variation and should not, at this stage, be regarded as an encouraging trend – we only have two years’ data so far and are currently awaiting confirmation of the data collected for 2007/08. Childhood overweight and obesity is a special problem. It is difficult enough for an adult to lose weight, as shown by the plethora of diet books and services available commercially. Childhood overweight and obesity is a family issue: young children have no real sense of overeating or taking insufficient exercise and are dependent upon adult family members and carers to help them avoid or address obesity. Figure 1: The proportionate increase expected in three diabetes, stroke and coronary heart disease due to obesity (age and sex standardised)iii 0 10 20 30 40 50 60 70 80 2005 2010 2015 2020 2025 2030 2035 Proportionateincreaseoncurrentlevels(%) diabetes stroke coronary heart disease 0 10 20 30 40 50 60 70 80 2005 2010 2015 2020 2025 2030 2035 Proportionateincreaseoncurrentlevels(%) diabetes stroke coronary heart disease
- 2. Figure 2: Current obesity levels in Barnet reception classes and Year 6 classes and trajectory The relationship between diversity and deprivation and obesity Both men and women in lower socio-economic groups are more likely to be obese than those in professional occupations. In terms of differences between ethnic groups, Asian children more likely to be obese compared to White children, and Black Caribbean women have obesity levels much higher than the national average, as do Pakistani women, albeit to a lesser extent. Local targets In common with other London PCTs, we are required to reduce the year-on-year rise in childhood obesity. The trajectory for this is shown in Key things that need to be done The key activities required are: expanding services for families so that obese children can be better enabled to lose weight; targeting groups more likely to be overweight or obese to identify and manage risk factors for cardiovascular disease; and establishing services for GPs, practice nurses, community pharmacists, hospital doctors, nurses and allied health professionals, and social care workers can signpost and/or refer people to if they are obese. 2005/06 2006/07 2007/08 2008/09 2009/10 2010/11 0 2 4 6 8 10 12 14 16 18 20 Proportion(%)ofchildrenidentifiedasobese reception class year 6 actual trajectorydata being collected 10.5 17.7 9.21 17.3 10.1 10.5 10.9 18.2 18.6 19.0 2005/06 2006/07 2007/08 2008/09 2009/10 2010/11 0 2 4 6 8 10 12 14 16 18 20 Proportion(%)ofchildrenidentifiedasobese reception class year 6 actual trajectorydata being collected 10.5 17.7 9.21 17.3 10.1 10.5 10.9 18.2 18.6 19.0
- 3. References
- 4. i Office for National Statistics. Health Survey for England, 2002. Office of National Statistics. London ii National Audit Office Tackling obesity in England. London. 2001 iii http://www.foresight.gov.uk/Obesity/Obesity_final/Index.html (accessed 20 March 2008)