SlideShare una empresa de Scribd logo
1 de 17
Thin-layer chromatography
Thin-layer chromatography (TLC) is a chromatography technique used to
separate non-volatile mixtures. Thin-layer chromatography is performed on a sheet
of glass, plastic, or aluminium foil, which is coated with a thin layer of adsorbent
material, usually silica gel, aluminium oxide (alumina), or cellulose. This layer of
adsorbentis known as the stationary phase.
After the sample has been applied on the plate, a solvent or solvent mixture
(known as the mobile phase) is drawn up the plate via capillary action. Because
different analytes ascend the TLC plate at different rates, separation is achieved.
The mobile phase has different properties from the stationary phase. For example,
with silica gel, a very polar substance, non-polar mobile phases such as heptane are
used. The mobile phase may be a mixture, allowing chemists to fine-tune the bulk
properties of the mobile phase.
After the experiment, the spots are visualized. Often this can be done simply
by projecting ultraviolet light onto the sheet; the sheets are treated with a phosphor,
and dark spots appear on the sheet where compounds absorb the light impinging on
a certain area. Chemical processes canalso be used to visualize spots;
anisaldehyde, for example, forms colored adducts with many compounds,and
sulfuric acid will char most organic compounds,leaving a dark spoton the sheet.
To quantify the results, the distance traveled by the substancebeing considered is
divided by the total distance traveled by the mobile phase. (The mobile phase must
not be allowed to reach the end of the stationary phase.) This ratio is called the
retardation factor (Rf). In general, a substancewhose structure resembles the
stationary phase will have low Rf, while one that has a similar structure to the
mobile phase will have high retardation factor.
Retardation factors are characteristic, but will change depending on the exact
condition of the mobile and stationary phase. For this reason, chemists usually
apply a sample of a known compound to the sheet before running the experiment.
Thin-layer chromatography can be used to monitor the progress of a
reaction, identify compounds present in a given mixture, and determine the purity
of a substance. Specific examples of these applications include: analyzing
ceramides and fatty acids, detection of pesticides or insecticides in food and water,
analyzing the dye composition of fibers in forensics, as saying the radiochemical
purity of radiopharmaceuticals, or identification of medicinal plants and their
constituents. A number of enhancements can be made to the original method to
automate the different steps, to increase the resolution achieved with TLC and to
allow more accurate quantitative analysis. This method is referred to as HPTLC, or
"high-performance TLC". HPTLC typically uses thinner layers of stationary phase
and smaller sample volumes, thus reducing the loss of resolution due to diffusion.
Contents
 Plate preparation
 Technique
Separation Process and Principle
 Analysis
 Applications
Characterization
Isolation
Plate preparation
TLC plates are usually commercially available, with standard particle size
ranges to improve reproducibility. They are prepared by mixing the adsorbent,
such as silica gel, with a small amount of inert binder like calcium sulfate
(gypsum) and water. This mixture is spread as a thick slurry on an unreactive
carrier sheet, usually glass, thick aluminum foil, or plastic. The resultant plate is
dried and activated by heating in an oven for thirty minutes at 110 °C. The
thickness of the absorbentlayer is typically around 0.1 – 0.25 mm for analytical
purposes and around 0.5 – 2.0 mm for preparative TLC.
Technique
The process is similar to paper chromatography with the advantage of faster
runs, better separations, and the choice between different stationary phases.
Because of its simplicity and speed TLC is often used for monitoring chemical
reactions and for the qualitative analysis of reaction products. Plates can be labeled
before or after the chromatography process using a pencil or other implement that
will not interfere or react with the process.
To run a thin layer chromatography plate, the following procedure is carried
out,
 Using a capillary, a small spotof solution containing the sample is applied to
a plate, about 1.5 centimeters from the bottom edge. The solvent is allowed
to completely evaporate off to prevent it from interfering with sample's
interactions with the mobile phase in the next step. If a non-volatile solvent
was used to apply the sample, the plate needs to be dried in a vacuum
chamber. This step is often repeated to ensure there is enough analyte at the
starting spoton the plate to obtain a visible result. Different samples can be
placed in a row of spots the same distance from the bottom edge, each of
which will move in its own adjacent lane from its own starting point.
 A small amount of an appropriate solvent (eluent) is poured into a glass
beaker or any other suitable transparent container (separation chamber) to a
depth of less than 1 centimeter. A strip of filter paper (aka "wick") is put into
the chamber so that its bottomtouches the solvent and the paper lies on the
chamber wall and reaches almost to the top of the container. The container is
closed with a cover glass or any other lid and is left for a few minutes to let
the solvent vapors ascend the filter paper and saturate the air in the chamber.
 The TLC plate is then placed in the chamber so that the spot(s)of the sample
do not touch the surface of the eluent in the chamber, and the lid is closed.
The solvent moves up the plate by capillary action, meets the sample
mixture and carries it up the plate (elutes the sample). The plate should be
removed from the chamber before the solvent front reaches the top of the
stationary phase (continuation of the elution will give a misleading result)
and dried.
 Without delay, the solvent front, the furthest extent of solvent up the plate, is
marked.
The plate is visualized. As some plates are pre-coated with a phosphorsuchas zinc
sulfide, allowing many compounds to be visualized by using ultraviolet light; dark
spots appear where the compounds blockthe UV light from striking the plate.
Alternatively, plates can be sprayed or immersed in chemicals after elution.
Various visualizing agents react with the spots to producevisible results.
Separation Process and Principle
Different compounds in the sample mixture travel at different rates due to the
differences in their attraction to the stationary phase and becauseof differences in
solubility in the solvent. By changing the solvent, or perhaps using a mixture, the
separation of components (measured by the Rf value) can be adjusted. Also, the
separation achieved with a TLC plate can be used to estimate the separation of a
flash chromatography column. (A compound elutes from a column when the
amount of solvent collected is equal to 1/Rf. Chemists often use TLC to develop a
protocolfor separation by chromatography and they use TLC to determine which
fractions contain the desired compounds. Separation of compounds is based on the
competition of the solute and the mobile phase for binding sites on the stationary
phase.[3] Forinstance, if normal-phase silica gel is used as the stationary phase, it
can be considered polar. Given two compounds that differ in polarity, the more
polar compound has a stronger interaction with the silica and is, therefore, better
able to displace the mobile phase from the available binding sites. As a
consequence, the less polar compound moves higher up the plate (resulting in a
higher Rf value). If the mobile phase is changed to a more polar solvent or mixture
of solvents, it becomes better at binding to the polar plate and therefore displacing
solutes from it, so all compounds onthe TLC plate will move higher up the plate.
It is commonly said that "strong" solvents (eluents) push the analyzed compounds
up the plate, whereas "weak" eluents barely move them. The order of
strength/weakness depends on the coating (stationary phase) of the TLC
plate. Forsilica gel-coated TLC plates, the eluent strength increases in the
following order perfluoroalkane (weakest), hexane, pentane, carbontetrachloride,
benzene/toluene, dichloromethane, diethyl ether, ethyl acetate, acetonitrile,
acetone, 2-propanol/n-butanol, water, methanol, triethylamine, acetic acid, formic
acid (strongest). For C18-coated plates the order is reverse. In other words, when
the stationary phase is polar and the mobile phase is non-polar, the method is
normal-phase as opposed to reverse-phase. This means that if a mixture of ethyl
acetate and hexane as the mobile phase is used, adding more ethyl acetate results
in higher Rf values for all compounds onthe TLC plate. Changing the polarity of
the mobile phase will normally not result in reversed order of running of the
compounds onthe TLC plate. An eluotropic series can be used as a guide in
selecting a mobile phase. If a reversed order of running of the compounds is
desired, a polar stationary phase should be used, such as C18-
functionalized silica.
Analysis
As the chemicals being separated may be colorless, several methods exist to
visualize the spots:
 fluorescent analytes like quinine may be detected under black light
(366 nm)
 Often a small amount of a fluorescent compound, usually
manganese-activated zinc silicate, is added to the adsorbent that
allows the visualization of spots under UV-C light (254 nm). The
adsorbentlayer will thus fluoresce light-green by itself, but spots of
analytic quench this fluorescence.
 Iodine vapors are a general unspecific color reagent
 Specific color reagents into which the TLC plate is dipped or which
are sprayed onto the plate exist. Potassium permanganate – oxidation
Bromine
 In the case of lipids, the chromatogram may be transferred to a
PVDF membrane and then subjected to further analysis,
Example mass spectrometry, a technique known as Far-Eastern blotting.
Once visible, the Rf value, or retardation factor, of each spotcan be determined by
dividing the distance the producttraveled by the distance the solvent front traveled
using the initial spotting site as reference. These values depend on the solvent used
and the type of TLC plate and are not physical constants.
Characterization
In organic chemistry, reactions are qualitatively monitored with TLC.
Spots sampled with a capillary tube are placed on the plate: a spotof starting
material, a spotfrom the reaction mixture, and a cross-spotwith both. A small (3
by 7 cm) TLC plate takes a couple of minutes to run.
The analysis is qualitative, and it will show if the starting material has
disappeared, i.e. the reaction is complete, if any producthas appeared, and how
many products are generated (although this might be underestimated due to co-
elution).
Unfortunately, TLCs from low-temperature reactions may give misleading
results, because the sample is warmed to room temperature in the capillary, which
can alter the reaction—the warmed sample analyzed by TLC is not the same as
what is in the low temperature flask. One such reaction is the DIBALH reduction
of ester to aldehyde.
In one study TLC has been applied in the screening of organic reactions,
for example in the fine-tuning of BINAP synthesis from 2-naphthol. In this
method, the alcohol and catalyst solution (for instance iron (III) chloride) are
placed separately on the baseline, then reacted, and then instantly analyzed. A
special application of TLC is in the characterization of radiolabeled compounds,
where it is used to determine radiochemical purity. The TLC sheet is visualized
using a sheet of photographic film or an instrument capable of measuring
radioactivity.
It may be visualized using other means as well. This method is much more
sensitive than the others and can be used to detect an extremely small amount of a
compound, provided that it carries a radioactive atom.
Isolation
Since different compounds will travel a different distance in the
stationary phase, chromatography can be used to isolate components of a mixture
for further analysis. The separated compounds each occupying a specific area on
the plate, they can be scraped off (along with the stationary phase particles) and
dissolved into an appropriate solvent. As an example, in the chromatography of an
extract of green plant material (for example spinach) shown in 7 stages of
development, Carotene elutes quickly and is only visible until step 2.
Chlorophyll A and B are halfway in the final step and lutein the first
compound staining yellow. Once the chromatography is over, the carotene can be
removed from the plate, extracted into a solvent and placed into a
spectrophotometer to determine its spectrum. The quantities extracted are small
and a technique such as column chromatography is preferred to separate larger
amounts.
Advantages of TLC
TLC is very simple to use and inexpensive. Undergraduates can be taught
this technique and apply its similar principles to other chromatographic techniques.
There are little materials needed for TLC (chamber, watch glass, capillary, plate,
solvent, pencil, and UV-light). Therefore, once the best solvent is found, it can be
applied to other techniques such as High performance liquid chromatography.
More than 1 compound can be separated on a TLC plate as long as the mobile
phase is preferred for each compound. The solvents for the TLC plate can be
changed easily and it is possible to use several different solvents depending on
your desired results. As stated earlier, TLC can be used to ensure purity of a
compound. It is very easy to check the purity using a UV-light. Identification of
most compounds canbe done simply by checking Rf literature values. You can
modify the chromatography conditions easily to increase the optimization for
resolution of a specific component.
Disadvantages of TLC
TLC plates do not have long stationary phases. Therefore, the length of
separation is limited compared to other chromatographic techniques. Also, the
detection limit is a lot higher. If you would need a lower detection limit, one would
have to use other chromatographic techniques. TLC operates as an open system, so
factors such as humidity and temperature can be consequences to the results of
your chromatogram.
Common Problems in TLC
There are common problems in TLC that should be avoided. Normally, these
problems can be solved or avoided if taught propertechniques.
 Over-large Spots:
Spotting sizes of your sample should be not be larger than 1-2 mm in
diameter. The component spots will never be larger than or smaller than
your sample origin spot. If you have an over-large spot, this could cause
overlapping of other component spots with similar Rf values on your TLC
plate. If overlapping occurs, it would prove difficult to resolve the different
components.
 Uneven Advance of Solvent Front:
Uneven advance of the mobile phase is a common problem encountered
in TLC. Consequences would be inaccurate Rf values due to the uneven
advance of sample origin spots. This uneven advance can be caused by a few
factors listed below.
1. No flat bottom.
When placing the TLC plate into the chamber, place the bottom of the
plate on the edge of the chamber (normally glass container (e.g. beaker)) and
lean the top of the plate along the other side of the chamber. Also, make sure
that the TLC plate is placed in the chamber evenly. Do not tilt the plate or sit
it at an angle.
2. Not enough solvent.
There should be enough solvent (depends on size of chamber) to travel
up the length of the TLC plate.
3. Plate is not cut evenly.
It is recommended that a ruler is used so that the plate is cut evenly.
Rarely, water is used as a solvent because it produces an uneven curve front
which is mainly accounted for by its surface tension.
 Streaking:
If the sample spotis too concentrated, the substancewill travel up the
stationary phase as a streak rather than a single separated spot. In other
words, the solvent cannot handle the concentrated sample and in result,
moves as much of the substanceas it can up the stationary phase. The
substancethat it cannot move is left behind. This can be eliminated by
diluting the sample solution. To ensure that you have enough solution, use a
short-wave UV light to see if the spotis visible (normally purple in color), as
stated earlier.
How To Run a TLC Plate
Step 1: Prepare the developing
container
The developing container for TLC can be a
specially designed chamber, a jar with a lid,
or a beaker with a watch glass on the top
(the latter is used in the undergrad labs at
CU). Poursolvent into the chamber to a
depth of just less than 0.5 cm. To aid in the
saturation of the TLC chamber with solvent
vapors, you can line part of the inside of the
beaker with filter paper. Cover the beaker
with a watch glass, swirl it gently, and allow it
to stand while you prepare your TLC plate.
Step 2: Prepare the TLC plate
TLC plates used in the organic chemistry teaching
labs are purchased as 5 cm x 20 cm sheets.
Each large sheet is cut horizontally into
plates which are 5 cm tall by various widths;
the more samples you plan to run on a plate,
the wider it needs to be. Shown in the photo
to the left is a box of TLC plates, a large uncut TLC sheet, and a small TLC
plate which
has been cut to a convenient size. Handle the
plates carefully so that you do not disturb the
coating of adsorbentor get them dirty.
Measure 0.5 cm from the bottom of the
plate. Using a pencil, draw a line across the
plate at the 0.5 cm mark. This is the origin:
the line on which you will spotthe plate.
Take care not to press so hard with the pencil
that you disturb the adsorbent. Under the
line, mark lightly the name of the samples
you will spoton the plate, or mark numbers
for time points. Leave enough spacebetween
the samples so that they do not run together;
about 4 samples on a 5 cm wide plate is
advised.
Step 3: Spot the TLC plate
If the sample is not already in solution,
dissolve about 1 mg in 1 mL of a volatile
solvent such as hexanes, ethyl acetate, or
methylene chloride. As a rule of thumb, a
concentration of 1% usually works well for
TLC analysis. If the sample is too
concentrated, it will run as a smear or streak
(see troubleshooting section below); if it is
not concentrated enough, you will see
nothing on the plate. Sometimes you will
need to use trial and error to get well-sized,
easy to read spots.
Obtain a a microcapillary. In the organic
teaching labs, we use 10µL microcaps - they
are easier to handle than the smaller ones
used in research labs. Dip the microcap into
the solution and then gently touch the end of
it onto the proper location on the TLC plate.
Don't allow the spotto become too large - if
necessary, you can touch it to the plate, lift it
off and blow on the spot. If you repeat these
steps, the wet area on the plate will stay
small.
This example plate has been spotted with
three different quantities of the same
solution and is ready to develop. If you are
unsure of how much sample to spot, you can
always spotmultiple quantities and see
which looks best.
Step 4: Develop the plate
Place the prepared TLC plate in the
developing beaker, cover the beaker with the
watch glass, and leave it undisturbed on your
bench top. The solvent will rise up the TLC
plate by capillary action. Make sure the
solvent does not cover the spot.
Allow the plate to develop until the solvent is
about half a centimeter below the top of the
plate. Remove the plate from the beaker and
immediately mark the solvent front with a
pencil. Allow the plate to dry.
Step 5: Visualize the spots
If there are any colored spots, circle them
lightly with a pencil. Most samples are not
colored and need to be visualized with a UV
lamp. Hold a UV lamp over the plate and
circle any spots you see. Beware! UV light is
damaging both to your eyes and to your skin!
Make sure you are wearing your goggles and
do not look directly into the lamp. Protect
your skin by wearing gloves.
If the TLC plate runs samples which are too
concentrated, the spots will be streaked
and/or run together. If this happens, you will
have to start over with a more dilute sample
to spotand run on a TLC plate.
Here's what overloaded plates look like
compared to well-spotted plates. The plate
on the left has a large yellow smear; this
smear contains the same two compounds
which are nicely resolved on the plate next to
it.
TLC Solvents Choice
When you need to determine the best solvent or mixture of solvents (a
"solvent system") to develop a TLC plate or chromatography column loaded
with an unknown mixture, vary the polarity of the solvent in several trial
runs: a process oftrial and error.
Carefully observe and record the results of the chromatography in
each solvent system. You will find that as you increase the polarity of the
solvent system, all the components of the mixture move faster (and vice
versa with lowering the polarity). The ideal solvent system is simply the
system that gives the best separation. TLC elution patterns usually carry
over to column chromatography elution patterns. Since TLC is a much faster
procedurethan column chromatography, TLC is often used to determine the
best solvent system for column chromatography.
For instance, in determining the solvent system for a flash
chromatography procedure, the ideal system is the one that moves the
desired componentof the mixture to a TLC Rf of 0.25-0.35 and will separate
this componentfrom its nearest neighbor by difference in TLC Rf values of
at least 0.20.
Therefore a mixture is analyzed by TLC to determine the ideal
solvent(s) for a flash chromatography procedure. Beginners often do not
know where to start:
What solvents should they pull off the shelf to use to elute a TLC
plate? Because of toxicity, cost, and flammability concerns, the common
solvents are hexanes (or petroleum ethers/ligroin) and ethyl acetate (an
ester). Diethyl ether can be used, but it is very flammable and volatile.
Alcohols (methanol, ethanol) can be used. Acetic acid (a carboxylic acid)
can be used, usually as a small percentage component of the system, since it
is corrosive, non-volatile, very polar, and has irritating vapors. Acetone (a
ketone) can be used. Methylene chloride or and chloroform (halogenated
hydrocarbons)are good solvents, but are toxic and should be avoided
whenever possible.
If two solvents are equal in performance and toxicity, the more
volatile solvent is preferred in chromatography because it will be easier to
remove from the desired compound after isolation from a column
chromatography procedure. Ask the lab instructor what solvents are
available and advisable. Then, mix a non-polar solvent (hexanes, a mixture
of 6-carbon alkanes) with a polar solvent (ethyl acetate or acetone) in
varying percent combinations to make solvent systems of greater and lesser
polarity.
Interactions Between the Compound and the Adsorbent
The strength with which an organic compound binds to an
adsorbentdepends on the strength of the following types of interactions: ion-
dipole, dipole-dipole, hydrogen bonding, dipole induced dipole, and van der
Waals forces. With silica gel, the dominant interactive forces between the
adsorbentand the materials to be separated are of the dipole-dipole type.
Highly polar molecules interact fairly strongly with the polar SiOH groups at
the surface of these adsorbents, and will tend to stick or adsorb onto the fine
particles of the adsorbentwhile weakly polar molecules are held less tightly.
Weakly polar molecules generally tend to move through the adsorbentmore
rapidly than the polar species. Roughly, the compounds follow the elution
order given above.
The Rf value
The retention factor, or Rf, is defined as the distance traveled by the
compound divided by the distance traveled by the solvent. Forexample, if a
compound travels 2.1 cm and the solvent front travels 2.8 cm, the Rf is 0.75:
The Rf for a compound is a constant from one experiment to the next only if
the chromatography conditions below are also constant:
 solvent system
 adsorbent
 thickness of the adsorbent
 amount of material spotted
 temperature
Since these factors are difficult to keep constant from experiment to
experiment, relative Rf values are generally considered. "Relative Rf" means
that the values are reported relative to a standard, or it means that you
compare the Rf values of compounds run on the same plate at the same time.
The larger an Rf of a compound, the larger the distance it travels on
the TLC plate. When comparing two different compounds run under
identical chromatography conditions, the compound with the larger Rf is less
polar because it interacts less strongly with the polar adsorbenton the TLC
plate. Conversely, if you know the structures of the compounds in a mixture,
you can predict that a compound of low polarity will have a larger Rf value
than a polar compound run on the same plate.
The Rf can provide corroborative evidence as to the identity of a
compound. If the identity of a compound is suspected but not yet proven, an
authentic sample of the compound, or standard, is spotted and run on a TLC
plate side by side (or on top of each other) with the compound in question. If
two substances have the same Rf value, they are likely (but not necessarily)
the same compound. If they have different Rf values, they are definitely
different compounds. Notethat this identity check must be performed on a
single plate, because it is difficult to duplicate all the factors which influence
Rf exactly from experiment to experiment.
Troubleshooting TLC
All of the above (including the procedurepage) might sound like
TLC is quite an easy procedure. But what about the first time you run a
TLC, and see spots everywhere and blurred, streaked spots?As with any
technique, with practice you get better. Examples of common problems
encountered in TLC:
 The compound runs as a streak rather than a spot:
The sample was overloaded. Run the TLC again after diluting your
sample. Or, your sample might just contain many components, creating
many spots which run together and appear as a streak. Perhaps,
the experiment did not go as well as expected.
 The sample runs as a smear or a upward crescent:
Compounds which possessstrongly acidic or basic groups (amines or
carboxylic acids) sometimes show up on a TLC plate with this behavior.
Add a few drops of ammonium hydroxide (amines) or acetic acid
(carboxylic acids) to the eluting solvent to obtain clearer plates.
 The sample runs as a downward crescent:
Likely, the adsorbent was disturbed during the spotting, causing the
crescent shape.
 The plate solvent front runs crookedly:
Either the adsorbent has flaked off the sides of the plate or the sides of
the plate are touching the sides of the container (or the paper used to saturate
the container) as the plate develops. Crooked plates make it harder to
measure Rf values accurately.
 Many random spots are seen on the plate:
Make sure that you do not accidentally drop any organic compound on
the plate. If get a TLC plate and leave it laying on your workbench as you do
the experiment, you might drop or splash an organic compound on the plate.
 No spots are seen on the plate:
You might not have spotted enough compound, perhaps because the
solution of the compound is too dilute. Try concentrating the solution, or
spotit several times in one place, allowing the solvent to dry between
applications. Some compounds do notshow up under UV light; try another
method of visualizing the plate (such as staining or exposing to iodine
vapor). Or, perhaps you do not have any compound becauseyour experiment
did not go as well as planned.
If the solvent level in the developing jar is deeper than the origin
(spotting line) of the TLC plate, the solvent will dissolve the compounds into
the solvent reservoir instead of allowing them to move up the plate by
capillary action. Thus, you will not see spots after the plate is developed.
These photos show how the yellow compound is running into the solvent
when lifted from the developing jar.

Más contenido relacionado

La actualidad más candente

Thin layer chromatography (tlc)
Thin layer chromatography (tlc)Thin layer chromatography (tlc)
Thin layer chromatography (tlc)Dr.M.Prasad Naidu
 
Thin Layer Chromatography and HighPerformance Thin Layer chromatography
Thin Layer Chromatography and HighPerformance Thin Layer chromatographyThin Layer Chromatography and HighPerformance Thin Layer chromatography
Thin Layer Chromatography and HighPerformance Thin Layer chromatographyNani Karnam Vinayakam
 
Mobile phase in chromatography
Mobile phase in chromatographyMobile phase in chromatography
Mobile phase in chromatographyJabir Jabir
 
Thin Layer Chromatography
Thin Layer ChromatographyThin Layer Chromatography
Thin Layer ChromatographyPranesh Kumar
 
Sna thin layer chromatography
Sna thin layer chromatographySna thin layer chromatography
Sna thin layer chromatographyhome
 
Instrumentation of Thin Layer Chromatography
Instrumentation of Thin Layer ChromatographyInstrumentation of Thin Layer Chromatography
Instrumentation of Thin Layer ChromatographyTanmoy Sarkar
 
Introduction to RP-HPLC
Introduction to RP-HPLCIntroduction to RP-HPLC
Introduction to RP-HPLCKarthi Kumar
 
Thin layer Chromatography (TLC)
Thin layer Chromatography (TLC)Thin layer Chromatography (TLC)
Thin layer Chromatography (TLC)GOKULAKRISHNAN S
 
TLC, thin layer chromatography
TLC, thin layer chromatographyTLC, thin layer chromatography
TLC, thin layer chromatographyshaisejacob
 
High performance liquid chromatography (HPLC)
High performance liquid chromatography (HPLC)High performance liquid chromatography (HPLC)
High performance liquid chromatography (HPLC)Htet Wai Moe
 
an assignment on thin layer chromatography
an assignment on thin layer chromatographyan assignment on thin layer chromatography
an assignment on thin layer chromatographyFaruk Hossen
 
Column Chromatography ppt
Column Chromatography pptColumn Chromatography ppt
Column Chromatography pptshaisejacob
 
Paper chromatography9hina)
Paper chromatography9hina)Paper chromatography9hina)
Paper chromatography9hina)hina1rasheed
 

La actualidad más candente (20)

Gas chromatography
Gas chromatographyGas chromatography
Gas chromatography
 
Thin layer chromatography (tlc)
Thin layer chromatography (tlc)Thin layer chromatography (tlc)
Thin layer chromatography (tlc)
 
Paper chromatography and types
Paper chromatography and typesPaper chromatography and types
Paper chromatography and types
 
Thin Layer Chromatography and HighPerformance Thin Layer chromatography
Thin Layer Chromatography and HighPerformance Thin Layer chromatographyThin Layer Chromatography and HighPerformance Thin Layer chromatography
Thin Layer Chromatography and HighPerformance Thin Layer chromatography
 
Mobile phase in chromatography
Mobile phase in chromatographyMobile phase in chromatography
Mobile phase in chromatography
 
Thin Layer Chromatography
Thin Layer ChromatographyThin Layer Chromatography
Thin Layer Chromatography
 
Planar Chromatography
Planar ChromatographyPlanar Chromatography
Planar Chromatography
 
Sna thin layer chromatography
Sna thin layer chromatographySna thin layer chromatography
Sna thin layer chromatography
 
Instrumentation of Thin Layer Chromatography
Instrumentation of Thin Layer ChromatographyInstrumentation of Thin Layer Chromatography
Instrumentation of Thin Layer Chromatography
 
Chromatography
ChromatographyChromatography
Chromatography
 
Introduction to RP-HPLC
Introduction to RP-HPLCIntroduction to RP-HPLC
Introduction to RP-HPLC
 
Thin layer Chromatography (TLC)
Thin layer Chromatography (TLC)Thin layer Chromatography (TLC)
Thin layer Chromatography (TLC)
 
Thin layer chromatography
Thin layer chromatographyThin layer chromatography
Thin layer chromatography
 
TLC, thin layer chromatography
TLC, thin layer chromatographyTLC, thin layer chromatography
TLC, thin layer chromatography
 
High performance liquid chromatography (HPLC)
High performance liquid chromatography (HPLC)High performance liquid chromatography (HPLC)
High performance liquid chromatography (HPLC)
 
an assignment on thin layer chromatography
an assignment on thin layer chromatographyan assignment on thin layer chromatography
an assignment on thin layer chromatography
 
Column Chromatography ppt
Column Chromatography pptColumn Chromatography ppt
Column Chromatography ppt
 
gas chromatography
gas chromatographygas chromatography
gas chromatography
 
Paper chromatography
Paper chromatographyPaper chromatography
Paper chromatography
 
Paper chromatography9hina)
Paper chromatography9hina)Paper chromatography9hina)
Paper chromatography9hina)
 

Similar a Thin layer chromatography Assignment

3. Thin Layer CHROMATOGRAPHY Bio Techniques.pptx
3. Thin Layer CHROMATOGRAPHY Bio Techniques.pptx3. Thin Layer CHROMATOGRAPHY Bio Techniques.pptx
3. Thin Layer CHROMATOGRAPHY Bio Techniques.pptxMehruMaher
 
chromatography
chromatographychromatography
chromatographyLokeshP38
 
Thin Layer Chromatography.ppt
Thin Layer Chromatography.pptThin Layer Chromatography.ppt
Thin Layer Chromatography.pptsmritisahu11
 
Tlc(thin layer chromatography )
Tlc(thin layer chromatography )Tlc(thin layer chromatography )
Tlc(thin layer chromatography )Hafiz M Waseem
 
Chromatography (paper chromatography and tlc)
Chromatography (paper chromatography and tlc)Chromatography (paper chromatography and tlc)
Chromatography (paper chromatography and tlc)Sidra Shaffique
 
Thin layer chromatography
Thin layer chromatographyThin layer chromatography
Thin layer chromatographyKamal Rawat
 
CHROMATOGRAPHY AND ITS TYPES
CHROMATOGRAPHY AND ITS TYPESCHROMATOGRAPHY AND ITS TYPES
CHROMATOGRAPHY AND ITS TYPESJayeshRajput7
 
High performance thin layer chromatography(HPTLC)
High performance thin layer chromatography(HPTLC)High performance thin layer chromatography(HPTLC)
High performance thin layer chromatography(HPTLC)GOPAL KUMBHANI
 
Thin layer chromatography.pptx [Autosaved].pptx
Thin layer chromatography.pptx [Autosaved].pptxThin layer chromatography.pptx [Autosaved].pptx
Thin layer chromatography.pptx [Autosaved].pptxabhijeetpadhi001
 
tlc presentation.pptx
tlc presentation.pptxtlc presentation.pptx
tlc presentation.pptxRameenWaseem2
 
Thin layer chromatography by khaleel S.G
Thin layer chromatography by khaleel S.GThin layer chromatography by khaleel S.G
Thin layer chromatography by khaleel S.GKhaleel Basha
 
Chromatography and its types
Chromatography and its typesChromatography and its types
Chromatography and its typesMasoom Shani
 
Thin layer chromatography ( Horizontal)
Thin layer chromatography  ( Horizontal)Thin layer chromatography  ( Horizontal)
Thin layer chromatography ( Horizontal)Poonam Aher Patil
 

Similar a Thin layer chromatography Assignment (20)

Chromatography
ChromatographyChromatography
Chromatography
 
3. Thin Layer CHROMATOGRAPHY Bio Techniques.pptx
3. Thin Layer CHROMATOGRAPHY Bio Techniques.pptx3. Thin Layer CHROMATOGRAPHY Bio Techniques.pptx
3. Thin Layer CHROMATOGRAPHY Bio Techniques.pptx
 
Chromatography Part-II
Chromatography Part-IIChromatography Part-II
Chromatography Part-II
 
chromatography
chromatographychromatography
chromatography
 
Thin Layer Chromatography.ppt
Thin Layer Chromatography.pptThin Layer Chromatography.ppt
Thin Layer Chromatography.ppt
 
Tlc
TlcTlc
Tlc
 
Tlc(thin layer chromatography )
Tlc(thin layer chromatography )Tlc(thin layer chromatography )
Tlc(thin layer chromatography )
 
Chromatography (paper chromatography and tlc)
Chromatography (paper chromatography and tlc)Chromatography (paper chromatography and tlc)
Chromatography (paper chromatography and tlc)
 
Thin layer chromatography
Thin layer chromatographyThin layer chromatography
Thin layer chromatography
 
CHROMATOGRAPHY AND ITS TYPES
CHROMATOGRAPHY AND ITS TYPESCHROMATOGRAPHY AND ITS TYPES
CHROMATOGRAPHY AND ITS TYPES
 
High performance thin layer chromatography(HPTLC)
High performance thin layer chromatography(HPTLC)High performance thin layer chromatography(HPTLC)
High performance thin layer chromatography(HPTLC)
 
Thin layer chromatography.pptx [Autosaved].pptx
Thin layer chromatography.pptx [Autosaved].pptxThin layer chromatography.pptx [Autosaved].pptx
Thin layer chromatography.pptx [Autosaved].pptx
 
tlc presentation.pptx
tlc presentation.pptxtlc presentation.pptx
tlc presentation.pptx
 
Thin Layer Chromatography
Thin Layer ChromatographyThin Layer Chromatography
Thin Layer Chromatography
 
Thin layer chromatography by khaleel S.G
Thin layer chromatography by khaleel S.GThin layer chromatography by khaleel S.G
Thin layer chromatography by khaleel S.G
 
Chromatography
ChromatographyChromatography
Chromatography
 
Chromatography and its types
Chromatography and its typesChromatography and its types
Chromatography and its types
 
Chromatography
ChromatographyChromatography
Chromatography
 
HPTLC.pptx
HPTLC.pptxHPTLC.pptx
HPTLC.pptx
 
Thin layer chromatography ( Horizontal)
Thin layer chromatography  ( Horizontal)Thin layer chromatography  ( Horizontal)
Thin layer chromatography ( Horizontal)
 

Último

❤Jammu Kashmir Call Girls 8617697112 Personal Whatsapp Number 💦✅.
❤Jammu Kashmir Call Girls 8617697112 Personal Whatsapp Number 💦✅.❤Jammu Kashmir Call Girls 8617697112 Personal Whatsapp Number 💦✅.
❤Jammu Kashmir Call Girls 8617697112 Personal Whatsapp Number 💦✅.Nitya salvi
 
Hire 💕 9907093804 Hooghly Call Girls Service Call Girls Agency
Hire 💕 9907093804 Hooghly Call Girls Service Call Girls AgencyHire 💕 9907093804 Hooghly Call Girls Service Call Girls Agency
Hire 💕 9907093804 Hooghly Call Girls Service Call Girls AgencySheetal Arora
 
FAIRSpectra - Enabling the FAIRification of Spectroscopy and Spectrometry
FAIRSpectra - Enabling the FAIRification of Spectroscopy and SpectrometryFAIRSpectra - Enabling the FAIRification of Spectroscopy and Spectrometry
FAIRSpectra - Enabling the FAIRification of Spectroscopy and SpectrometryAlex Henderson
 
Chemical Tests; flame test, positive and negative ions test Edexcel Internati...
Chemical Tests; flame test, positive and negative ions test Edexcel Internati...Chemical Tests; flame test, positive and negative ions test Edexcel Internati...
Chemical Tests; flame test, positive and negative ions test Edexcel Internati...ssuser79fe74
 
Botany 4th semester series (krishna).pdf
Botany 4th semester series (krishna).pdfBotany 4th semester series (krishna).pdf
Botany 4th semester series (krishna).pdfSumit Kumar yadav
 
Kochi ❤CALL GIRL 84099*07087 ❤CALL GIRLS IN Kochi ESCORT SERVICE❤CALL GIRL
Kochi ❤CALL GIRL 84099*07087 ❤CALL GIRLS IN Kochi ESCORT SERVICE❤CALL GIRLKochi ❤CALL GIRL 84099*07087 ❤CALL GIRLS IN Kochi ESCORT SERVICE❤CALL GIRL
Kochi ❤CALL GIRL 84099*07087 ❤CALL GIRLS IN Kochi ESCORT SERVICE❤CALL GIRLkantirani197
 
Pests of mustard_Identification_Management_Dr.UPR.pdf
Pests of mustard_Identification_Management_Dr.UPR.pdfPests of mustard_Identification_Management_Dr.UPR.pdf
Pests of mustard_Identification_Management_Dr.UPR.pdfPirithiRaju
 
GUIDELINES ON SIMILAR BIOLOGICS Regulatory Requirements for Marketing Authori...
GUIDELINES ON SIMILAR BIOLOGICS Regulatory Requirements for Marketing Authori...GUIDELINES ON SIMILAR BIOLOGICS Regulatory Requirements for Marketing Authori...
GUIDELINES ON SIMILAR BIOLOGICS Regulatory Requirements for Marketing Authori...Lokesh Kothari
 
9654467111 Call Girls In Raj Nagar Delhi Short 1500 Night 6000
9654467111 Call Girls In Raj Nagar Delhi Short 1500 Night 60009654467111 Call Girls In Raj Nagar Delhi Short 1500 Night 6000
9654467111 Call Girls In Raj Nagar Delhi Short 1500 Night 6000Sapana Sha
 
Seismic Method Estimate velocity from seismic data.pptx
Seismic Method Estimate velocity from seismic  data.pptxSeismic Method Estimate velocity from seismic  data.pptx
Seismic Method Estimate velocity from seismic data.pptxAlMamun560346
 
Formation of low mass protostars and their circumstellar disks
Formation of low mass protostars and their circumstellar disksFormation of low mass protostars and their circumstellar disks
Formation of low mass protostars and their circumstellar disksSérgio Sacani
 
Bacterial Identification and Classifications
Bacterial Identification and ClassificationsBacterial Identification and Classifications
Bacterial Identification and ClassificationsAreesha Ahmad
 
Conjugation, transduction and transformation
Conjugation, transduction and transformationConjugation, transduction and transformation
Conjugation, transduction and transformationAreesha Ahmad
 
Forensic Biology & Its biological significance.pdf
Forensic Biology & Its biological significance.pdfForensic Biology & Its biological significance.pdf
Forensic Biology & Its biological significance.pdfrohankumarsinghrore1
 
Justdial Call Girls In Indirapuram, Ghaziabad, 8800357707 Escorts Service
Justdial Call Girls In Indirapuram, Ghaziabad, 8800357707 Escorts ServiceJustdial Call Girls In Indirapuram, Ghaziabad, 8800357707 Escorts Service
Justdial Call Girls In Indirapuram, Ghaziabad, 8800357707 Escorts Servicemonikaservice1
 
American Type Culture Collection (ATCC).pptx
American Type Culture Collection (ATCC).pptxAmerican Type Culture Collection (ATCC).pptx
American Type Culture Collection (ATCC).pptxabhishekdhamu51
 
Asymmetry in the atmosphere of the ultra-hot Jupiter WASP-76 b
Asymmetry in the atmosphere of the ultra-hot Jupiter WASP-76 bAsymmetry in the atmosphere of the ultra-hot Jupiter WASP-76 b
Asymmetry in the atmosphere of the ultra-hot Jupiter WASP-76 bSérgio Sacani
 
Presentation Vikram Lander by Vedansh Gupta.pptx
Presentation Vikram Lander by Vedansh Gupta.pptxPresentation Vikram Lander by Vedansh Gupta.pptx
Presentation Vikram Lander by Vedansh Gupta.pptxgindu3009
 
Nightside clouds and disequilibrium chemistry on the hot Jupiter WASP-43b
Nightside clouds and disequilibrium chemistry on the hot Jupiter WASP-43bNightside clouds and disequilibrium chemistry on the hot Jupiter WASP-43b
Nightside clouds and disequilibrium chemistry on the hot Jupiter WASP-43bSérgio Sacani
 

Último (20)

❤Jammu Kashmir Call Girls 8617697112 Personal Whatsapp Number 💦✅.
❤Jammu Kashmir Call Girls 8617697112 Personal Whatsapp Number 💦✅.❤Jammu Kashmir Call Girls 8617697112 Personal Whatsapp Number 💦✅.
❤Jammu Kashmir Call Girls 8617697112 Personal Whatsapp Number 💦✅.
 
Hire 💕 9907093804 Hooghly Call Girls Service Call Girls Agency
Hire 💕 9907093804 Hooghly Call Girls Service Call Girls AgencyHire 💕 9907093804 Hooghly Call Girls Service Call Girls Agency
Hire 💕 9907093804 Hooghly Call Girls Service Call Girls Agency
 
FAIRSpectra - Enabling the FAIRification of Spectroscopy and Spectrometry
FAIRSpectra - Enabling the FAIRification of Spectroscopy and SpectrometryFAIRSpectra - Enabling the FAIRification of Spectroscopy and Spectrometry
FAIRSpectra - Enabling the FAIRification of Spectroscopy and Spectrometry
 
Chemical Tests; flame test, positive and negative ions test Edexcel Internati...
Chemical Tests; flame test, positive and negative ions test Edexcel Internati...Chemical Tests; flame test, positive and negative ions test Edexcel Internati...
Chemical Tests; flame test, positive and negative ions test Edexcel Internati...
 
Botany 4th semester series (krishna).pdf
Botany 4th semester series (krishna).pdfBotany 4th semester series (krishna).pdf
Botany 4th semester series (krishna).pdf
 
Kochi ❤CALL GIRL 84099*07087 ❤CALL GIRLS IN Kochi ESCORT SERVICE❤CALL GIRL
Kochi ❤CALL GIRL 84099*07087 ❤CALL GIRLS IN Kochi ESCORT SERVICE❤CALL GIRLKochi ❤CALL GIRL 84099*07087 ❤CALL GIRLS IN Kochi ESCORT SERVICE❤CALL GIRL
Kochi ❤CALL GIRL 84099*07087 ❤CALL GIRLS IN Kochi ESCORT SERVICE❤CALL GIRL
 
Pests of mustard_Identification_Management_Dr.UPR.pdf
Pests of mustard_Identification_Management_Dr.UPR.pdfPests of mustard_Identification_Management_Dr.UPR.pdf
Pests of mustard_Identification_Management_Dr.UPR.pdf
 
GUIDELINES ON SIMILAR BIOLOGICS Regulatory Requirements for Marketing Authori...
GUIDELINES ON SIMILAR BIOLOGICS Regulatory Requirements for Marketing Authori...GUIDELINES ON SIMILAR BIOLOGICS Regulatory Requirements for Marketing Authori...
GUIDELINES ON SIMILAR BIOLOGICS Regulatory Requirements for Marketing Authori...
 
9654467111 Call Girls In Raj Nagar Delhi Short 1500 Night 6000
9654467111 Call Girls In Raj Nagar Delhi Short 1500 Night 60009654467111 Call Girls In Raj Nagar Delhi Short 1500 Night 6000
9654467111 Call Girls In Raj Nagar Delhi Short 1500 Night 6000
 
Seismic Method Estimate velocity from seismic data.pptx
Seismic Method Estimate velocity from seismic  data.pptxSeismic Method Estimate velocity from seismic  data.pptx
Seismic Method Estimate velocity from seismic data.pptx
 
Formation of low mass protostars and their circumstellar disks
Formation of low mass protostars and their circumstellar disksFormation of low mass protostars and their circumstellar disks
Formation of low mass protostars and their circumstellar disks
 
Bacterial Identification and Classifications
Bacterial Identification and ClassificationsBacterial Identification and Classifications
Bacterial Identification and Classifications
 
Conjugation, transduction and transformation
Conjugation, transduction and transformationConjugation, transduction and transformation
Conjugation, transduction and transformation
 
Clean In Place(CIP).pptx .
Clean In Place(CIP).pptx                 .Clean In Place(CIP).pptx                 .
Clean In Place(CIP).pptx .
 
Forensic Biology & Its biological significance.pdf
Forensic Biology & Its biological significance.pdfForensic Biology & Its biological significance.pdf
Forensic Biology & Its biological significance.pdf
 
Justdial Call Girls In Indirapuram, Ghaziabad, 8800357707 Escorts Service
Justdial Call Girls In Indirapuram, Ghaziabad, 8800357707 Escorts ServiceJustdial Call Girls In Indirapuram, Ghaziabad, 8800357707 Escorts Service
Justdial Call Girls In Indirapuram, Ghaziabad, 8800357707 Escorts Service
 
American Type Culture Collection (ATCC).pptx
American Type Culture Collection (ATCC).pptxAmerican Type Culture Collection (ATCC).pptx
American Type Culture Collection (ATCC).pptx
 
Asymmetry in the atmosphere of the ultra-hot Jupiter WASP-76 b
Asymmetry in the atmosphere of the ultra-hot Jupiter WASP-76 bAsymmetry in the atmosphere of the ultra-hot Jupiter WASP-76 b
Asymmetry in the atmosphere of the ultra-hot Jupiter WASP-76 b
 
Presentation Vikram Lander by Vedansh Gupta.pptx
Presentation Vikram Lander by Vedansh Gupta.pptxPresentation Vikram Lander by Vedansh Gupta.pptx
Presentation Vikram Lander by Vedansh Gupta.pptx
 
Nightside clouds and disequilibrium chemistry on the hot Jupiter WASP-43b
Nightside clouds and disequilibrium chemistry on the hot Jupiter WASP-43bNightside clouds and disequilibrium chemistry on the hot Jupiter WASP-43b
Nightside clouds and disequilibrium chemistry on the hot Jupiter WASP-43b
 

Thin layer chromatography Assignment

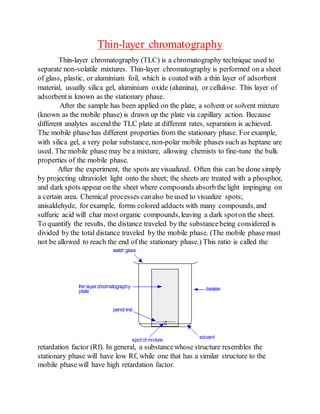
  • 1. Thin-layer chromatography Thin-layer chromatography (TLC) is a chromatography technique used to separate non-volatile mixtures. Thin-layer chromatography is performed on a sheet of glass, plastic, or aluminium foil, which is coated with a thin layer of adsorbent material, usually silica gel, aluminium oxide (alumina), or cellulose. This layer of adsorbentis known as the stationary phase. After the sample has been applied on the plate, a solvent or solvent mixture (known as the mobile phase) is drawn up the plate via capillary action. Because different analytes ascend the TLC plate at different rates, separation is achieved. The mobile phase has different properties from the stationary phase. For example, with silica gel, a very polar substance, non-polar mobile phases such as heptane are used. The mobile phase may be a mixture, allowing chemists to fine-tune the bulk properties of the mobile phase. After the experiment, the spots are visualized. Often this can be done simply by projecting ultraviolet light onto the sheet; the sheets are treated with a phosphor, and dark spots appear on the sheet where compounds absorb the light impinging on a certain area. Chemical processes canalso be used to visualize spots; anisaldehyde, for example, forms colored adducts with many compounds,and sulfuric acid will char most organic compounds,leaving a dark spoton the sheet. To quantify the results, the distance traveled by the substancebeing considered is divided by the total distance traveled by the mobile phase. (The mobile phase must not be allowed to reach the end of the stationary phase.) This ratio is called the retardation factor (Rf). In general, a substancewhose structure resembles the stationary phase will have low Rf, while one that has a similar structure to the mobile phase will have high retardation factor.
  • 2. Retardation factors are characteristic, but will change depending on the exact condition of the mobile and stationary phase. For this reason, chemists usually apply a sample of a known compound to the sheet before running the experiment. Thin-layer chromatography can be used to monitor the progress of a reaction, identify compounds present in a given mixture, and determine the purity of a substance. Specific examples of these applications include: analyzing ceramides and fatty acids, detection of pesticides or insecticides in food and water, analyzing the dye composition of fibers in forensics, as saying the radiochemical purity of radiopharmaceuticals, or identification of medicinal plants and their constituents. A number of enhancements can be made to the original method to automate the different steps, to increase the resolution achieved with TLC and to allow more accurate quantitative analysis. This method is referred to as HPTLC, or "high-performance TLC". HPTLC typically uses thinner layers of stationary phase and smaller sample volumes, thus reducing the loss of resolution due to diffusion. Contents  Plate preparation  Technique Separation Process and Principle  Analysis  Applications Characterization Isolation Plate preparation TLC plates are usually commercially available, with standard particle size ranges to improve reproducibility. They are prepared by mixing the adsorbent, such as silica gel, with a small amount of inert binder like calcium sulfate (gypsum) and water. This mixture is spread as a thick slurry on an unreactive carrier sheet, usually glass, thick aluminum foil, or plastic. The resultant plate is dried and activated by heating in an oven for thirty minutes at 110 °C. The thickness of the absorbentlayer is typically around 0.1 – 0.25 mm for analytical
  • 3. purposes and around 0.5 – 2.0 mm for preparative TLC. Technique The process is similar to paper chromatography with the advantage of faster runs, better separations, and the choice between different stationary phases. Because of its simplicity and speed TLC is often used for monitoring chemical reactions and for the qualitative analysis of reaction products. Plates can be labeled before or after the chromatography process using a pencil or other implement that will not interfere or react with the process. To run a thin layer chromatography plate, the following procedure is carried out,  Using a capillary, a small spotof solution containing the sample is applied to a plate, about 1.5 centimeters from the bottom edge. The solvent is allowed to completely evaporate off to prevent it from interfering with sample's interactions with the mobile phase in the next step. If a non-volatile solvent was used to apply the sample, the plate needs to be dried in a vacuum chamber. This step is often repeated to ensure there is enough analyte at the starting spoton the plate to obtain a visible result. Different samples can be
  • 4. placed in a row of spots the same distance from the bottom edge, each of which will move in its own adjacent lane from its own starting point.  A small amount of an appropriate solvent (eluent) is poured into a glass beaker or any other suitable transparent container (separation chamber) to a depth of less than 1 centimeter. A strip of filter paper (aka "wick") is put into the chamber so that its bottomtouches the solvent and the paper lies on the chamber wall and reaches almost to the top of the container. The container is closed with a cover glass or any other lid and is left for a few minutes to let the solvent vapors ascend the filter paper and saturate the air in the chamber.  The TLC plate is then placed in the chamber so that the spot(s)of the sample do not touch the surface of the eluent in the chamber, and the lid is closed. The solvent moves up the plate by capillary action, meets the sample mixture and carries it up the plate (elutes the sample). The plate should be removed from the chamber before the solvent front reaches the top of the stationary phase (continuation of the elution will give a misleading result) and dried.  Without delay, the solvent front, the furthest extent of solvent up the plate, is marked. The plate is visualized. As some plates are pre-coated with a phosphorsuchas zinc sulfide, allowing many compounds to be visualized by using ultraviolet light; dark spots appear where the compounds blockthe UV light from striking the plate. Alternatively, plates can be sprayed or immersed in chemicals after elution. Various visualizing agents react with the spots to producevisible results. Separation Process and Principle Different compounds in the sample mixture travel at different rates due to the differences in their attraction to the stationary phase and becauseof differences in solubility in the solvent. By changing the solvent, or perhaps using a mixture, the separation of components (measured by the Rf value) can be adjusted. Also, the separation achieved with a TLC plate can be used to estimate the separation of a flash chromatography column. (A compound elutes from a column when the amount of solvent collected is equal to 1/Rf. Chemists often use TLC to develop a protocolfor separation by chromatography and they use TLC to determine which fractions contain the desired compounds. Separation of compounds is based on the
  • 5. competition of the solute and the mobile phase for binding sites on the stationary phase.[3] Forinstance, if normal-phase silica gel is used as the stationary phase, it can be considered polar. Given two compounds that differ in polarity, the more polar compound has a stronger interaction with the silica and is, therefore, better able to displace the mobile phase from the available binding sites. As a consequence, the less polar compound moves higher up the plate (resulting in a higher Rf value). If the mobile phase is changed to a more polar solvent or mixture of solvents, it becomes better at binding to the polar plate and therefore displacing solutes from it, so all compounds onthe TLC plate will move higher up the plate. It is commonly said that "strong" solvents (eluents) push the analyzed compounds up the plate, whereas "weak" eluents barely move them. The order of strength/weakness depends on the coating (stationary phase) of the TLC plate. Forsilica gel-coated TLC plates, the eluent strength increases in the following order perfluoroalkane (weakest), hexane, pentane, carbontetrachloride, benzene/toluene, dichloromethane, diethyl ether, ethyl acetate, acetonitrile, acetone, 2-propanol/n-butanol, water, methanol, triethylamine, acetic acid, formic acid (strongest). For C18-coated plates the order is reverse. In other words, when the stationary phase is polar and the mobile phase is non-polar, the method is normal-phase as opposed to reverse-phase. This means that if a mixture of ethyl acetate and hexane as the mobile phase is used, adding more ethyl acetate results in higher Rf values for all compounds onthe TLC plate. Changing the polarity of the mobile phase will normally not result in reversed order of running of the compounds onthe TLC plate. An eluotropic series can be used as a guide in selecting a mobile phase. If a reversed order of running of the compounds is desired, a polar stationary phase should be used, such as C18- functionalized silica.
  • 6. Analysis As the chemicals being separated may be colorless, several methods exist to visualize the spots:  fluorescent analytes like quinine may be detected under black light (366 nm)  Often a small amount of a fluorescent compound, usually manganese-activated zinc silicate, is added to the adsorbent that allows the visualization of spots under UV-C light (254 nm). The adsorbentlayer will thus fluoresce light-green by itself, but spots of analytic quench this fluorescence.  Iodine vapors are a general unspecific color reagent  Specific color reagents into which the TLC plate is dipped or which are sprayed onto the plate exist. Potassium permanganate – oxidation Bromine  In the case of lipids, the chromatogram may be transferred to a PVDF membrane and then subjected to further analysis,
  • 7. Example mass spectrometry, a technique known as Far-Eastern blotting. Once visible, the Rf value, or retardation factor, of each spotcan be determined by dividing the distance the producttraveled by the distance the solvent front traveled using the initial spotting site as reference. These values depend on the solvent used and the type of TLC plate and are not physical constants. Characterization In organic chemistry, reactions are qualitatively monitored with TLC. Spots sampled with a capillary tube are placed on the plate: a spotof starting material, a spotfrom the reaction mixture, and a cross-spotwith both. A small (3 by 7 cm) TLC plate takes a couple of minutes to run. The analysis is qualitative, and it will show if the starting material has disappeared, i.e. the reaction is complete, if any producthas appeared, and how many products are generated (although this might be underestimated due to co- elution). Unfortunately, TLCs from low-temperature reactions may give misleading results, because the sample is warmed to room temperature in the capillary, which can alter the reaction—the warmed sample analyzed by TLC is not the same as what is in the low temperature flask. One such reaction is the DIBALH reduction of ester to aldehyde. In one study TLC has been applied in the screening of organic reactions, for example in the fine-tuning of BINAP synthesis from 2-naphthol. In this method, the alcohol and catalyst solution (for instance iron (III) chloride) are placed separately on the baseline, then reacted, and then instantly analyzed. A special application of TLC is in the characterization of radiolabeled compounds, where it is used to determine radiochemical purity. The TLC sheet is visualized using a sheet of photographic film or an instrument capable of measuring radioactivity. It may be visualized using other means as well. This method is much more sensitive than the others and can be used to detect an extremely small amount of a compound, provided that it carries a radioactive atom.
  • 8. Isolation Since different compounds will travel a different distance in the stationary phase, chromatography can be used to isolate components of a mixture for further analysis. The separated compounds each occupying a specific area on the plate, they can be scraped off (along with the stationary phase particles) and dissolved into an appropriate solvent. As an example, in the chromatography of an extract of green plant material (for example spinach) shown in 7 stages of development, Carotene elutes quickly and is only visible until step 2. Chlorophyll A and B are halfway in the final step and lutein the first compound staining yellow. Once the chromatography is over, the carotene can be removed from the plate, extracted into a solvent and placed into a spectrophotometer to determine its spectrum. The quantities extracted are small and a technique such as column chromatography is preferred to separate larger amounts.
  • 9. Advantages of TLC TLC is very simple to use and inexpensive. Undergraduates can be taught this technique and apply its similar principles to other chromatographic techniques. There are little materials needed for TLC (chamber, watch glass, capillary, plate, solvent, pencil, and UV-light). Therefore, once the best solvent is found, it can be applied to other techniques such as High performance liquid chromatography. More than 1 compound can be separated on a TLC plate as long as the mobile phase is preferred for each compound. The solvents for the TLC plate can be changed easily and it is possible to use several different solvents depending on your desired results. As stated earlier, TLC can be used to ensure purity of a compound. It is very easy to check the purity using a UV-light. Identification of most compounds canbe done simply by checking Rf literature values. You can modify the chromatography conditions easily to increase the optimization for resolution of a specific component. Disadvantages of TLC TLC plates do not have long stationary phases. Therefore, the length of separation is limited compared to other chromatographic techniques. Also, the detection limit is a lot higher. If you would need a lower detection limit, one would have to use other chromatographic techniques. TLC operates as an open system, so factors such as humidity and temperature can be consequences to the results of your chromatogram. Common Problems in TLC There are common problems in TLC that should be avoided. Normally, these problems can be solved or avoided if taught propertechniques.  Over-large Spots: Spotting sizes of your sample should be not be larger than 1-2 mm in diameter. The component spots will never be larger than or smaller than your sample origin spot. If you have an over-large spot, this could cause overlapping of other component spots with similar Rf values on your TLC plate. If overlapping occurs, it would prove difficult to resolve the different components.
  • 10.  Uneven Advance of Solvent Front: Uneven advance of the mobile phase is a common problem encountered in TLC. Consequences would be inaccurate Rf values due to the uneven advance of sample origin spots. This uneven advance can be caused by a few factors listed below. 1. No flat bottom. When placing the TLC plate into the chamber, place the bottom of the plate on the edge of the chamber (normally glass container (e.g. beaker)) and lean the top of the plate along the other side of the chamber. Also, make sure that the TLC plate is placed in the chamber evenly. Do not tilt the plate or sit it at an angle. 2. Not enough solvent. There should be enough solvent (depends on size of chamber) to travel up the length of the TLC plate. 3. Plate is not cut evenly. It is recommended that a ruler is used so that the plate is cut evenly. Rarely, water is used as a solvent because it produces an uneven curve front which is mainly accounted for by its surface tension.  Streaking: If the sample spotis too concentrated, the substancewill travel up the stationary phase as a streak rather than a single separated spot. In other words, the solvent cannot handle the concentrated sample and in result, moves as much of the substanceas it can up the stationary phase. The substancethat it cannot move is left behind. This can be eliminated by diluting the sample solution. To ensure that you have enough solution, use a short-wave UV light to see if the spotis visible (normally purple in color), as stated earlier.
  • 11. How To Run a TLC Plate Step 1: Prepare the developing container The developing container for TLC can be a specially designed chamber, a jar with a lid, or a beaker with a watch glass on the top (the latter is used in the undergrad labs at CU). Poursolvent into the chamber to a depth of just less than 0.5 cm. To aid in the saturation of the TLC chamber with solvent vapors, you can line part of the inside of the beaker with filter paper. Cover the beaker with a watch glass, swirl it gently, and allow it to stand while you prepare your TLC plate. Step 2: Prepare the TLC plate TLC plates used in the organic chemistry teaching labs are purchased as 5 cm x 20 cm sheets. Each large sheet is cut horizontally into plates which are 5 cm tall by various widths; the more samples you plan to run on a plate, the wider it needs to be. Shown in the photo to the left is a box of TLC plates, a large uncut TLC sheet, and a small TLC plate which has been cut to a convenient size. Handle the plates carefully so that you do not disturb the coating of adsorbentor get them dirty. Measure 0.5 cm from the bottom of the plate. Using a pencil, draw a line across the plate at the 0.5 cm mark. This is the origin: the line on which you will spotthe plate. Take care not to press so hard with the pencil that you disturb the adsorbent. Under the line, mark lightly the name of the samples you will spoton the plate, or mark numbers for time points. Leave enough spacebetween the samples so that they do not run together; about 4 samples on a 5 cm wide plate is advised.
  • 12. Step 3: Spot the TLC plate If the sample is not already in solution, dissolve about 1 mg in 1 mL of a volatile solvent such as hexanes, ethyl acetate, or methylene chloride. As a rule of thumb, a concentration of 1% usually works well for TLC analysis. If the sample is too concentrated, it will run as a smear or streak (see troubleshooting section below); if it is not concentrated enough, you will see nothing on the plate. Sometimes you will need to use trial and error to get well-sized, easy to read spots. Obtain a a microcapillary. In the organic teaching labs, we use 10µL microcaps - they are easier to handle than the smaller ones used in research labs. Dip the microcap into the solution and then gently touch the end of it onto the proper location on the TLC plate. Don't allow the spotto become too large - if necessary, you can touch it to the plate, lift it off and blow on the spot. If you repeat these steps, the wet area on the plate will stay small. This example plate has been spotted with three different quantities of the same solution and is ready to develop. If you are unsure of how much sample to spot, you can always spotmultiple quantities and see which looks best. Step 4: Develop the plate Place the prepared TLC plate in the developing beaker, cover the beaker with the watch glass, and leave it undisturbed on your bench top. The solvent will rise up the TLC plate by capillary action. Make sure the solvent does not cover the spot. Allow the plate to develop until the solvent is about half a centimeter below the top of the
  • 13. plate. Remove the plate from the beaker and immediately mark the solvent front with a pencil. Allow the plate to dry. Step 5: Visualize the spots If there are any colored spots, circle them lightly with a pencil. Most samples are not colored and need to be visualized with a UV lamp. Hold a UV lamp over the plate and circle any spots you see. Beware! UV light is damaging both to your eyes and to your skin! Make sure you are wearing your goggles and do not look directly into the lamp. Protect your skin by wearing gloves. If the TLC plate runs samples which are too concentrated, the spots will be streaked and/or run together. If this happens, you will have to start over with a more dilute sample to spotand run on a TLC plate. Here's what overloaded plates look like compared to well-spotted plates. The plate on the left has a large yellow smear; this smear contains the same two compounds which are nicely resolved on the plate next to it. TLC Solvents Choice When you need to determine the best solvent or mixture of solvents (a "solvent system") to develop a TLC plate or chromatography column loaded with an unknown mixture, vary the polarity of the solvent in several trial runs: a process oftrial and error. Carefully observe and record the results of the chromatography in each solvent system. You will find that as you increase the polarity of the solvent system, all the components of the mixture move faster (and vice versa with lowering the polarity). The ideal solvent system is simply the system that gives the best separation. TLC elution patterns usually carry over to column chromatography elution patterns. Since TLC is a much faster procedurethan column chromatography, TLC is often used to determine the best solvent system for column chromatography.
  • 14. For instance, in determining the solvent system for a flash chromatography procedure, the ideal system is the one that moves the desired componentof the mixture to a TLC Rf of 0.25-0.35 and will separate this componentfrom its nearest neighbor by difference in TLC Rf values of at least 0.20. Therefore a mixture is analyzed by TLC to determine the ideal solvent(s) for a flash chromatography procedure. Beginners often do not know where to start: What solvents should they pull off the shelf to use to elute a TLC plate? Because of toxicity, cost, and flammability concerns, the common solvents are hexanes (or petroleum ethers/ligroin) and ethyl acetate (an ester). Diethyl ether can be used, but it is very flammable and volatile. Alcohols (methanol, ethanol) can be used. Acetic acid (a carboxylic acid) can be used, usually as a small percentage component of the system, since it is corrosive, non-volatile, very polar, and has irritating vapors. Acetone (a ketone) can be used. Methylene chloride or and chloroform (halogenated hydrocarbons)are good solvents, but are toxic and should be avoided whenever possible. If two solvents are equal in performance and toxicity, the more volatile solvent is preferred in chromatography because it will be easier to remove from the desired compound after isolation from a column chromatography procedure. Ask the lab instructor what solvents are available and advisable. Then, mix a non-polar solvent (hexanes, a mixture of 6-carbon alkanes) with a polar solvent (ethyl acetate or acetone) in varying percent combinations to make solvent systems of greater and lesser polarity. Interactions Between the Compound and the Adsorbent The strength with which an organic compound binds to an adsorbentdepends on the strength of the following types of interactions: ion- dipole, dipole-dipole, hydrogen bonding, dipole induced dipole, and van der Waals forces. With silica gel, the dominant interactive forces between the adsorbentand the materials to be separated are of the dipole-dipole type. Highly polar molecules interact fairly strongly with the polar SiOH groups at the surface of these adsorbents, and will tend to stick or adsorb onto the fine
  • 15. particles of the adsorbentwhile weakly polar molecules are held less tightly. Weakly polar molecules generally tend to move through the adsorbentmore rapidly than the polar species. Roughly, the compounds follow the elution order given above. The Rf value The retention factor, or Rf, is defined as the distance traveled by the compound divided by the distance traveled by the solvent. Forexample, if a compound travels 2.1 cm and the solvent front travels 2.8 cm, the Rf is 0.75: The Rf for a compound is a constant from one experiment to the next only if the chromatography conditions below are also constant:  solvent system  adsorbent  thickness of the adsorbent  amount of material spotted  temperature Since these factors are difficult to keep constant from experiment to experiment, relative Rf values are generally considered. "Relative Rf" means that the values are reported relative to a standard, or it means that you compare the Rf values of compounds run on the same plate at the same time. The larger an Rf of a compound, the larger the distance it travels on the TLC plate. When comparing two different compounds run under identical chromatography conditions, the compound with the larger Rf is less polar because it interacts less strongly with the polar adsorbenton the TLC plate. Conversely, if you know the structures of the compounds in a mixture, you can predict that a compound of low polarity will have a larger Rf value than a polar compound run on the same plate. The Rf can provide corroborative evidence as to the identity of a compound. If the identity of a compound is suspected but not yet proven, an authentic sample of the compound, or standard, is spotted and run on a TLC plate side by side (or on top of each other) with the compound in question. If two substances have the same Rf value, they are likely (but not necessarily) the same compound. If they have different Rf values, they are definitely different compounds. Notethat this identity check must be performed on a single plate, because it is difficult to duplicate all the factors which influence Rf exactly from experiment to experiment.
  • 16. Troubleshooting TLC All of the above (including the procedurepage) might sound like TLC is quite an easy procedure. But what about the first time you run a TLC, and see spots everywhere and blurred, streaked spots?As with any technique, with practice you get better. Examples of common problems encountered in TLC:  The compound runs as a streak rather than a spot: The sample was overloaded. Run the TLC again after diluting your sample. Or, your sample might just contain many components, creating many spots which run together and appear as a streak. Perhaps, the experiment did not go as well as expected.  The sample runs as a smear or a upward crescent: Compounds which possessstrongly acidic or basic groups (amines or carboxylic acids) sometimes show up on a TLC plate with this behavior. Add a few drops of ammonium hydroxide (amines) or acetic acid (carboxylic acids) to the eluting solvent to obtain clearer plates.  The sample runs as a downward crescent: Likely, the adsorbent was disturbed during the spotting, causing the crescent shape.  The plate solvent front runs crookedly: Either the adsorbent has flaked off the sides of the plate or the sides of the plate are touching the sides of the container (or the paper used to saturate the container) as the plate develops. Crooked plates make it harder to measure Rf values accurately.  Many random spots are seen on the plate: Make sure that you do not accidentally drop any organic compound on the plate. If get a TLC plate and leave it laying on your workbench as you do the experiment, you might drop or splash an organic compound on the plate.  No spots are seen on the plate: You might not have spotted enough compound, perhaps because the solution of the compound is too dilute. Try concentrating the solution, or
  • 17. spotit several times in one place, allowing the solvent to dry between applications. Some compounds do notshow up under UV light; try another method of visualizing the plate (such as staining or exposing to iodine vapor). Or, perhaps you do not have any compound becauseyour experiment did not go as well as planned. If the solvent level in the developing jar is deeper than the origin (spotting line) of the TLC plate, the solvent will dissolve the compounds into the solvent reservoir instead of allowing them to move up the plate by capillary action. Thus, you will not see spots after the plate is developed. These photos show how the yellow compound is running into the solvent when lifted from the developing jar.