Technical Data | Sig Sauer Easy6 BDX 1-6x24 | Optics Trade
Rachael Wiseman
1. TEAM RANK AND ATTACKING
PHASES IN RUGBY LEAGUE
Rachael Wiseman
Email: u3017119@uni.canberra.edu.au
INTRODUCTION RESULTS CONCLUSION
The attacking phase in rugby league is a key aspect of every Analysis showed that there was an association between team rank The key finding of this study was that teams lower on the NRL results
game. There are a number of components that are thought to and the number of passes in a phase (χ2 (6) = 69.77, p= <.001). ladder were inclined to pass less and tried to run the ball down the
make up a successful attacking phase. These include the field • 91.4% (SR= 2.5) of teams ranked 13-16 on the results ladder centre of the field. Whereas teams that were ranked higher on the ladder
position, quality of passes and number of passes made in each were associated with passing less than twice in a phase passed ball more and also tended to pass the ball out wider. Teams that
phase. Recently there has been a great deal of research • 25.3 % (SR = 4.3) of teams ranked 5-8 were associated with passed more than five times in a phase were more likely to score a try
regarding attacking and defensive plays in rugby league (1, 2). passing the ball 3-4 times in a phase. although it was also noted that when passing the ball more frequently,
These studies have focused on using time motion analysis. • 7.1% (SR=-4.2) of teams placed 13-16 on the ladder were there was a higher incidence of errors. Furthermore, there was a trend
With the purpose to examine time spent in attack and defence less likely to use 3-4 passes in a phase. indicating that teams that gained more than 21metres in a phase were
as well as the speeds reached by players (1, 2). There has been more likely to score a try.
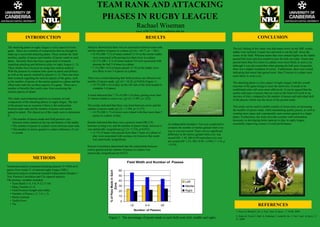
little research regarding the tactical aspects of the game, such There was a trend indicating that field position can influence the
as the number of passes or the metres gained in a phase and the number of passes made. (χ2 (4) = 10.42, p=0.034) (Figure 1). The attacking phase is a key aspect of rugby league with the overall
effect team rank has on these aspects of a game. There are a • 19.7% (SR=1.6) of play on the left side of the field tended to outcome of the game being to score the most tries. It needs to be
number of benefits that could come from examining the complete 3-4 passes. established what will score more effectively. It can be argued that the
tactical aspects of attack. quality and types of passes that are used on the field will result in an
A trend indicated that 7.3% of (SR=1.6) plays gaining more than increase of tries, compared to the number of passes and individual skill
This study used notational analysis to examine several 21 metres tended to score a try. (χ2 (2) =3.007, p=.222). of the players which was the focus of the present study.
components of the attacking phases in rugby league. The aim
of the project was to examine if there is the relationship The results indicated that there was trend between errors and the This study can be used to enable coaches to focus more on increasing
between team rank and the number of passes and metres number of passes made (χ2 (2) = 3.504, p= 0.173). the number of passes made, while maintaining quality passes, as well as
gained in attack. The objectives of this study were to determine • 14.3% (SR=1.7) of errors were related with than more than 5 creating more space and consequently more metres gained in a single
if: passes in a phase of play. phase. Furthermore, the study provides coaches with information
• The number of passes made and field position vary necessary in developing better patterns to play in rugby league,
between teams ranked on the top and bottom of the ladder. Results indicated that there was a positive trend (SR≥2.0) essentially improving a team’s overall performance.
An Independent Samples t Test was conducted to
• The number of passes in a phase varies between team rank. between scoring a try and the number of passes made, however it
compare the number of metres gained when a try
• The number of metres gained in a phase influences if a try was statistically insignificant (χ2 (2) =5.276, p=0.072).
was or was not scored. There was no significant
is scored. • 11.1% of teams who passed more than 5 times in a phase of
difference in the metres gained when a try was
play were associated with scoring a try however this result
scored (M= 1.42, SD=0.59) and when a try was
was statistically insignificant.
not scored (M= 1.25, SD= 0.49; t (1501) = 2.14, p
= 0.59).
Pearson Correlation determined that the relationship between
metres gained and the number of passes in a phase was
statistically insignificant (p=0.072)
METHODS
Field Width and Number of Passes
Notational analysis examined attacking phases( N=1504) on 8
games from round 21 of national rugby league (NRL). 60
% of Pass Made in Each
Statistical analysis conducted included Independent Samples t
Test, Pearson Correlation and Chi squared analysis. 50
The primary variables included: 40 Left
• Team Rank (1-4, 5-8, 9-12,13-16)
Zone
• Phase Number (1-5) 30 Middle
• Field Position (length and width) 20 Right
• Number of Passes (>2, 3-4, ≥ 5)
• Metres Gained 10
• Tackle Error 0
• Try <2 3-4 ≥5 REFERENCES
Number of Passes 1. Eaves S, Broad G, Int. J. Perf. Anal. In Sport , 7: 54-66, 2009
2. Sykes D, Twist C, Hall S, Nicholas C, Lamb K, Int. J. Perf. Anal. In Sport , 9:
Figure 1: The percentage of passes made in each field zone (left, middle and right) 47, 2009