NPI Evaluation of Grameen Foundation
•
1 recomendación•627 vistas

www.nonprofitinvestor.org

Recomendados
Más contenido relacionado
Más de Nonprofit Investor
Más de Nonprofit Investor (20)
Último
Último (20)
NPI Evaluation of Grameen Foundation
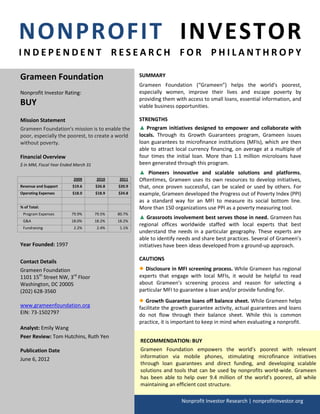
- 1. NONPROFIT INVESTOR INDEPENDENT RESEARCH FOR PHILANTHROPY Grameen Foundation SUMMARY Grameen Foundation (“Grameen”) helps the world's poorest, Nonprofit Investor Rating: especially women, improve their lives and escape poverty by providing them with access to small loans, essential information, and BUY viable business opportunities. Mission Statement STRENGTHS Grameen Foundation's mission is to enable the ▲ Program initiatives designed to empower and collaborate with poor, especially the poorest, to create a world locals. Through its Growth Guarantees program, Grameen issues without poverty. loan guarantees to microfinance institutions (MFIs), which are then able to attract local currency financing, on average at a multiple of Financial Overview four times the initial loan. More than 1.1 million microloans have $ in MM, Fiscal Year Ended March 31 been generated through this program. ▲ Pioneers innovative and scalable solutions and platforms. 2009 2010 2011 Oftentimes, Grameen uses its own resources to develop initiatives, Revenue and Support $19.6 $26.8 $20.9 that, once proven successful, can be scaled or used by others. For Operating Expenses $18.0 $18.9 $24.8 example, Grameen developed the Progress out of Poverty Index (PPI) as a standard way for an MFI to measure its social bottom line. % of Total: More than 150 organizations use PPI as a poverty measuring tool. Program Expenses 79.9% 79.5% 80.7% ▲ Grassroots involvement best serves those in need. Grameen has G&A 18.0% 18.2% 18.2% regional offices worldwide staffed with local experts that best Fundraising 2.2% 2.4% 1.1% understand the needs in a particular geography. These experts are able to identify needs and share best practices. Several of Grameen’s Year Founded: 1997 initiatives have been ideas developed from a ground-up approach. Contact Details CAUTIONS Grameen Foundation ● Disclosure in MFI screening process. While Grameen has regional 1101 15th Street NW, 3rd Floor experts that engage with local MFIs, it would be helpful to read Washington, DC 20005 about Grameen’s screening process and reason for selecting a (202) 628-3560 particular MFI to guarantee a loan and/or provide funding for. ● Growth Guarantee loans off balance sheet. While Grameen helps www.grameenfoundation.org facilitate the growth guarantee activity, actual guarantees and loans EIN: 73-1502797 do not flow through their balance sheet. While this is common practice, it is important to keep in mind when evaluating a nonprofit. Analyst: Emily Wang Peer Review: Tom Hutchins, Ruth Yen RECOMMENDATION: BUY Publication Date Grameen Foundation empowers the world’s poorest with relevant June 6, 2012 information via mobile phones, stimulating microfinance initiatives through loan guarantees and direct funding, and developing scalable solutions and tools that can be used by nonprofits world-wide. Grameen has been able to help over 9.4 million of the world’s poorest, all while maintaining an efficient cost structure. Nonprofit Investor Research | nonprofitinvestor.org
- 2. OVERVIEW OF GRAMEEN FOUNDATION ACTIVITIES, PROGRAM RESULTS, AND EFFECTIVENESS Grameen Foundation helps the world's poorest, especially women, improve their lives and escape poverty by providing them with access to small loans, essential information, and viable business opportunities. Through two of the most effective tools known – small loans and the mobile phone – Grameen works to make a difference in the lives of poor people, especially those living on less than $1.25 per day. In total, over 9.4 million of the world’s poor have been helped by Grameen’s microfinance institution (MFI) partners. Grameen was founded to replicate the model of Grameen Bank in Bangladesh. Grameen Bank was started in 1976 by Professor Muhammad Yunus with $27. Now, the bank serves more than 7 million poor families, is fully owned by its clients, and has been a model for microfinance institutions around the world. In 2006, Professor Yunus and Grameen Bank jointly received the Nobel Peace Prize. Although Grameen Foundation and Grameen Bank are independent organizations, both organizations share similar missions to serve the world’s poorest. While Grameen’s influence and reach is extremely wide and difficult to narrow into specific interest areas, for purposes of understanding the organization, Grameen’s activities can be divided into the following three areas: Programs Results and Effectiveness Enabling the Microfinancing Process Growth Guarantees Program • Issues loan guarantees to local MFIs through • Since 2005, the program has generated more than partnership with Citigroup. $180 million in local financing in 13 countries. • Helps MFIs attract additional funding from local • Each guarantee dollar is able to be leveraged, on lenders. average, four times to encourage additional local financing for MFIs. • Protects MFIs from foreign exchange risk. Pioneer Fund • Provides funding to high potential early stage MFIs to • In 2010-2011, the Pioneer Fund invested $3 million in support their growth until they are able to access emerging MFIs. The total portfolio for the Pioneer commercial capital. fund exceeds $6.3 million. • Lead financing in markets that have not attracted much commercial capital, targeting poorer regions. Human Capital Center • Assists MFIs to develop leaders, identify and execute • Developed a human capital assessment tool that is on business strategy, and prioritize resources. being piloted in Asian and Africa. Utilizing Technology to Empower The Poor Community Knowledge Worker (CKW) Program • Addresses "information poverty" by providing • Currently operating in Eastern Uganda. Easily farmers with relevant and timely agricultural scalable. Goal is to reach 1,500 CKWs and serve 1.25 information (weather forecasts, market prices, million Ugandans. pest/disease control) via mobile phone. • Over 98 CKWs, or farmer leaders selected by peers, • Each CKW serves between 500 to 1,000 farmer act as community liaisons and disseminate households in their individual communities. information. Grameen Foundation | Nonprofit Investor Research 2
- 3. Mobile Technology for Community Health (MOTECH) • Aims to reduce high infant and maternal mortality • Successful pilot program has prompted an expansion rates in Ghana. Centralized database keepts track of throughout Ghana in partnership with Ghana Health patient data, sending reminders about care visits and Services. Extending Mobile Health technology fetal development. platform to a new geography and health priority: HIV/AIDs program in India. Grameen Social Initiatives Bankers Without Borders • Connects individuals and companies from various • Over 8,000 volunteers globally, each contributing on fields (finance, technology, marketing, human average 120 hours of service per project. Over 260 resources) to support Grameen's social enterprise, individuals sign up per month. Since inception, more microfinance, and technology development projects than $4 million in in-kind services have been around the world. contributed. Progress Out of Poverty (PPI) Index • Country-specific (46 countries) tool developed by • More than 150 organizations worldwide use PPI to Grameen to help measure the poverty level of track how well they are serving clients. This number groups and individuals. The tool is also useful for is up from 73 in fiscal year 2010. Currently piloting improving MFI practices and decision making. and implementing more PPI countries. TRANSPARENCY Grameen Foundation provides the required financial information from 2009 to 2011 in its financial statements and Form 990s on its website. Its website also provides a detailed overview of all its initiatives, the reasoning behind their initiatives, current status, and current partners. Grameen also provides extensive white papers, thought publications, and academic studies related to their initiatives. FINANCIAL OVERVIEW Revenue: Contributions and grants comprise the majority of Grameen’s revenue sources, or 75% in fiscal year 2011. Roughly 50% of such contributions are from foundations, 26% from individuals, and 24% from corporations. The next largest revenue source is from in-kind contributions, totaling $3 million (almost 15% of revenues) in 2011. The break- down of in-kind contributions is 62% professional services, 26% legal services, and 11% advertising and software development. Revenue Breakdown Expense Breakdown $ in '000 Grameen Foundation | Nonprofit Investor Research 3
- 4. Expenses: As a percent of total expenses, program service Program Expenses costs have only marginally improved from 79.9% in fiscal 7.6% 12.7% year 2009 to 80.7% in fiscal year 2011. Technology (which includes programs such as CKW and MOTECH) and Microfinance (which includes loans given from the Pioneer Fund and programs that enable the microfinance process such as the Human Capital Center), make up the 44.7% 35.1% bulk of, or 44.7% and 35.1%, respectively, of total program expenses. Regional programs are 12.7% of program expenses and Public Education follows at 7.6% of Regional Programs Microfinance Technology Public Eduction program expenses. Management and general expenses have stayed fairly constant as a percent of total expenses, ranging between 18.0 to 18.2% in fiscal years 2009 to 2011. For an organization of Grameen’s size, the amount spent on Fundraising activities is quite small, only $268,413 in fiscal year 2011, or 1.1% of total expenses. Fiscal Year Ended March 31 2009 2010 2011 Source: Revenue and Expenses (GAAP Accounting Basis) Support Contributions and grants $15,318,580 $22,672,081 $15,706,461 Audited Financial Statements (GAAP) In-kind contributions 2,349,825 2,367,829 3,077,740 Audited Financial Statements (GAAP) Revenue Program revenues 1,938,367 1,244,185 1,409,264 Audited Financial Statements (GAAP) Interest and investment income (159,663) 368,726 408,747 Audited Financial Statements (GAAP) Loan interest 143,451 193,476 321,948 Audited Financial Statements (GAAP) Total Support and Revenues $19,590,560 $26,846,297 $20,924,160 % Growth 37.0% -22.1% Expenses: Program Services $14,418,590 $15,032,646 $19,994,244 Audited Financial Statements (GAAP) Management and General 3,246,064 3,437,414 4,515,842 Audited Financial Statements (GAAP) Fundraising 390,985 450,051 268,413 Audited Financial Statements (GAAP) Total Expenses: $18,055,639 $18,920,111 $24,778,499 % of Revenue 92.2% 70.5% 118.4% Revenue Less Expenses $1,534,921 $7,926,186 ($3,854,339) Allowances for uncollectible loans receivable and foreign exchange risk (1,410,060) 794,051 (610,991) Audited Financial Statements (GAAP) Present value discount of loans receivable 103,493 26,427 9,643 Audited Financial Statements (GAAP) Refund of unspent grant funds 0 (998,541) (40,000) Audited Financial Statements (GAAP) Change in Assets $228,354 $7,748,123 ($4,495,687) Program Expenses by Function Regional Programs 3,902,073 3,042,140 2,530,087 Audited Financial Statements (GAAP) Microfinance 3,399,215 4,447,627 7,017,734 Audited Financial Statements (GAAP) Technology 6,188,948 6,424,600 8,932,475 Audited Financial Statements (GAAP) Public Eduction 928,354 1,118,279 1,513,948 Audited Financial Statements (GAAP) Total Program Expenses 14,418,590 15,032,646 19,994,244 Program Costs as a % of Total Expenses 79.9% 79.5% 80.7% G&A as a % of Total Expenses 18.0% 18.2% 18.2% Fundraising as a % of Total Expenses 2.2% 2.4% 1.1% Grameen Foundation | Nonprofit Investor Research 4
- 5. Fiscal Year Ended March 31 2009 2010 2011 Balance Sheet Current Assets Cash and cash equivalents $12,948,789 $19,610,711 $14,941,997 Investments 870,637 1,186,399 4,077,961 Loan receivable, net of allowance 1,761,988 1,967,203 1,859,915 Grants and contributions receivable 3,988,997 4,100,737 2,612,141 Other receivables and advances 362,204 385,684 508,835 Prepaid expenses 51,453 166,440 239,191 Total current assets 19,984,068 27,417,174 24,240,040 Property and Equipment Furniture and equipment 303,056 303,056 391,986 Less: Accumulated depreciation (140,009) (164,674) (187,988) Net property and equipment 163,047 138,382 203,998 Other Assets Loan receivable, net of current portion and allowance 3,280,555 2,724,934 3,944,558 Loans to program related investments 199,600 199,600 0 Program related investments 1,133,420 1,153,447 1,153,447 Grants and contributions receivable, net of current portion 279,458 1,410,954 0 Deposits 100,058 99,508 172,950 Total other assets 4,993,091 5,588,443 5,270,955 Total Assets $25,140,206 $33,143,999 $29,714,993 Current Liabilities Notes payable, current portion $48,000 $96,000 $48,000 Accounts payable and accured expenses 897,423 1,201,093 1,980,240 Noncurrent Liabilities Notes payable, net of current portion 144,000 48,000 - Deferred rent liability - - 383,534 Net Assets Unrestricted 9,250,301 8,674,153 8,509,555 Temporarily restricted 14,800,482 23,124,753 18,793,664 Total Liabilities and Net Assets $25,140,206 $33,143,999 $29,714,993 Other Notable Items: • In Schedule 1 of Grameen’s financial statements, the Consolidating Statement of Activities and Functional Expenses for the Year Ended March 31, 2011, it details the distribution of expenses across Grameen’s eight global offices (including its headquarter in the United States). According to the statement, only 8% of expenses are spent overseas. These expenses refer to expenses incurred only on the local accounting books, such as payments made from local bank accounts. The remainder of expenses are primarily recorded on United States accounting books, including expenditures on professional services, travel expenses, IT systems, and computer- related expenses. Pro-bono and other donated professional services are also accrued under the United States. • The loan guarantees granted through the Growth Guarantees Program do not flow through the balance sheet on Grameen’s audited financial statement. While this is common accounting practice in some situations, it is important to be aware and inquiry about such funds when evaluating a non-profit. To be clear, an off-balance sheet classification of funds does not imply fraud; however, a material amount of off-balance sheet funds may make it more difficult to evaluate the financial standing of an organization, as the amount and nature of such funds are unknown. Proper due diligence with management is suggested in such a situation. Based on discussions with management, in fiscal year 2011, Grameen placed $6.1 million in guarantees through the Grameen Foundation | Nonprofit Investor Research 5
- 6. Growth Guarantees Program. For fiscal years ending 2011, 2010, and 2009, there were no liabilities under the program. Management indicates there has not been a history of loss under the program. • In fiscal year 2011, Grameen operated at a loss of $3.9 million. For context, this loss represented 15.6% of total 2011 expenses. While losses may be common amongst non-profits, particularly in terms of timing of cash outlays, it is something that should be monitored. THIRD PARTY RATINGS Grameen Foundation is rated the highest rating possible on Charity Navigator (4 stars out of 4 stars), which bases its ratings on financials (65.43/70, or 93.5%) and accountability & transparency (70/70, or 100%). Grameen Foundation is also certified by the Better Business Bureau’s Wise Giving Alliance. GET INVOLVED • Donations, Monthly Giving (http://www.grameenfoundation.org/take-action) • Volunteer with Bankers Without Borders (http://www.bankerswithoutborders.com/) • In-Kind donations of products and services (http://www.grameenfoundation.org/take-action/corporate-support) • Corporate Donations (http://www.grameenfoundation.org/take-action/corporate-support) DISCLOSURES Emily Wang certifies that she does not have any affiliation with Grameen Foundation and has never made a donation to the organization. Additionally, Emily has not supported directly competing organizations in a greater capacity than a nominal donation. NPI analysts and NPI as an organization do not receive any form of compensation from reviewed charities. This report is for informational purposes only and does not constitute a solicitation for donations. While the reliability of information contained in this report has been assessed by NPI, NPI makes no representation as to its accuracy or completeness, except with respect to the Disclosure Section of the report. Any opinions expressed herein reflect our judgment as of the date of the materials and are subject to change without notice. NPI has no obligation to update, modify or amend any report or to otherwise notify a reader thereof in the event that any matter stated herein, or any opinion, projection, forecast or estimate set forth herein, changes or subsequently becomes inaccurate, or if research on the subject organization is withdrawn. Opinions and recommendations in our reports do not take into account specific reader circumstances, objectives, or needs. The recipients of our reports must make their own independent decisions regarding any organization mentioned by NPI. Grameen Foundation | Nonprofit Investor Research 6