Stochastic gene expression in growing cell populations - Philipp Thomas
•
0 recomendaciones•641 vistas

QUANTITATIVE LAWS June 13 -June 24

Recomendados
Recomendados
Más contenido relacionado
La actualidad más candente
La actualidad más candente (20)
Destacado
Destacado (20)
Similar a Stochastic gene expression in growing cell populations - Philipp Thomas
Similar a Stochastic gene expression in growing cell populations - Philipp Thomas (20)
Más de Lake Como School of Advanced Studies
Más de Lake Como School of Advanced Studies (20)
Último
Último (20)
Stochastic gene expression in growing cell populations - Philipp Thomas
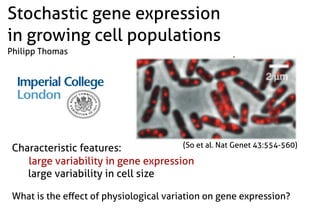
- 1. Characteristic features: large variability in gene expression large variability in cell size What is the effect of physiological variation on gene expression? (So et al. Nat Genet 43:554-560) Stochastic gene expression in growing cell populations Philipp Thomas
- 2. Common ways of quantification proteinmRNA km dilution ks k0 • Gillespie Algorithm: reaction kinetics at constant cell size • often not sufficient to describe the variability observed within a population (extrinsic noise) cell size protein fluorescence (gene expression variability)
- 3. Gene expression in growing and dividing cells single cell growth & gene expression division & partitioning of molecules low fluorescence high fluorescence smaller cell larger cell s(t)=s0eαt Gillespie trajectory
- 4. single cell growth & gene expression division & partitioning of molecules low fluorescence high fluorescence model predicts cell size & gene expression When is it equivalent to constant population at constant cell size? sizevariability gene expression noise cell size distribution 1.0 1.5 2.0 2.5 0.2 0.4 0.6 0.8 1.0 1.2 1.4 theory simulation size protein count after cell sorting cell size • •••••••••••••••••••••••••••••••••••••••••••• • 1.0 1.5 2.0 2.5 50 100 150 200 on average PopulationLevel
- 5. Mass action kinetics: the effective dilution model is exact for networks containing only reactions of the form: But not for translation! When does population structure matter? Fano[M|s] • • ••••••••••••••••••••••••••••••••••••• • • • 1.0 1.5 2.0 cell size 0.6 0.8 1.0 1.2 1.4 • •••••••••••••••••••••••••••••••••••••••••••• • 1.0 1.5 2.0 2.5 cell size 50 100 150 200 E[P|s] CME only holds on average here! • ••••••••••••••••••••••••••••••••••••• ••• • • • • 1.0 1.5 2.0 2.5 0.01 0.02 0.03 0.04 0.05 0.06 simulation CV2 [P|s] effective dilution model conditional mRNA distribution is Poissonian the effective dilution model holds on average cell size mRNApre-mRNA proteinmRNA +
- 6. • • • • • • • • • • • • • • • • • • • • • • • • • • • • • • • • • 0.7 0.8 0.9 1.0 1.1 1.2 1.3 1.4 birth size 0.02 0.04 0.06 0.08 0.10 0.12 0.14 CV2 [P|s0] ••• ••••••••••••••••••••••••••••••••••••• •• ••• • ••••••••••••••••••••••••••••••••• ••• ••• • • 1.0 1.5 2.0 2.5 cell size 0.035 0.040 0.045 0.050 0.055 0.060 CV2 [P|s] Protein fluctuations depend on cell history that can be quantified by size at birth. theory vs simulation: adder and sizer models