Gantt- Pert Chart Activities
•Descargar como DOCX, PDF•
1 recomendación•1,570 vistas

This document provides a task list and precedence relationships for a CPU project. It instructs students to: 1. Create a PERT diagram using the task list, labeling it completely for 10 points. 2. List all paths in the PERT diagram for the CPU project, calculating critical path and slack times for 20 points. It also provides a task list and precedence relationships for a systems design project. It instructs students to: 1. Draw a Gantt chart to organize the design project tasks. 2. Create a PERT diagram based on the systems design project task list, listing all paths and identifying critical path and slack times.

Recomendados
Más contenido relacionado
La actualidad más candente
La actualidad más candente (20)
Destacado
Similar a Gantt- Pert Chart Activities
Similar a Gantt- Pert Chart Activities (20)
Más de learnt
Más de learnt (20)
Último
Último (20)
Gantt- Pert Chart Activities
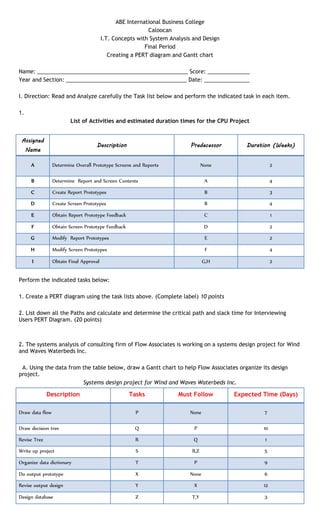
- 1. ABE International Business College Caloocan I.T. Concepts with System Analysis and Design Final Period Creating a PERT diagram and Gantt chart Name: __________________________________________________ Score: ______________ Year and Section: ________________________________________ Date: _______________ I. Direction: Read and Analyze carefully the Task list below and perform the indicated task in each item. 1. List of Activities and estimated duration times for the CPU Project Assigned Name Description Predecessor Duration (Weeks) A Determine Overall Prototype Screens and Reports None 2 B Determine Report and Screen Contents A 4 C Create Report Prototypes B 3 D Create Screen Prototypes B 4 E Obtain Report Prototype Feedback C 1 F Obtain Screen Prototype Feedback D 2 G Modify Report Prototypes E 2 H Modify Screen Prototypes F 4 I Obtain Final Approval G,H 2 Perform the indicated tasks below: 1. Create a PERT diagram using the task lists above. (Complete label) 10 points 2. List down all the Paths and calculate and determine the critical path and slack time for Interviewing Users PERT Diagram. (20 points) 2. The systems analysis of consulting firm of Flow Associates is working on a systems design project for Wind and Waves Waterbeds Inc. A. Using the data from the table below, draw a Gantt chart to help Flow Associates organize its design project. Systems design project for Wind and Waves Waterbeds Inc. Description Tasks Must Follow Expected Time (Days) Draw data flow P None 7 Draw decision tree Q P 10 Revise Tree R Q 1 Write up project S R,Z 5 Organize data dictionary T P 9 Do output prototype X None 6 Revise output design Y X 12 Design database Z T,Y 3
- 2. B. A PERT Diagram based on the data above. List all paths and calculate and identify the critical path and slack times. PERT diagram from Flow Associates 10 20 30 40 50 60 70 P X Y Q T R Z S