SlideShare una empresa de Scribd logo
1 de 6
AP/H Statistics
Guided Notes
Mrs. LeBlanc – Perrone                                                  Name: ______________________________

                                                                        Date: ___________
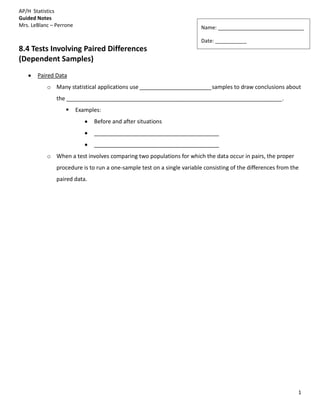
8.4 Tests Involving Paired Differences
(Dependent Samples)
       Paired Data
           o Many statistical applications use _______________________samples to draw conclusions about
               the _____________________________________________________________________.
                        Examples:
                               Before and after situations
                               ________________________________________
                               ________________________________________
           o When a test involves comparing two populations for which the data occur in pairs, the proper
               procedure is to run a one-sample test on a single variable consisting of the differences from the
               paired data.


                                                                                                               1
AP/H Statistics
Guided Notes
Mrs. LeBlanc – Perrone

       Components of the Paired Test
           o Hypotheses
                        When testing the mean of the differences of paired data values, the null hypothesis
                         states that “_____________________________________________________”
                         (              )
                        The null hypothesis is always ___________________
                        The alternate hypothesis depends on the problem and can be:


                         Left-Tailed                      Right-Tailed                 Two-Tailed


           o
                        ________________________________________________________________________
                        Take the measurements from one set– measurements of the other set, then find the
                         mean (add up the differences and divide by the number of data pairs)
                                This can be done in the calculator
                                    o Enter the “after” values in L1
                                    o Enter the “before” values in L2
                                    o Highlight L3, type L1 – L2, press ENTER (L3 should populate with the
                                       differences)
                                    o Hit Stat, tab over to calc, choose 1:1-Var Stats, use L3 hit ENTER
                                               
                                                S
                                       o For paired difference tests, we make our decision regarding H0 according
                                            to the evidence of _______
           o
                        ________________________________________________________________________


                                                                                                                    2
AP/H Statistics
Guided Notes
Mrs. LeBlanc – Perrone

           o Sample Test Statistic
                   
           o P-Value
                        ________________________________________________________________________
                         ________________________________________________________________________


                                                                                                3
AP/H Statistics
Guided Notes
Mrs. LeBlanc – Perrone

       How to Test Paired Differences Using The Student’s Distribution
                   1. ________________________________________________________________________
                             Do you have a random sample of      matched data pairs?
                             Identify ,     and
                             Is the   distribution normal, mound-shaped symmetrical, or is         ?
                   2. State the null and alternate hypotheses, Identify the level of significance
                          
                   3. ________________________________________________________________________

                             Sample Test Statistic:

                   4. ________________________________________________________________________
                             Use a T-test
                   5. ________________________________________________________________________
                             If P-value      , we reject
                             If P-value > , we fail to reject
                   6. ________________________________________________________________________


                                                                                                        4
AP/H Statistics
Guided Notes
Mrs. LeBlanc – Perrone

Example: Paired Differences
 A team of heart surgeons at Saint Ann’s Hospital knows that many patients who undergo corrective heart
 surgery have a dangerous buildup of anxiety before their scheduled operations. The staff psychiatrist at the
 hospital has started a new counseling program intended to reduce this anxiety. A test of anxiety is given to
 patients who know they must undergo heart surgery. Then each patient participates in a series of counseling
 sessions with the staff psychiatrist. At the end of the counseling sessions, each patient is retested
 todetermine anxiety level. Table 8-8 indicates the results for a random sample of nine patients. Higher scores
 mean higher levels of anxiety. Assume the distribution of differences is mound-shaped and symmetric. From
 the given data, can we conclude that the counseling sessions reduce anxiety? Use a 0.01 level of significance.


                                                                                                              5
AP/H Statistics
Guided Notes
Mrs. LeBlanc – Perrone

Summary Questions

   1. Are data that can be paired independent or dependent? (Hint: we talked about independent and
      dependent in Chapter 7)
      ____________________________________________________________________________________
      ____________________________________________________________________________________
      ____________________________________________________________________________________
      ____________________________________________________________________________________

   2. When testing the difference of means for paired data, what is the null hypothesis? What does it mean?
      ____________________________________________________________________________________
      ____________________________________________________________________________________
      ____________________________________________________________________________________
      ____________________________________________________________________________________

   3. What elements of testing with P-values are consistent in every situation ( )?
      ____________________________________________________________________________________
      ____________________________________________________________________________________
      ____________________________________________________________________________________
      ____________________________________________________________________________________
      ____________________________________________________________________________________
      ____________________________________________________________________________________
      ____________________________________________________________________________________
      ____________________________________________________________________________________


“HOT” Question:
__________________________________________________________________________________________
__________________________________________________________________________________________


                                                                                                          6

Más contenido relacionado

Similar a Paired t-test guide

9.1 9.2 9.3 using the graph calc
9.1 9.2 9.3 using the graph calc9.1 9.2 9.3 using the graph calc
9.1 9.2 9.3 using the graph calcleblance
 
8.3 p value
8.3 p value8.3 p value
8.3 p valueleblance
 
8.2 p value guided notes
8.2 p value guided notes8.2 p value guided notes
8.2 p value guided notesleblance
 
Hypothesis Madlibs
Hypothesis MadlibsHypothesis Madlibs
Hypothesis MadlibsMrs. Henley
 
CIRCLE OR HIGHLIGHT the correct answer for the following questions.docx
CIRCLE OR HIGHLIGHT the correct answer for the following questions.docxCIRCLE OR HIGHLIGHT the correct answer for the following questions.docx
CIRCLE OR HIGHLIGHT the correct answer for the following questions.docxchristinemaritza
 
General Psych, Ch. 7
General Psych, Ch. 7General Psych, Ch. 7
General Psych, Ch. 7SayBrea
 
General Psych, Ch. 7
General Psych, Ch. 7General Psych, Ch. 7
General Psych, Ch. 7SayBrea
 
Assessment Tool: Semantic Differential Scales
Assessment Tool: Semantic Differential ScalesAssessment Tool: Semantic Differential Scales
Assessment Tool: Semantic Differential ScalesJill Frances Salinas
 
NGR 7848 Fundamentals of Statistics for Clinicians Ho.docx
NGR 7848 Fundamentals of Statistics for Clinicians   Ho.docxNGR 7848 Fundamentals of Statistics for Clinicians   Ho.docx
NGR 7848 Fundamentals of Statistics for Clinicians Ho.docxhenrymartin15260
 
CA Database Scavenger Hunt pt. 1
CA Database Scavenger Hunt pt. 1CA Database Scavenger Hunt pt. 1
CA Database Scavenger Hunt pt. 1amytaylor
 
Assessment 1 – Basics of Research and Statistics, Frequency Dist.docx
Assessment 1 – Basics of Research and Statistics, Frequency Dist.docxAssessment 1 – Basics of Research and Statistics, Frequency Dist.docx
Assessment 1 – Basics of Research and Statistics, Frequency Dist.docxgalerussel59292
 
Assessment 1 – Basics of Research and Statistics, Frequency Dist.docx
Assessment 1 – Basics of Research and Statistics, Frequency Dist.docxAssessment 1 – Basics of Research and Statistics, Frequency Dist.docx
Assessment 1 – Basics of Research and Statistics, Frequency Dist.docxcargillfilberto
 
Histograms and Descriptive Statistics Scoring GuideCRITERIANON.docx
Histograms and Descriptive Statistics Scoring GuideCRITERIANON.docxHistograms and Descriptive Statistics Scoring GuideCRITERIANON.docx
Histograms and Descriptive Statistics Scoring GuideCRITERIANON.docxpooleavelina
 
Module 01 – Basics of StatisticsClass Objectives· Define and ca.docx
Module 01 – Basics of StatisticsClass Objectives· Define and ca.docxModule 01 – Basics of StatisticsClass Objectives· Define and ca.docx
Module 01 – Basics of StatisticsClass Objectives· Define and ca.docxroushhsiu
 
Research Evaluation FormCCMH525 Version 32University of.docx
Research Evaluation FormCCMH525 Version 32University of.docxResearch Evaluation FormCCMH525 Version 32University of.docx
Research Evaluation FormCCMH525 Version 32University of.docxaudeleypearl
 
1.What would be the appropriate statistical procedure to test t.docx
1.What would be the appropriate statistical procedure to test t.docx1.What would be the appropriate statistical procedure to test t.docx
1.What would be the appropriate statistical procedure to test t.docxhyacinthshackley2629
 

Similar a Paired t-test guide (20)

9.1 9.2 9.3 using the graph calc
9.1 9.2 9.3 using the graph calc9.1 9.2 9.3 using the graph calc
9.1 9.2 9.3 using the graph calc
 
8.3 p value
8.3 p value8.3 p value
8.3 p value
 
8.2 p value guided notes
8.2 p value guided notes8.2 p value guided notes
8.2 p value guided notes
 
Hypothesis Madlibs
Hypothesis MadlibsHypothesis Madlibs
Hypothesis Madlibs
 
CIRCLE OR HIGHLIGHT the correct answer for the following questions.docx
CIRCLE OR HIGHLIGHT the correct answer for the following questions.docxCIRCLE OR HIGHLIGHT the correct answer for the following questions.docx
CIRCLE OR HIGHLIGHT the correct answer for the following questions.docx
 
General Psych, Ch. 7
General Psych, Ch. 7General Psych, Ch. 7
General Psych, Ch. 7
 
Work
WorkWork
Work
 
Why Do Sociologists Conduct Research
Why Do Sociologists Conduct ResearchWhy Do Sociologists Conduct Research
Why Do Sociologists Conduct Research
 
General Psych, Ch. 7
General Psych, Ch. 7General Psych, Ch. 7
General Psych, Ch. 7
 
Assessment Tool: Semantic Differential Scales
Assessment Tool: Semantic Differential ScalesAssessment Tool: Semantic Differential Scales
Assessment Tool: Semantic Differential Scales
 
NGR 7848 Fundamentals of Statistics for Clinicians Ho.docx
NGR 7848 Fundamentals of Statistics for Clinicians   Ho.docxNGR 7848 Fundamentals of Statistics for Clinicians   Ho.docx
NGR 7848 Fundamentals of Statistics for Clinicians Ho.docx
 
CA Database Scavenger Hunt pt. 1
CA Database Scavenger Hunt pt. 1CA Database Scavenger Hunt pt. 1
CA Database Scavenger Hunt pt. 1
 
Assessment 1 – Basics of Research and Statistics, Frequency Dist.docx
Assessment 1 – Basics of Research and Statistics, Frequency Dist.docxAssessment 1 – Basics of Research and Statistics, Frequency Dist.docx
Assessment 1 – Basics of Research and Statistics, Frequency Dist.docx
 
Assessment 1 – Basics of Research and Statistics, Frequency Dist.docx
Assessment 1 – Basics of Research and Statistics, Frequency Dist.docxAssessment 1 – Basics of Research and Statistics, Frequency Dist.docx
Assessment 1 – Basics of Research and Statistics, Frequency Dist.docx
 
Histograms and Descriptive Statistics Scoring GuideCRITERIANON.docx
Histograms and Descriptive Statistics Scoring GuideCRITERIANON.docxHistograms and Descriptive Statistics Scoring GuideCRITERIANON.docx
Histograms and Descriptive Statistics Scoring GuideCRITERIANON.docx
 
Module 01 – Basics of StatisticsClass Objectives· Define and ca.docx
Module 01 – Basics of StatisticsClass Objectives· Define and ca.docxModule 01 – Basics of StatisticsClass Objectives· Define and ca.docx
Module 01 – Basics of StatisticsClass Objectives· Define and ca.docx
 
Research Evaluation FormCCMH525 Version 32University of.docx
Research Evaluation FormCCMH525 Version 32University of.docxResearch Evaluation FormCCMH525 Version 32University of.docx
Research Evaluation FormCCMH525 Version 32University of.docx
 
Chapitre07_Solutions.pdf
Chapitre07_Solutions.pdfChapitre07_Solutions.pdf
Chapitre07_Solutions.pdf
 
Review all of all things methods related student
Review all of all things methods related studentReview all of all things methods related student
Review all of all things methods related student
 
1.What would be the appropriate statistical procedure to test t.docx
1.What would be the appropriate statistical procedure to test t.docx1.What would be the appropriate statistical procedure to test t.docx
1.What would be the appropriate statistical procedure to test t.docx
 

Más de leblance

Parent night contact&survey
Parent night contact&surveyParent night contact&survey
Parent night contact&surveyleblance
 
7.3 daqy 2
7.3 daqy 27.3 daqy 2
7.3 daqy 2leblance
 
10.3 part 1
10.3 part 110.3 part 1
10.3 part 1leblance
 
10.1 part2
10.1 part210.1 part2
10.1 part2leblance
 
10.1 part 1
10.1 part 110.1 part 1
10.1 part 1leblance
 
Ch 9 practice exam
Ch 9 practice examCh 9 practice exam
Ch 9 practice examleblance
 
5.4 synthetic division
5.4 synthetic division5.4 synthetic division
5.4 synthetic divisionleblance
 
5.4 long division
5.4 long division5.4 long division
5.4 long divisionleblance
 
9.3 Part 1
9.3 Part 19.3 Part 1
9.3 Part 1leblance
 
5.1 part 2
5.1 part 25.1 part 2
5.1 part 2leblance
 
9.2 lin reg coeff of det
9.2 lin reg coeff of det9.2 lin reg coeff of det
9.2 lin reg coeff of detleblance
 
Ch 8 review answers
Ch 8 review answersCh 8 review answers
Ch 8 review answersleblance
 

Más de leblance (20)

Parent night contact&survey
Parent night contact&surveyParent night contact&survey
Parent night contact&survey
 
7.3 daqy 2
7.3 daqy 27.3 daqy 2
7.3 daqy 2
 
7.3
7.37.3
7.3
 
7.1
7.17.1
7.1
 
7.2
7.27.2
7.2
 
10.3 part 1
10.3 part 110.3 part 1
10.3 part 1
 
10.2
10.210.2
10.2
 
10.1 part2
10.1 part210.1 part2
10.1 part2
 
10.1 part 1
10.1 part 110.1 part 1
10.1 part 1
 
Ch 9 practice exam
Ch 9 practice examCh 9 practice exam
Ch 9 practice exam
 
5.4 synthetic division
5.4 synthetic division5.4 synthetic division
5.4 synthetic division
 
5.4 long division
5.4 long division5.4 long division
5.4 long division
 
5.3
5.35.3
5.3
 
9.3 Part 1
9.3 Part 19.3 Part 1
9.3 Part 1
 
5.2
5.25.2
5.2
 
5.1 part 2
5.1 part 25.1 part 2
5.1 part 2
 
5.1[1]
5.1[1]5.1[1]
5.1[1]
 
9.1
9.19.1
9.1
 
9.2 lin reg coeff of det
9.2 lin reg coeff of det9.2 lin reg coeff of det
9.2 lin reg coeff of det
 
Ch 8 review answers
Ch 8 review answersCh 8 review answers
Ch 8 review answers
 

Paired t-test guide

  • 1. AP/H Statistics Guided Notes Mrs. LeBlanc – Perrone Name: ______________________________ Date: ___________ 8.4 Tests Involving Paired Differences (Dependent Samples) Paired Data o Many statistical applications use _______________________samples to draw conclusions about the _____________________________________________________________________.  Examples: Before and after situations ________________________________________ ________________________________________ o When a test involves comparing two populations for which the data occur in pairs, the proper procedure is to run a one-sample test on a single variable consisting of the differences from the paired data. 1
  • 2. AP/H Statistics Guided Notes Mrs. LeBlanc – Perrone Components of the Paired Test o Hypotheses  When testing the mean of the differences of paired data values, the null hypothesis states that “_____________________________________________________” ( )  The null hypothesis is always ___________________  The alternate hypothesis depends on the problem and can be: Left-Tailed Right-Tailed Two-Tailed o  ________________________________________________________________________  Take the measurements from one set– measurements of the other set, then find the mean (add up the differences and divide by the number of data pairs) This can be done in the calculator o Enter the “after” values in L1 o Enter the “before” values in L2 o Highlight L3, type L1 – L2, press ENTER (L3 should populate with the differences) o Hit Stat, tab over to calc, choose 1:1-Var Stats, use L3 hit ENTER   S o For paired difference tests, we make our decision regarding H0 according to the evidence of _______ o  ________________________________________________________________________ 2
  • 3. AP/H Statistics Guided Notes Mrs. LeBlanc – Perrone o Sample Test Statistic  o P-Value  ________________________________________________________________________ ________________________________________________________________________ 3
  • 4. AP/H Statistics Guided Notes Mrs. LeBlanc – Perrone How to Test Paired Differences Using The Student’s Distribution 1. ________________________________________________________________________  Do you have a random sample of matched data pairs?  Identify , and  Is the distribution normal, mound-shaped symmetrical, or is ? 2. State the null and alternate hypotheses, Identify the level of significance  3. ________________________________________________________________________  Sample Test Statistic: 4. ________________________________________________________________________  Use a T-test 5. ________________________________________________________________________  If P-value , we reject  If P-value > , we fail to reject 6. ________________________________________________________________________ 4
  • 5. AP/H Statistics Guided Notes Mrs. LeBlanc – Perrone Example: Paired Differences A team of heart surgeons at Saint Ann’s Hospital knows that many patients who undergo corrective heart surgery have a dangerous buildup of anxiety before their scheduled operations. The staff psychiatrist at the hospital has started a new counseling program intended to reduce this anxiety. A test of anxiety is given to patients who know they must undergo heart surgery. Then each patient participates in a series of counseling sessions with the staff psychiatrist. At the end of the counseling sessions, each patient is retested todetermine anxiety level. Table 8-8 indicates the results for a random sample of nine patients. Higher scores mean higher levels of anxiety. Assume the distribution of differences is mound-shaped and symmetric. From the given data, can we conclude that the counseling sessions reduce anxiety? Use a 0.01 level of significance. 5
  • 6. AP/H Statistics Guided Notes Mrs. LeBlanc – Perrone Summary Questions 1. Are data that can be paired independent or dependent? (Hint: we talked about independent and dependent in Chapter 7) ____________________________________________________________________________________ ____________________________________________________________________________________ ____________________________________________________________________________________ ____________________________________________________________________________________ 2. When testing the difference of means for paired data, what is the null hypothesis? What does it mean? ____________________________________________________________________________________ ____________________________________________________________________________________ ____________________________________________________________________________________ ____________________________________________________________________________________ 3. What elements of testing with P-values are consistent in every situation ( )? ____________________________________________________________________________________ ____________________________________________________________________________________ ____________________________________________________________________________________ ____________________________________________________________________________________ ____________________________________________________________________________________ ____________________________________________________________________________________ ____________________________________________________________________________________ ____________________________________________________________________________________ “HOT” Question: __________________________________________________________________________________________ __________________________________________________________________________________________ 6