Infographic software platform overview
•
0 recomendaciones•1,392 vistas

This document provides summaries of various infographic and visualization software platforms, including their descriptions, costs, and unique features. It summarizes 13 platforms: ChartsBin, Creately, Datameer, Dipity, Easel.ly, GeoCommons, Gliffy, Google Chart Tools, Google Public Data, Hohli, Infogr.am, Many Eyes. The platforms range from free web-based options to paid subscriptions and allow users to create a variety of visualizations like charts, maps, diagrams and timelines to share data.

Recomendados
Recomendados
Más contenido relacionado
La actualidad más candente
La actualidad más candente (20)
Destacado
Similar a Infographic software platform overview
Similar a Infographic software platform overview (20)
Último
Último (20)
Infographic software platform overview
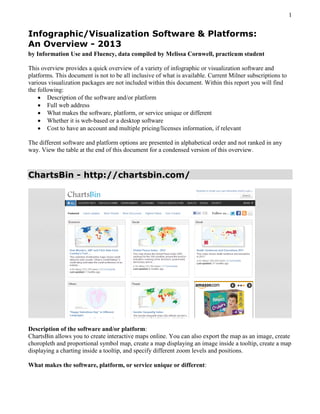
- 1. 1 Infographic/Visualization Software & Platforms: An Overview - 2013 by Information Use and Fluency, data compiled by Melissa Cornwell, practicum student This overview provides a quick overview of a variety of infographic or visualization software and platforms. This document is not to be all inclusive of what is available. Current Milner subscriptions to various visualization packages are not included within this document. Within this report you will find the following: Description of the software and/or platform Full web address What makes the software, platform, or service unique or different Whether it is web-based or a desktop software Cost to have an account and multiple pricing/licenses information, if relevant The different software and platform options are presented in alphabetical order and not ranked in any way. View the table at the end of this document for a condensed version of this overview. ChartsBin - http://chartsbin.com/ Description of the software and/or platform: ChartsBin allows you to create interactive maps online. You can also export the map as an image, create choropleth and proportional symbol map, create a map displaying an image inside a tooltip, create a map displaying a charting inside a tooltip, and specify different zoom levels and positions. What makes the software, platform, or service unique or different:
- 2. 2 This platform allows you to create visualizations out of your own data without any installation of software. You can also embed the interactive visualizations in your own website or blog, or export them as images for a presentation. You can also embed the interactive visualizations in social media websites. Web-based or Desktop: web-based Cost to have an account: Free for now. Multiple pricing/licenses options: NA Creately - http://creately.com/ Description of the software and/or platform: Creately is a diagram, wireframe, and web design tool that does not require a download or install. The software allows you to create flowcharts, wireframes, UML diagrams, mindmaps, and many other kinds of diagrams. The software is available to use online (through the browser), and you can try it out for free. It also comes in a desktop software package that you can purchase. There is also Creately for the server, in which you can install the software on your own server and this will enable everyone in the organization or institution to draw and collaborate either by accessing the software via the browser or using the desktop version. Creately also serves as a plug-in for various other programs, such as FogBugz, Confluence, and Jira. In particular with the Confluence plug-in, you can add the diagrams you create wiki pages and blogs. What makes the software, platform, or service unique or different: Creately allows for real-time team collaboration, sharing, and the ability to review and leave comments on projects. The software for specifically the server to ensure collaboration across an organization is unique. Creately is also available in the Google Apps marketplace. Also, you can have collaboration between the desktop software and online platform.
- 3. 3 Web-based or Desktop: Both Cost to have an account: Online is subscription-based with a certain amount due each month depending on how many people are going to be expected to use it. Users can create a free, public account, but they are limited to only 5 public diagrams, 1 project, and 3 collaborators. The plans go up to a team of 25 people for $75 a month or $749 per year. Users could also create a personal account that allows for unlimited public and private diagrams as well as unlimited projects; the personal account is $5 a month or $49 per year. The desktop software costs $75 for unlimited offline and online diagramming. There is also the option for desktop for teams that cost $40 per user. There are also deals for more users in a team: 5 users ($349), 10 users ($649), 25 users ($1299), 50 users ($2499), 100 users ($3999), and an enterprise has to call for a quote. Multiple pricing/licenses options: Prices for Online: Personal (1 user) - $5 a month/$49 per year Team (5 users) - $25 a month/$249 per year Team (10 users) - $45 a month/$449 per year Team (25 users) - $75 a month/$749 per year Public (1 user, limited features) – Free Prices for Desktop: Desktop Personal- $75 Desktop for Teams- $40 per user Team (5 users) - $349 Team (10 users) - $649 Team (25 users) - $1299 Team (50 users) - $2499 Team (100 users) - $3999 Datameer - http://www.datameer.com/
- 4. 4 Description of the software and/or platform: Datameer provides a single application on the Hadoop platform for data integration, data analytics and data visualizations. The steps include data integration, dynamic data management, and self-service analytics. With data integration, you just have to load raw data of any type, size, or source, and the data can come from either structured sources (Oracle, MySQL, etc.) or unstructured sources (like Twitter, Facebook, Linkedin, etc.). For creating infographics, you would use the drag and drop, WYSIWYG Infographic Designer. Datameer also has a library of widgets that includes tables, graphs, charts, diagrams, maps, and tag clouds. What makes the software, platform, or service unique or different: A unique feature of this platform is the ability to “liberate your data” and use both structured and unstructured sources for gathering data on users/customers. Also, there is the ability to share your data visually on any device. The application also scales with your needs, and you choose where you want to store and analyze your data. Datameer also uses HTML 5 in its design. Workgroup space: http://www.datameer.com/datavis-workgroup.html Web-based or Desktop: Both Cost to have an account: Personal account (1 desktop) - $299/year Workgroup (1 server) - $2,999/year Enterprise (1 hadoop cluster) – Have to request a quote Multiple pricing/licenses options: The Enterprise package is priced on a data plan model of how much new data is brought into Datameer in a given year. There is no mention of an educational discount. Dipity - http://www.dipity.com/
- 5. 5 Description of the software and/or platform: Dipity is an online platform for creating digital timelines. “Users can create, share, embed, and collaborate on interactive, visually engaging timelines that integrate video, audio, images, text, links, social media, location and timestamps.” You can create a free account with limited features or pay for a Dipity Premium account. Dipity Premium, which is any other package than the free account, may offer custom branding and backgrounds, multi-user support, stats and analytics, custom iPhone Apps, and hosting by Dipity. What makes the software, platform, or service unique or different: This service is unique because it integrates many different types of multimedia on a timeline feature. You can also embed the timeline in your own website to increase user engagement. You can make multiple interactive timelines, depending on what version or package you want to purchase, and synchronize content from a wide variety of social media sources. The site allows you to sign in with your Facebook account. Web-based or Desktop: web-based Cost to have an account: Personal- Free Plus- $4.95/month Prime- $49.95/month Pro- $99.95/month Partner- contact for price Multiple pricing/licenses options: NA Easel.ly - http://www.easel.ly/
- 6. 6 Description of the software and/or platform: Easelly is an online website/platform for creating and sharing visual ideas online. To create a vheme (visual theme), you drag and drop a vheme onto your canvas. What makes the software, platform, or service unique or different: This product is still in the beta stage, and so it does not have a lot of features yet. Web-based or Desktop: web-based Cost to have an account: Free (?) Multiple pricing/licenses options: NA GeoCommons - http://geocommons.com/ Description of the software and/or platform: GeoCommons is an online, public community site for open data and maps. The users of the site are intent on building an open repository of data and maps for the world. You can create map visualizations using GeoIQ’s simple workflow and exploration capabilities. You can also animate your data through time and space with the one-click temporal analysis. You can also share your visualizations on Facebook, Twitter, or embed them in your blog. GeoCommons provides a full data upload and a search feature to easily share data with the world; they also automatically calculate statistics for your data and convert it to a dozen different formats. You can also view, edit, and track the usage of your data. There are also filtering options by number, string, or data attributes. What makes the software, platform, or service unique or different:
- 7. 7 This platform is unique because you can just start putting in data through the home page of the website and get a map back in minutes. There are options to upload data or make a map. You can also share your visualizations through Facebook or put them on your blog. There is also the emphasis on open data and maps, and sharing that data with a public community. There is also a freely available API that is built on the GeoIQ platform that you can use to build dashboards and web applications. Web-based or Desktop: web-based and API Cost to have an account: Free for the online version, but there is also an option for GeoIQ Enterprise, which is the same platform that powers GeoCommons but has many additional features for collecting social, local and mobile data. The GeoIQ software comes in many different packages. Multiple pricing/licenses options: Please see http://www.geoiq.com/products/ for information on the different software packages and features. Gliffy - http://www.gliffy.com/ Description of the software and/or platform: Gliffy is an online diagram and flowchart application that you can use to create, share, and collaborate on diagrams. You can create diagrams, drawings, process flows, interfaces, and designs. Gliffy stores and backs up your documents on their servers. You use the software by dragging and dropping shapes from the library and formatting the diagrams by point-and-click. What makes the software, platform, or service unique or different: This software is unique in the amount of different diagrams you can create and the ways in which you can share them. You can embed your images and diagrams into wikis, blogs, and other hosted office applications. You can also save and export your diagram as a .JPG, .PNG, or .SVG. You can also invite
- 8. 8 others to collaborate on the diagrams. Gliffy also automatically keeps a copy every time a document is saved so you can track changes or revert to an earlier version. The API, which you can add to your existing web based applications. Examples of this include creating drawings in wiki pages, including Gliffy in your blog software, and add drawings to your content management system. Web-based or Desktop: web-based (works through your web browser). Gliffy also offers an API. Cost to have an account: Free Basics Account and Paid-Full Feature Accounts Multiple pricing/licenses options: The paid-full feature accounts, especially multiuser accounts, are billed monthly. Free Basic Account Standard Account – Individual ($4.95/user/month) and $49.50/user/year Pro Account- Individual ($9.95/user/month) and $9.95/user/year There are discounted rates available for academic institutions. Currently, Gliffy offers a 50% discount for groups of academic users (starting at $12.50/month for 5 users). However, they do not offer discounted rates for premium, individual academic use. You would have to upgrade to premium to have multiuser accounts. See this link for choosing which Gliffy account is right for your classroom: http://support.gliffy.com/entries/463410-options-for-using-gliffy-in-a-classroom. Google Chart Tools - https://developers.google.com/chart/ Description of the software and/or platform: Google Chart Tools allows you to create charts for your websites. To build these charts, you must go through a series to steps such as choosing a chart from the Chart Library, populating the chart with data using a common JavaScript DataTable class. Google Chart Tools provides a step-by-step manual for building charts and embedding them into your website. Some of the charts offered are area charts, bar
- 9. 9 charts, bubble charts, column charts, gauge charts, pie charts, scatter charts, and many others. You can also easily customize your charts to fit your needs. What makes the software, platform, or service unique or different: Google Chart Tools provides a step-by-step manual for creating a chart specifically for your website’s needs. Also, the charts are based on pure HTML5/SVG technology so there are no plugins required to embed or view your charts. Charts are also fully customizable. Web-based or Desktop: web-based API Cost to have an account: Completely free for all uses: commercial, governmental, personal, or educational. Multiple pricing/licenses options: NA Google Public Data - http://www.google.com/publicdata/directory Description of the software and/or platform: Google Public Data is a free source of open data and graphs; it provides public data and forecasts from a range of international organizations and academic institutions including the World Bank, OECD, Eurostat, and the University of Denver. The data can be displayed and exported as line graphs, bar graphs, cross-sectional plots, or as maps. The Google Public Data Explorer makes the public-interest datasets easy to explore, visualize, and communicate. You can also play with the tool to create visualizations of public data, link to the, or embed them in your own webpages. What makes the software, platform, or service unique or different: This platform is unique in that you can manipulate, export, and share the public data. You can also upload different formats of data, and you can also upload, visualize, and share your own datasets.
- 10. 10 Web-based or Desktop: web-based Cost to have an account: Free (has to be a Google account though) Multiple pricing/licenses options: NA Hohli - http://charts.hohli.com/ Description of the software and/or platform: Hohli is an online charts builder where you just upload the data on the webpage, set a data max value, give the chart a title, and set the range for the axes; you also need to set the size for your chart, and choose whether it’s going to be horizontal, vertical, or square. You can also set a background image for your chart. The types of charts you can create are line, bar, and pie graphs. You can also make Venn diagrams, scatter plots, and radar charts. The company behind this is Google, and it is Google Charts API that allows you to create the charts. What makes the software, platform, or service unique or different: What makes this platform unique is that you can just add your data on the webpage and even manipulate the chart to make it look like you want it to. Your chart will be created as you enter information so that you can see how the new data you add affects the chart. When you are done with your chart, you can either save it to your computer or use the embed code to add it to a blog or website. Web-based or Desktop: Web-based Cost to have an account: Free Multiple pricing/licenses options: NA
- 11. 11 Infogr.am - http://infogr.am/ Description of the software and/or platform: Infogram is online platform for creating interactive infographics and charts. The process of creating an infographic includes selecting a template from Infogram’s selection, adding your own data, customizing the graphic, and then sharing it via Twitter, Facebook, and Pinterest, or viewing it on the web. For creating online charts, you can import data from Microsoft Excel or CSV and then edit it with Infogram’s online Excel compatible spreadsheet. Then, you can embed the charts you make in articles or share them on social networks. What makes the software, platform, or service unique or different: I think the social networking capabilities of this software are what make it unique. You can share any of the infographics you make on Twitter, Facebook, or Pinterest, or even publish them separately on the web. You can also log into Infogram with your Twitter of Facebook account information. Another feature of this platform is that you can add Vimeo and YouTube videos or also create interactive maps. Also, the use of templates for infographics might also make this platform unique depending on what templates are available. Web-based or Desktop: web-based Cost to have an account: Nothing, it’s free. Multiple pricing/licenses options: NA
- 12. 12 Many Eyes - http://www-958.ibm.com/software/data/cognos/manyeyes/ Description of the software and/or platform: Many Eyes is an experiment being performed by IBM Research and the IBM Cognos software group. Many Eyes allows you to view and discuss visualizations and data sets; you can also create visualizations from existing data sets. After you make an account and register, you can also upload your own data, create and participate in topic centers (a topic center is a page devoted to a topic or theme), watch items, track your contributions to the site, and see comments others have written. What makes the software, platform, or service unique or different: This software and program is unique because it is just in the experimental phase, but it is essentially social networking over visualizations and data sets. You can also share whatever visualizations you’ve created on Twitter and Facebook. You can delete any data set you’ve uploaded, and other users can use your data to make new visualizations. You can upload data by cutting and pasting from spreadsheets or tab-delimited text files, or by cutting and pasting from word processing files. Many Eyes also has many different options for different types of visualizations, including analyze a text. For data, the format has to be either text or numbers. Web-based or Desktop: Web-based Cost to have an account: There is no cost to have an account, and the registration is free. However, because it is an experiment, none of the data sets or visualizations you create are considered confidential. Multiple pricing/licenses options: NA
- 13. 13 Photo Stats - http://photostatsapp.com/ Description of the software and/or platform: Photo Stats is an infographic creator for the iPhone. The software is an app for the iPhone that you can purchase from the iTunes store. How it works is you chose a time range of photos to be analyzed and then choose the visual theme of your infographic from a list of pre-selected themes. Your photo can say how, when, and where you take photos with the iPhone. What makes the software, platform, or service unique or different: This software is unique because it is app-based for Apple products. The app works on the iPhone, iPod Touch, iPad, and the iPad mini. However, it is optimized for iPhone 5. Web-based or Desktop: Neither (app-based) Cost to have an account: $0.99 for the app Multiple pricing/licenses options: NA
- 14. 14 Piktochart - http://piktochart.com/ Description of the software and/or platform: Piktochart is an online platform where you can create infographics and charts. The platform serves as a creator and an editor of infographics with a drag and drop feature, and provides a collection of design themes. The platform has just moved to a new design called the Magical App, and you can get a free account with limited features or pay for either the Monthly Pro or Annual Pro packages, which provide additional features. What makes the software, platform, or service unique or different: This platform is unique because it serves as both a creator and editor for infographics. Also, with the free version, any Piktochart image you export comes with a watermark (while the Pro version allows you export just the image). The Pro version comes with the ability to create bar charts, line charts, bubble charts, and pie charts as well as infographics. The platform also makes your exported graphics search-engine friendly, and you can share your infographics on Facebook and Twitter. Web-based or Desktop: web-based Cost to have an account: Free (for casual users) Monthly Pro- $29 (usually for professional users) Annual Pro- $169 (for professionals, agencies, brands) Multiple pricing/licenses options: Free (for casual users) Monthly Education Price - $3.33 per month Annual Education Price- $39.00 This is also an option for a school bulk subscription starting from $1/month/student for school-wide subscriptions.
- 15. 15 Stat Silk - http://www.statsilk.com/ Description of the software and/or platform: The software comes in different packages that have different functionalities. The software is divided into three major packages: StatPlanet, StatTrends, and StatWorld. StatPlanet comes in three different platforms: StatPlanet, StatPlanet Plus, and StatPlanet Lite. StatTrends comes in two different platforms: StatTrends and StatTrends Plus. StatWorld comes in two platforms: StatWorld and StatPlanet World Bank. StatPlanet is free, and allows you to create interactive maps, graphs, and charts; StatPlanet Lite allows you to create a simple interactive map with more basic features, and StatPlanet Plus gives support for large data sets and importing and exporting maps. StatTrends is a free web-based or desktop application that allows you to embed charts and graphs into webpages and websites; you can use Excel or other spreadsheet software to import data. StatTrend Plus allows for greater support of large data sets, export options, and a custom logo. StatWorld provides maps of open data in an interactive environment; you can choose which maps of data you want to see and the indicators by which you want to view the data. StatPlanet World Bank allows direct access to search around 5,000 indicators of open data, and this feature comes as a desktop app. What makes the software, platform, or service unique or different: This software is unique because of the different levels that are available and that most of the software is free. The free software offers really great features even without choosing the upgraded versions. StatPlanet also has an experimental map creator, which allows data to be copied and pasted directly into it. StatPlanet comes with World and USA maps, and even a template to make your own flash maps. With StatTrends, you can create bar and column charts, scatter plots or bubble carts, time series graphs, or bullet graphs and embed them in websites. There is also the play time-based animation feature for all chart and graph types. With StatTrends, you can also insert or import data from Excel. StatPlanet is unique because you are allowed to interact with open data, but also you can create graphs to compare
- 16. 16 different data from different countries. StatWorld is a great tool to use for creating graphs from already pre-collected data. Web-based or Desktop: Both Cost to have an account: StatPlanet- Free StatPlanet Lite- Free StatTrends- Free StatWorld- Free StatPlanet World Bank- Free StatTrends Plus- see table below StatPlanet Plus- see table below Multiple pricing/licenses options: There has been no mention on the site of an educational discount. StatPlanet Plus: Prices listed are for one edition of StatPlanet Plus. The license is valid forever (it never expires) and is valid for one web domain (the web-version is licensed for usage only a single web domain). There is no limitation to how many times it can be used within that web domain. The upgrade cost is for a one-time upgrade only. StatTrends Plus: Prices are listed for a license; the license is valid forever and is valid for only web domain (for the web-version). The upgrade cost is for a one-time upgrade only. StatPlanet Plus StatTrends Plus Non-commercial license (USD) Commercial license (USD) Non-commercial license (USD) Commercial license (USD) Desktop version: Free 595 Desktop version: Free 395 Web version: 395 595 Web version: 250 395 Upgrade: 250 350 Upgrade: 150 250
- 17. 17 Tableau Public - http://www.tableausoftware.com/public/ Description of the software and/or platform: Tableau Public is a free tool that you can use to create interactive visualizations with your data. You can then post whatever visualizations you create on the web. Once the data is published on the web, anyone can interact with it, download it, or create visualizations of it. There is no programming skills needed either. Tableau Publish includes a free desktop product that you can download and use to publish data, and the data is saved to the Tableau Public web servers and not saved locally on your computer. You can share the data on your blog, website, etc. What makes the software, platform, or service unique or different: This platform is unique in that it is a free and focuses primarily on creating free data that can be shared by everyone. Also, all the data saved to Tableau Public will be accessible by everyone on the internet, so you have to make sure that you work only with publically available and appropriate data. There is also a 50 megabyte limit on storage space for data. Web-based or Desktop: Desktop Cost to have an account: Free for the Public Edition. Organizations can also use the software but only as an introductory service. If an organization wants to put data online for the public, you can do it as an introductory service. You can contact Tableau public to discuss a commercial relationship. There are also Professional and Personal editions of the desktop software. Multiple pricing/licenses options: Tableau Desktop comes in three editions. Professional Edition ($1,999), Personal Edition ($999) and the Public Edition (Free).
- 18. 18 Timeline JS - http://timeline.verite.co/ Description of the software and/or platform: Timeline JS allows you to create online timelines using features of a JavaScript Library. The software pulls in media from different sources, and has built in support for Twitter, Flickr, Google Maps, YouTube, Vimeo, Dailymotion, Wikipedia, SoundCloud, and many other media types. What makes the software, platform, or service unique or different: This software is unique because it allows you to pull data from different online media sources. You can also upload data from Google spreadsheets, and you can embed your timeline on your site. The online platform comes with a tool to help prepare your timeline to be embedded (called the Timeline JS Embed Generator). You can also build your timeline in a Google Docs spreadsheet or in JSON. The site even provides a Google Doc template. Web-based or Desktop: web-based Cost to have an account: Free Multiple pricing/licenses options: NA
- 19. 19 Venngage - https://venngage.com/ Description of the software and/or platform: Venngage is an online-based platform for creating detailed reports. There is no design or analytics experience necessary to use the platform. Venngage allows you create a report within minutes of uploading your data. Also, there is a security system in place so that your data and reports will be encrypted and accessible only to you and your team. There is also a collection of templates to choose from that have been built for communicating data and information. The steps are as simple as selecting your layout, dragging and dropping items, and saving and publishing data. What makes the software, platform, or service unique or different: This platform is unique because it is specifically used to create reports. Also, there is the ability to incorporate data from 3rd party sources such as Google Analytics, Bitly, and Facebook. There is also a Venngage app that you can use to show your reports via iPad. Web-based or Desktop: web-based Cost to have an account: Yes Multiple pricing/licenses options: The pricing starts at $1,000 a month for agencies and enterprises. The features included for Agency and Enterprise are: Agency 5 Publishing Users Share with unlimited clients 50 Report Exports a Month Excel upload of up to 50MB
- 20. 20 Highlight campaign results with interaction Access to 3rd party data sources such as Google Analytics, Bitly, and Facebook Access to direct support hotline Whitelabel reports for clients iPad app Enterprise Team Collaboration Database integration Unlimited report exports Drill down and filter capabilities Customization Access to 3rd party data sources such as Google Analytics, Bitly, and Facebook User privilege settings Access to direct support hotline iPad app Visual.ly - http://visual.ly/ Description of the software and/or platform: Visually is an online platform for creating interactive infographics, data visualizations, and motion graphics. To create an infographic, you need to choose one you want to customize from the gallery. Then, you have to connect to Twitter or Facebook and authorize the Create app. Then, you customize the infographic by selecting the accounts, hashtags, or pages that you want to explore. The platform’s main function is to make it easier for buyers and sellers of infographics to get them made, distributed, liked, commented on, and shared. The whole theme of the company is telling stories with data. What makes the software, platform, or service unique or different:
- 21. 21 The platform is designed to share and socially interact with infographics. The site offers infographics divided by topics, and they offer services specifically for creating infographics for agencies, brands, organizations, and businesses. You can use personally use Visually in three different ways: as a fan (which is just creating and exploring infographics; as a designer (where you post your work and want to be considered for projects throughout the marketplace); and as a publisher (you would like to share work and you may be looking for hire data viz talent for projects). The most unique feature of this platform is the ability to share whatever infographics you make on numerous social networking sites. However, you can also download the infographics you create as PNG files. You also need a Twitter or Facebook account to authorize the creation of the infographic. Web-based or Desktop: web-based Cost to have an account: Free Multiple pricing/licenses options: NA (need to contact them for information) What About Me? - http://www.intel.com/content/www/us/en/what-about-me/what-about-me.html Description of the software and/or platform: What About Me? is a product offered by Intel for creating an infographic of your digital life. This software is particularly social as you can add your Twitter or YouTube profile and also connect with Facebook. When you login with your Facebook account, it shows up as an app. The app takes data from your basic information, email address, profile information, your photos, your status updates, friends’ descriptions, friends’ birthdays, and photos shared with you. What makes the software, platform, or service unique or different:
- 22. 22 This software is unique because it is solely for gathering data from social networking sites and then creating an infographic from that data to show a person’s interests, activities, etc. Web-based or Desktop: web-based Cost to have an account: Free but you need a Facebook, YouTube, or Twitter account to participate. Multiple pricing/licenses options: NA
- 23. 23 Infographics Analysis Table C: 1 - with webpages; 2- for some data DM: 1- with Workgroup; 2 - in the form of widgets GPD: 1 - free; 2 - has pre-determined options GC: 1 -for more advanced services; 2 - for some data GL in a library H has pre-determined options ME: using existing data PC: with the Pro version PS: iPhone app SS: for some data V: for some data Name As Web-based (WB) or Desktop (D) Group Services and Prices Educational Discount Allows Group Collaboration Sharing Capabilities With Other Sites Uses Pre- Determined Templates Uses Open and Public Data ChartsBin WB No No NA Yes Sort of No Creately WB, D Yes NA Yes YesC-1 () YesC-2 No Datameer WB, D Yes NA YesDM-1 NA YesDM-2 No Dipity WB NA No Yes Yes No No Easelly WB No No NA NA Yes No GeoCommons WB YesGC-1 NA NA Yes YesGC-2 Yes Gliffy WB Yes Yes Yes Yes YesGL No Google Chart Tools WB NA NA Yes Yes Yes No Google Public Data WB YesGPD-1 NA Yes Yes NoGPD-2 Yes Hohli WB No No No Yes NoH No Infogram WB NA NA No Yes Yes No Many Eyes WB No No NA Yes YesME Yes Photo Stats NAPS No No No Yes Yes No Piktochart WB Yes Yes YesPC Yes Yes No Stat Silk WB, D Yes NA NA Yes YesSS Yes Tableau Public D Yes No Yes Yes NA Yes Timeline JS WB NA NA NA Yes No No Visually WB Yes NA No Yes YesV No Venngage WB Yes No Yes NA Yes No What About Me? WB No No No Yes NA No