Finding Your Path to Value
•
0 recomendaciones•347 vistas

Building upon Kirkpatrick's 4 Levels of Evaluation with Agile Change Management Techniques to Improve Business Impact

Recomendados
Recomendados
Más contenido relacionado
La actualidad más candente
La actualidad más candente (20)
Destacado
Similar a Finding Your Path to Value
Similar a Finding Your Path to Value (20)
Más de Elizabeth Woodward
Más de Elizabeth Woodward (9)
Último
Último (20)
Finding Your Path to Value
- 1. Building upon Kirkpatrick's 4 Levels of Evaluation with Agile Change Management Techniques to Improve Business Impact Finding Your Path to Value 200 Vesey St - Brookfield Place - New York, NY 10281-1017 info@cgsinc.com
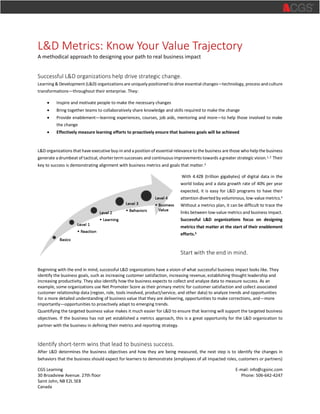
- 2. Building upon Kirkpatrick's 4 Levels of Evaluation with Agile Change Management Techniques to Improve Business Impact Finding Your Path to Value SUCCESSFUL L&D ORGANIZATIONS HELP DRIVE STRATEGIC CHANGE. Learning & Development (L&D) organizations are uniquely positioned to drive essential changes—technology, process and culture transformations—throughout their enterprise. L&D organizations that have executive buy-in and a position of essential relevance to the business are those who help the business generate a drumbeat of tactical, shorter term successes and continuous improvements towards a greater strategic vision.1, 2 Their key to success is demonstrating alignment with business metrics and goals that matter.3 With 4.4ZB (trillion gigabytes) of digital data in the world today and a data growth rate of 40% per year expected, it is easy to be diverted by voluminous, low-value metrics.4 Without a metrics plan, it can be difficult to trace the links between low-value metrics and business impact. Augmenting Kirkpatrick's Four Levels of Evaluation with Agile change management techniques can help organizations to deliver greater impact. Successful organizations partner with the business to: • Inspire and motivate people to make the necessary changes • Bring together teams to collaboratively share knowledge and skills required to make the change • Provide enablement—learning experiences, courses, job aids, mentoring and more—to help those involved to make the change • Effectively measure learning efforts to ensure that business goals will be achieved .75” 1 LEVEL 4 Business Value LEVEL 3 Behaviors LEVEL1 Reaction LEVEL2 Learning Basics Successful L&D organizations focus on designing metrics that matter at the start of their enablement efforts.5 START WITH THE END IN MIND. Beginning with the end in mind, successful L&D organizations have a vision of what successful business impact looks like. They identify the business goals, such as increasing customer satisfaction, increasing revenue, establishing thought leadership and increasing productivity. They also identify how the business expects to collect and analyze data to measure success. As an example, some organizations use Net Promoter Score as their primary metric for customer satisfaction and collect associated customer relationship data (region, role, tools involved, product/service, and other data) to analyze trends and opportunities for a more detailed understanding of business value that they are delivering, opportunities to make corrections, and—more importantly—opportunities to proactively adapt to emerging trends. QuantifyingthetargetedbusinessvaluemakesitmucheasierforL&Dtoensurethatlearning will support the targeted business objectives. If the business has not yet established a metrics approach, this is a great opportunity for the L&D organization to partner with the business in defining their metrics and reporting strategy. IDENTIFY SHORT-TERM WINS THAT LEAD TO BUSINESS SUCCESS. After L&D determines the business objectives and how they are being measured, the next step is to identify the changes in behaviors that the business should expect for learners to demonstrate (employees of all impacted roles, customers or partners) in order to achieve the targeted business results. Directly asking the question “What changes will you need to see in order to know that you’re on the right track to meet your goals?” can help L&D to understand the expectations of the business. Exploring the state of the art related to achieving the business goals and behaviors by researching academic studies, industry examples, industry success stories, trends and pockets of success within their own enterprise enables L&D organizations to add value and guide the business in their strategy. ,, ,, What changes will you need to see in order to know that you’re on the right track to meet your goals? Kirkpatrick's Four Levels of Evaluation
- 3. .75” 2 Building upon Kirkpatrick's 4 Levels of Evaluation with Agile Change Management Techniques to Improve Business Impact Finding Your Path to Value MEASURE BEHAVIORS USING TRADITIONAL AND CREATIVE METHODS. For each demonstrable behavior, L&D will need to define an approach to measure that behavior. Observing employees in action and rating the degree to which they exhibit the behaviors is a traditional way to measure. For example, call center coaches or team leads may listen in on a support call and use a checklist while observing whether the call center employee greeted the customer according to guidelines, asked the right questions, empathized with the customer’s situation, gave appropriate guidance and correctly completed activity reports. In some cases, detecting behaviors can be automated within systems. As an example, one company wanted to improve the quality of their software. They worked with developers to ensure that they were developing unit tests to cover the functionality of code. By integrating automated code coverage analysis into the code check-in process, they were able to determine the percentage of code that had unit tests. The automated process enabled the L&D organization to determine the degree to which individuals were performing unit testing. Additional automated tests helped the different teams to assess the quality of the code that they delivered and to address issues earlier in the process. These “in process” metrics helped the business to determine if they were on track for meeting the overall goal of improved software quality. Gamification is another exciting approach for measuring on-the-job behaviors, as well as motivating learning. In one example of a “tournament” approach, each time a customer service representative successfully resolves a customer issue using learned techniques, they self-report and/or peer-report the behavior which leads to various levels of management recognition. By taking creative approaches to measuring behaviors, L&D can help the business to demonstrate progress towards meeting business goals. INCLUDE PRE-ASSESSMENTS AND CONFIRMATION OF LEARNING QUESTIONS. Once you know what behaviors are indicators that you will impact the business value targeted by your business strategy, consider how you will measure whether learners have mastered the knowledge and skills to later demonstrate those behaviors. Consider providing quick pre-assessments in addition to confirmation of learning checks. In an organization with 20,000 people, wasting just 10 minutes per person on irrelevant or unnecessary learning quickly adds up to more than a full year (417 days) of lost productivity! GO BEYOND THE SMILE SHEET TO PREDICT BEHAVIORS. It’s common to include a feedback form (aka “smile sheet”) to determine if learners thought content, presentation and instructors were effective. One additional valuable question to ask beyond the typical smile sheet questions is, “Do you believe that you will be able to use what you learned on the job?” This key question can provide an indicator of subsequent behavior. It also provides early insight that can help you to adapt quickly and make your learning program more effective. APPROPRIATELY LEVERAGE LOWER LEVEL DEMOGRAPHICS AND ACCESS DATA. Continuing to work backwards along the value trajectory, the last data set to consider is the digital learning data. This is where so many organizations spend the greatest amount of time, but where the least value tends to reside. E-meetings, Learning Management Systems, Web sites, Webinars, Videos and other digital learning solutions can typically provide you with information about participation, page hits and visits, time spent, demographics (provided they registered), and more. This can help demonstrate to the business that you are reaching the right units, divisions, roles, skill levels, regions and other demographics. BE SURE YOUR STRATEGY LINKS DATA ACROSS THE VALUE TRAJECTORY. When designing your metrics plan for basic data, be sure to identify how you will link data across the different levels of metrics. Use a common identifier, such as employee ID, if possible. If privacy concerns are an issue, alternatives to exposing employee IDs include generating a separate key, or if necessary, using group metrics instead. Identify and address any data issues early. It can be very challenging to try to determine how data sets at different levels tie together for important analysis when linkage has not been designed into the metrics strategy. READY. SET. GO! DEFINE YOUR OWN VALUE TRAJECTORY. By establishing your value trajectory, you can demonstrate short term results leading to longer term strategic business impact. By working with management that owns the business objectives, you establish a sense of comfort and trust that L&D are aligned with business objectives that matter. What are your end business goals and how will you demonstrate to the business that they are making progress towards achieving those goals through their learning enablement efforts? See Table 1 for an example of a simplified value trajectory for the business goal of “increasing revenue related to cross-selling.”
- 4. .75” 3 Building upon Kirkpatrick's 4 Levels of Evaluation with Agile Change Management Techniques to Improve Business Impact Finding Your Path to Value TABLE 1. VALUE TRAJECTORY EXAMPLE: INCREASING REVENUE RELATED TO CROSS-SELLING. Learning Activities and Deliverables Basics Reaction Learning Behaviors Business Impact Cross-Selling 101 Blended Learning 4Q 98% of target audience participation Standard Smile Sheet + “ How likely are you to apply this on the job? ” >80% scored assessment: * Identifies decision- maker * Identifies cross-sell * Identifies benefits * Identifies techniques for overcoming objections >80% Live Call Assessment: * Identifies decision- maker * Successfully cross- sells * Verbalizes benefits * Uses techniques to overcome objections Increase revenue related to cross- selling by 5% Downloadable Job Aids – Add Biweekly # downloads Simple NPS for assets. Target > 0 Questions integrated into Trivia Game >80% correct Sample audio files - Add Biweekly # accesses Simple NPS for assets. Target > 0 >80% on Call analysis sheet Discussion threads – Seeded weekly # discussion threads and updates Average 4 star rating for responses Questions integrated into Trivia Game >80% correct Cross-selling mobile Trivia Game # accesses All regions, divisions, teams Simple NPS for game >85% avg correct for Cross-selling topic Cross-selling Tournament # accesses All regions, divisions, teams Simple NPS for tournament N/A >20% increase in tournament points over starting point
- 5. .75” 4 Building upon Kirkpatrick's 4 Levels of Evaluation with Agile Change Management Techniques to Improve Business Impact Finding Your Path to Value 200 Vesey St - Brookfield Place - New York, NY 10281-1017 Email: info@cgsinc.com REPORTING As elements of the metrics strategy are finalized, it is important to consider how you are going to report on progress so that all stakeholders are aware of what’s required to meet the business objectives. In the best case, L&D works with the business to design and implement an “information radiator”—a resource that depicts progress across the value trajectory at a glance. This resource can be as simple as a Web page that is manually updated with statistics on low level demographics and the current state of Level 1-4 metrics. Preferably, the information radiator updates in real-time, automatically collecting the required data on a scheduled frequency or on demand. Ideally, the information radiator should offer a simple report depicting measured results that are appropriate to each stakeholder role at any point in time without causing them to get bogged down in superfluous data noise. In addition to the simple information radiator, providing the ability for stakeholders to drill down into more detailed views of the data can help them to interpret results and adapt the learning approach. Figure 1 provides an example of using Tableau for more detailed and visual reporting. SUMMARY L&D organizations that demonstrate how learning experiences help the business achieve their business goals are more likely to be viewed as a trusted partner rather than a cost center. Gaining buy-in as a trusted partner is achieved by designing and implementing a metrics and reporting strategy that allows the business to view progress at each level of evaluation and to adaptively reduce risks, so that the business can be more confident that they will achieve their goals. SOURCES 1 Mass, J., Marshalik, J., Cooper, A., & Woodward, E. (2015, April 9). Driving Organizational Change through Learning and Development. Retrieved from Human Capital Institute: http://www.hci.org/lib/ driving-organizational-change-through-learning-and-development#ondemand 2 LeStage, G. (2015, March 5). How Have Kotter's Eight Steps for Change Changed? Retrieved from Forbes Leadership: http://www.forbes.com/sites/johnkotter/2015/03/05/how-have-kotters-eight-steps- for-change-changed/ 3 Woodward, E., Bowers, R., Thio, V., Johnson, K., Srihari, M., & Bracht, C. (2010). Agile Methods for Software Transformation. IBM Journal of Research and Development. http://researchweb.watson.ibm. com/journal/rd54-2.html 4 IDC. (2014, April). The Digital Universe of Opportunities: Rich Data and the Value of the Internet of Things. Retrieved from EMC: http://www.emc.com/leadership/digital-universe/2014iview/digital- universe-of-opportunities-vernon-turner.htm 5 Based on Kirkpatrick, D.L., & Kirkpatrick, J.D. (2007). Implementing the Four Levels, Berrett-Koehler Publishers