SlideShare una empresa de Scribd logo
1 de 23
Descargar para leer sin conexión
1
1. INTRODUCTION
Condition monitoring pre-supposes the knowledge of conditions of the machinery and
its rate of change, which can be ascertained by selecting a suitable parameter for measuring
deterioration and recording its value at intervals either on a routine or continuous basis. This
is done while the machine is running. The data obtained may then be analyzed to give a
warning on the failure of the machine. This activity is called as condition monitoring.
Condition monitoring essentially involves regular inspection of equipment using
human sensory facilities and a mixture of simple aids and sophisticated instruments. The
major emphasis is however on the fact that most inspections should be preferably done while
the machine is running. Machine condition monitoring is important because it provides
information about the health of a machine. You can use this information to detect warning
signs early and help your organization stop unscheduled outages, optimize machine
performance, and reduce repair time and maintenance costs. Figure 1 shows a typical
machine failure example and the warning signs.
Figure 1: The warning signs of machine failure
(Courtesy: Mechanical Vibrations- Singiresu S. Rao, University of Miami)
2
2. VIBRATION MONITORING
Vibration monitoring is a well established method for determining the physical
movements of the machine or structure due to imbalanced alignment of the mountings, this
method is very simple and it is very easy to use and understand or even carry out
sophisticated real time analysis. Vibration monitoring usually involves the attachment of a
transducer to a machine to record its vibration level special equipments are also available for
using the output from sensor to indicate vibrational problem and even its precise cause.
Vibration monitoring involves measuring the frequency and amplitude of vibrations.
It is well Known that readings of machinery will change as the wear sets in. such readings
can be interpreted as indicators of the systems condition, and timely maintenance actions can
be scheduled accordingly. Electrical machines and mechanical reciprocating or rotating
machines generate their own vibration patterns (signatures) during operation. However such
raw signals contain a lot of background noise, which makes it difficult or even impossible to
extract useful, precise information by simply measuring the overall signal. It is thus necessary
to develop an appropriate filter to remove the operationally and environmentally
contaminated components of signals so as to reveal the clear signals generated by the events
under study. To capture useful condition monitoring data, vibration should be measured at
carefully chosen points and directions.
Transducers used for the measurement of vibrations might work on electromagnetic,
electrodynamics, capacitive, piezoelectric, or strain gauge principles. Out of all among these
piezoelectric accelerometers are most widely used. Among the monitoring techniques
vibration monitoring has gained considerable importance because of following fundamental
factors
1) All rotational and reciprocating machines vibrate because of defects or inaccuracies in the
system.
2) When inaccuracies are more it results in increased vibration and each kind of defect
provides a vibration characterized in the unique way.
Therefore characteristic vibration of the machinery reveal the health condition of machine.
3
3. HISTORY OF VIBRATION MONITORING
In the early days, the system's maintenance was conducted only when the equipment
failed. The work was more “fix it” than maintenance .But nowadays it is more like
performing regular maintenance and renovation tasks on the equipment which could keep
equipment operating for longer periods. This is known as Periodic Maintenance, Calendar
Based Maintenance or Preventive Maintenance (PM). The goal in this case was to achieve
that the equipment would be able to operate most of the time until the next scheduled
maintenance outage. This approach is also outdated. Now Condition monitoring has made
good progress in recent years, maintenance is being carried out based on condition of
machine which reduces the cost of unnecessary opening of equipment
Most of the defects encountered in the rotating machinery gives rise to a distinct
vibration pattern. Vibration Monitoring is the ability to record and identify vibration
“Signatures” which makes the technique so powerful for monitoring rotating machinery. In
recent years as observed by R.K BISWAS, states that Condition Monitoring is defined as the
collection, comparison and storage of measurements defining machine condition. Almost
everyone will recognize the existence of a machine problem sooner or later. SIMMONS
showed that vibrations from their sources origin may be small but excite the resonant
frequencies of the rotating parts such as the rotor shaft and set-up considerable extra dynamic
load on bearings. This will cause and effect reinforcements such that the machine will
progresses towards ultimate break down. As per GYARMATHY, there are generally two
situations in which vibration measurements are taken. One is surveillance mode to check the
health of machinery on routine basis. The second situation is during an analysis process
where the ultimate goal is to tag the problem. In the later case, vibration measurements are
taken to understand the cause, so that an appropriate fix can be undertaken.
4
4. TYPES OF VIBRATION MONITORING SYSTEM
Vibration monitoring systems are broadly classified into two types which are given as
follows
1) Periodic monitoring system or off-line monitoring:
In this type of monitoring system machine vibration is measured or recorded initially
and later it will be analyzed at selected time intervals in the field. Then an analysis is made
either in the field or in the laboratory. Advanced analysis techniques are required for fault
diagnosis and trend analysis. Intermittent monitoring provides information at a very early
stage about early failure and usually it is used when
 Very early warning of faults is required.
 Advanced diagnostics are required.
 Measurements are made at many locations on a machine.
 Machines are complex.
Figure 2: AC vibration monitoring systems - typical offline set-up using a standard
100mV/g accelerometer.
5
2) Permanent monitoring system or online monitoring:
In this type of monitoring system machine vibration is measured continuously at
selected points of the machine and is constantly compared with acceptable levels of
vibration. The principal function of a permanent condition monitoring system is to protect
one or more machines by providing a warning that the machine is operating improperly
and/or to shut the machine down when a preset safety limit is exceeded, thereby avoiding
catastrophic failure and destruction. The measurement system may be permanent, or it may
be quasi-permanent.
In a permanent monitoring system, transducers are mounted permanently at each
selected measurement point. For this reason, this type of a system can be very costly. These
systems are usually used in very critical applications such as when
 No personnel are available to perform measurements (offshore, remote pumping
stations etc).
 It is necessary to stop the machine before a breakdown occurs in order to avoid a
catastrophic accident.
 An instantaneous fault may occur that requires machine shutdown.
 The environment (explosive, toxic, or high-temperature) does not permit the human
involvement required by intermittent measurements.
Before a permanent monitoring system is selected, preliminary measurements should be made
periodically over a period of time to become acquainted with the vibration characteristics of the
machine. This procedure will make it possible to select the most appropriate vibration
measurement parameter, frequency range, and normal alarm and trip levels.
Figure 3: A Continuous vibration monitoring system
6
5. ESTABLISHING A CONDITION MONITORING PROGRAM
A condition monitoring program is established to check the satisfactory operation of a single
machine or, more usually, it is established to check the operation of a number of machines,
perhaps all the machines in an entire plant. The following steps are usually considered in the
establishment of such a program, depending upon on the type of machine and impact of
failure on the operations of machine.
Figure 4: Basic vibration measurement scheme
(Courtesy: Mechanical Vibrations- Singiresu S. Rao, University of Miami)
Step 1. Determine the type of condition monitoring system, described in the above section
that best meets the needs of the plant.
Step 2. Make a list of all of the machines to be monitored (see, for example, Table 1), based
on the importance of these machines in the production line.
TABLE 1. Machinery Classification for Monitoring
Machinery classification Result of failure
Critical Unexpected shutdown or failure causes
significant production loss.
Interrupts production Unexpected shutdown or failure causes
minor interruptions in production lines.
Causes inconvenience Inconvenience in operation, but no
interruption in production.
Noncritical Production is not affected by failure.
Step 3. Tabulate the characteristics of the machines that are important in conducting
vibration analyses of the machines of step 2.These characteristics are associated with
machine construction such as the natural frequencies of shafts, casings, and pedestals, and
7
operational and defect responses. A tabulation of machine frequencies is important because
fault analysis is conducted by matching machine frequencies to measured frequencies
appearing in a spectrum. The following machine characteristics provide the necessary
information for fault analysis.
 Shaft rotational speeds, bearing defect frequencies, number of teeth in gears, number
of vanes and blades in pumps and fans, number of motor poles and number of stator
slots and rotor bars.
 Vibratory forces such as due to misalignment, mass unbalance and reciprocating
masses.
 Vibration responses due to process changes, such as temperature and pressure.
 Fault responses associated with specific machine types, such as motors, pumps and
fans.
 Sensitivity to instability in components, such as fluid film bearings and seals due to
wear and clearance.
 Loads or changes in operating conditions.
Figure 5: Displacement and velocity spectra obtained under identical conditions (Courtesy:
CONDITION MONITORING OF MACHINERY-Joëlle Courrech and Ronald L.Eshleman)
Step 4. Select the most appropriate vibration measurement parameter. When an
accelerometer is employed as the sensing device in a condition monitoring system, the
resulting acceleration signal can be electronically integrated to obtain velocity or
displacement, so any one of these three parameters may be used in measurements. The
appropriate parameter may be selected by application of the following simple rule as stated
below
Use the parameter which provides the “flattest” spectrum. The flattest spectrum
requires the least dynamic range from the instrumentation which follows the transducer. For
8
example, Fig.5 shows a velocity spectrum and a displacement spectrum obtained under
identical conditions. The dynamic range (i.e., the range from the highest to the lowest signal
level) required to measure the displacement spectrum is much larger than the range for the
velocity spectrum; it may even exceed the available dynamic range of the instrumentation.
Therefore, according to this rule, velocity measurements should be selected. The flattest
spectrum rule applies only to the frequency range of interest. Therefore, the parameter
selection to some extent, depends on the type of machine and the type of faults considered.
Step 5. Select one of the following vibration pickups that will best meet the requirements of
step 4.
Displacement Transducer. A displacement transducer is a transducer that converts an input
mechanical displacement into an electrical output that is proportional to the input
displacement. Displacement transducer of the eddy-current type which have no contacting
probes, are commonly used to measure the relative motion between a shaft and its bearings.
This information can be related directly to physical values such as mechanical clearance or
oil-film thickness, e.g., it can give an indication of incipient rubbing. Shaft vibration provides
information about the current condition of a machine and is principally used in permanent
monitoring systems, which immediately shut the machine down in the event of trouble. The
use of displacement transducers is essential in machinery having journal bearings. However,
proximity probe transducers are
i. Usually difficult to calibrate absolutely.
ii. Have limited dynamic range because of the influence of electrical and
mechanical run out on the shaft.
iii. Have a limited high-frequency range.
Accelerometers and Velocity Pickup. Pickups of this type, are usually lightweight and
rugged. They are always used for detecting faults which occur at high frequencies (say, above
1000 Hz), for example, to detect rolling element bearing deterioration or gearbox wear.
Acceleration measurements of bearing vibration will provide very early warning of incipient
faults in a machine.
9
Figure 6: An Accelerometer
Step 6. Select the measurement locations. When a periodic (off-line) monitoring system is
employed, the number of points at which measurements are made is limited only by the
requirement for keeping measurement time to a minimum. As a general rule, bearing
vibration measurements are made in the radial direction on each accessible bearing and in the
axial direction on thrust bearings. It is not usually necessary to measure bearing vibration in
both the horizontal and the vertical direction, since both measurements give the same
information regarding the forces within the machine. This information is merely transmitted
through two different transmission paths, this will be used for detecting developing faults. It
will later be seen however, in order to subsequently diagnose the origin of the impending
fault, measurements in both the horizontal and the vertical direction may give valuable
information.
When measuring shaft vibrations with permanently mounted proximity transducers, it
is convenient to use two probes on each bearing, located at 90° from each other, thereby
providing an indication of the orbit of the shaft within the bearing. Axial displacement
transducers, programmed to shut the machine down on preset levels, are mounted where a
thrust measurement will protect the machine rotating parts, such as blades, from rubbing the
stationary casing due to fault induced axial forces. When a permanent (on-line) monitoring
system is employed using a seismic pickup, the number of measurement points usually is
minimized for reasons of economy. Selection must be made following a study of the
vibration spectra of different bearings in order to locate those points where all significant
components related to the different expected faults are transmitted at measurable vibration
10
levels if full spectrum comparison is performed. If only broadband measurements are
monitored, then a further requirement is that all frequency components related to the expected
faults must be of approximately the same level within the selected frequency range.
Otherwise, measurements must be made in selected frequency bands.
Step 7. Select the time interval between measurements. The selection of the time interval
between measurements requires knowledge of the specific machine. Some machines develop
faults quickly, and others run trouble-free for years. A compromise must be found between
the safety of the system and the time taken for measurements and analysis. Measurements
should be made frequently in the initial stages of a condition monitoring program to ensure
that the vibration levels measured are stable and that no fault is already developing. When a
significant change is detected, the time interval between measurements should be reduced
sufficiently so as not to risk a breakdown before the next measurement .The trend curve will
help in determining when the next measurement should be performed.
Step 8. Establish an optimum sequence of data acquisition. The sequence in which data
acquired in a condition monitoring program must be planned so that the data are acquired
efficient. For example, the data collection may be planned on the basis of plant layout, or the
type of data required, or on the sequence of components in the machine train, from driver to
driven components.
11
6. FAULT DETECTION IN ROTATING MACHINERY
It is required to detect all types of faults likely to occur during the operation of
rotating machinery. Such faults range from vibrations at very low frequencies at vibrations at
very high frequencies. Such detection should be applicable to the complete range of machines
in a plant, which operate from very low to very high speed. This requires the selection of
equipment and analysis techniques which cover a very broad frequency range.
Measurements of absolute vibration levels of bearings provide no indication of the
machine‟s condition, since they are influenced by the transmission path between the force
and the measurement point, which may amplify some frequencies and attenuate others.
Bearing vibration levels change from one measurement point to another on a given machine,
since the transmission paths are different. They also change for the same reason from
machine to machine for measurements made at the same measurement point. Therefore, in
estimating the condition of a machine, it is essential to monitor changes in vibration from a
reference value established when the machine was known to be in good condition. Changes
are expressed as a ratio or, more commonly as a change of level i.e., the log of a ratio, in
decibels. The main objective of condition monitoring of a machine is to predict a fault well in
advance of its occurrence. Therefore, a measurement of the overall vibration level will not
provide successful prediction because the highest vibration component within the overall
frequency range will dominate the measurement. This is illustrated in Fig.7, which shows an
example where overall measurements of the vibration velocity resulted in an incorrect
prediction with an overestimate of the lead time. The early detection of faults in machinery
can be made successfully only by comparison with a reference spectrum. This section
compares types of spectrum analysis for this purpose.
12
Figure 7: Trend analysis performed on an overall measurement and on an individual
component. (A) The velocity spectrum of vibration measured on a gearbox after installation.
Note the high amplitude of the 480-Hz component, dominating the reference spectrum. (B)
The velocity spectrum 3 months later (Courtesy: CONDITION MONITORING OF
MACHINERY-Joëlle Courrech and Ronald L. Eshleman)
Condition monitoring techniques employed during transient operating conditions of
the machine (i.e., when the machine is running up to full speed or slowing down from full
speed) differ significantly from the techniques employed during steady-state operating
conditions. Therefore it is essential that a careful investigation be carried out to ensure that
the condition monitoring technique selected is appropriate for the conditions of measurement.
7. FALSE ALARMS
Changes in machinery vibration may result from a number of causes which are not
necessarily related to the deterioration of the machine. For example, a change in speed of the
machine or a change in the load on the machine usually greatly modifies the relative
amplitudes of the different components of vibration at a fixed transducer location or modifies
the relative pattern of vibration at different locations. Depending on the criteria used for fault
detection, such changes may result in a false indication of deterioration of the machine.
Appropriate selection of the technique employed can avoid such false alarms.
13
8. VIBRATION ANALYSIS
Vibration analysis is most commonly used for condition monitoring of machinery.
Vibration in machines are caused by cyclic excitation forces arising from imbalances, wear, or
failure of parts. What type of changes occur in the vibration level, how these changes can be
detected, and how the condition of the machine is interpreted has been the topic of several
research studies in the past. Some of the vibration analysis techniques are given below.
Time-Domain Analysis: Time-domain analysis uses the time history of the signal. The signal is
stored in an oscilloscope or a real time analyzer and any nonsteady or transient impulses are
noted. Discrete damages such as broken teeth in gears and cracks in inner or outer races of
bearings can be identified easily from the waveform of the casing of a gearbox. As an example,
Fig.8 shows the acceleration signal of a single stage gearbox. The pinion of the gear pair is
coupled to a 5.6-kW, 2865-rpm, AC electric motor. Since the pinion (shaft) speed is 2865 rpm or
47.75 Hz, the period can be noted as 20.9 ms. The acceleration waveform indicates that pulses
occur periodically with a period of 20 ms approximately. Noting that this period is the same as
the period of the pinion, the origin of the pulses in the acceleration signal can be attributed to a
broken gear tooth on the pinion.
Figure 8: Time-domain waveform of a faulty gearbox
(Courtesy: Mechanical Vibrations- Singiresu S. Rao, University of Miami)
14
Indices: In some cases, indices such as the peak level or the root mean square level and
the crest factor are used to identify damage in machine condition monitoring. Since the peak
level occurs only once, it is not a statistical quantity and hence is not a reliable index to detect
damage in continuously operating systems. Although the RMS value is a better index to detect
damage in steady-state applications, it may not be useful if the signal contains information from
more than one component, as in the case of vibration of a complete gearbox that consists of
several gears, shafts, and bearings. The crest factor, defined as the ratio of the peak to RMS
level, includes information from both the peak and the RMS levels. However, it may also not be
able to identify failure in certain cases. For example, if the failure occurs progressively, the RMS
level of the signal might be increasing gradually, although the crest factor might be showing
a decreasing trend.
Orbits: Sometimes, certain patterns known as Lissajous figures can be obtained by
displaying time waveforms obtained from two transducers whose outputs are shifted by 90° in
phase. Any change in the pattern of these figures or orbits can be used to identify faults such as
misalignment in shafts, unbalance in shafts, shaft rub, wear in journal bearings, and
hydrodynamic instability in lubricated bearings. Figure 9, illustrates a change in orbit caused by
a worn bearing. The enlarged orbit diameter in the vertical direction indicates that the bearing
has become stiffer in the horizontal direction that is, it has more bearing clearance in the vertical
direction.
Figure 9: Change in orbit due to a bearing failure
(Courtesy: Mechanical Vibrations- Singiresu S. Rao, University of Miami)
15
Frequency-Domain Analysis: The frequency-domain signal or frequency spectrum is a plot of
the amplitude of vibration response versus the frequency and can be derived by using the digital
fast Fourier analysis of the time waveform. The frequency spectrum provides valuable
information about the condition of a machine. The vibration response of a machine is governed
not only by its components but also by its assembly, mounting and installation. Thus the
vibration characteristics of any machine are somewhat unique to that particular machine; hence
the vibration spectrum can be considered as the vibration signature of that machine. As long as
the excitation forces are constant or vary by small amounts, the measured vibration level of the
machine also remains constant or varies by small amounts. However, as the machine starts
developing faults, its vibration level and hence the shape of the frequency spectrum change.
By comparing the frequency spectrum of the machine in damaged condition with the
reference frequency spectrum corresponding to the machine in good condition, the nature and
location of the fault can be detected. Another important characteristic of a spectrum is that each
rotating element in a machine generates identifiable frequency, as illustrated in Fig.10, thus the
changes in the spectrum at a given frequency can be attributed directly to the corresponding
machine component. Since such changes can be detected more easily compared to changes in the
overall vibration levels, this characteristic will be very valuable in practice. Since the peaks in
the spectrum relate to various machine components, it is necessary to be able to compute the
fault frequencies. A number of formulas can be derived to find the fault frequencies of standard
components like bearings, gearboxes, pumps, fans, and pulleys.
Figure 10: Relationship between machine components and the vibration spectrum.
(Courtesy: Mechanical Vibrations- Singiresu S. Rao, University of Miami)
16
Vibration Analysis is a two step process involving the ACQUISITION and
INTERPRETATION of machinery vibration data. Its purpose is to determine the mechanical
condition of a machine and specific mechanical or operational defects.
The Data Acquisition procedure is a means of systematic measuring and recording of the
vibration characteristics needed to analyze a problem.
The Data Interpretation involves comparing the recorded data with the details of the machine,
like its speed or speeds, its foundations, the construction details etc. then the characteristic of
vibration typical of various defects are compared with the characteristics that have been
measured. By this, one can pinpoint the trouble and take corrective measures.
9. DATA ACQUISITION
Data acquisition is the essential first step in vibration analysis, since the right data must
be acquired under the right conditions to completely interpret a machine‟s condition. Data
acquisition can be done in several ways depending on the available instruments. Apart from data
acquisition, additional data acquisition procedure such as semi-automatic, automatic and real
time analysis are employed where the job can be quicker and more accurate.
In the semi-automatic method, the operator manually adjusts the filter through the frequency
ranges, while the data is automatically recorded in a recorder. These types of plots are records of
vibration amplitudes in the „Y‟ axis and the frequencies in the „X‟ axis. Such a plot is called
Machinery Vibration Profile (Signature) and the analysis of the same is called as Signature
Analysis.
Automatic data acquisition is the term used to describe the procedure of obtaining the
data, where the instrument automatically plots the vibration profiles. This type of instrument
incorporates and electronically swept filter as well as provisions for simultaneous plotting of data
with the recorders.
17
Selection of Measurement Parameters
The various measurement parameters are displacement, velocity and acceleration
Displacement: Displacement can be measured with both velocity and acceleration pickups. This
is accomplished by means of integrator circuits that are normally included in the circuit of
vibration meters and analyzers. Pickups that respond directly to vibration displacement are
readily available, but are usually used in the non-contact pickups.
Velocity: Velocity can also be measured with both velocity and acceleration pickups. Seismic
and piezoelectric velocity pickups obtain vibration directly. The output from an accelerometer
can be integrated to produce the equivalent of a velocity measurement, down to about 3Hz.
Acceleration: Acceleration should be measured only with an accelerometer. It is theoretically
possible to differentiate signals from a velocity transducer to produce acceleration readings, but
this would be needlessly complicated and expensive.
Common Types of Measurements used in vibration analysis:
The common types of measurements used are as follows:
1) Overall vibration amplitude measurements: Overall vibration amplitude measurements
provide a quick check of general machinery condition. A vibration meter or analyzer can be used
for these measurements. This measurement is generally manually recorded in tabular form, or the
data automatically stored in memory for computer based automated instruments
2) Amplitude Vs Frequency measurements: Amplitude Vs Frequency measurements provide
frequency spectrum which is used to pinpoint the problem to a specific frequency or range of
frequencies. Full capacity or advanced check analyzers are required to take these measurements.
Data can be recorded manually in tabular form, or by semi automatic or automatic swept filter
18
analysis with tabular or graphic hard copy recording of the data. FFT type analyzer can also
provide tabular/graphic hard copy of visual display of the data.
It is estimated that over 85% of the mechanical problems occurring on rotating machinery can be
identified by displaying the vibration Amplitude Vs Frequency data.
Figure 11: A simple Amplitude vs Frequency curve
Importance of tri-axial readings: It is common practice to record the Amplitude Vs Frequency
data measured in the horizontal, vertical and axial pickup directions at each bearing of the
machines being analyzed. Obtaining measurements in all the three directions is extremely
important for distinguishing between various mechanical problems. E.g. Unbalance,
Misalignment, bend shaft structural weakness (loose parts) will generally cause vibration at a
frequency 1 RPM. Unbalance will almost always produce high amplitudes in the horizontal
direction while lower amplitudes in the axial direction. Misalignment of couplings and bearings
or a bend shaft will generally show relatively high amplitude of vibration in the axial direction.
Amplitudes due to structural weakness, loose parts are shown in Vertical direction
3) Amplitude Vs Time measurements: Time measurements can be made during machine
operation to detect vibrations that would not be apparent from Amplitude Vs Frequency analysis.
Amplitude Vs Time measurements can be made for very fast transient vibrations or for slowly
occurring vibrations. For fast transient vibrations use an oscilloscope with the horizontal axis
scaled in milliseconds. For slowly varying vibrations use a recorder with the horizontal axis
scaled in seconds. It can be taken with a DC recorder connected to an analyzer with that built-in-
capability.
19
Figure 12: A typical Amplitude vs Time curve.
4) Phase measurements: Phase measurements are important when analyzing mechanical
problems in machinery. Phase is defined as the position of a vibrating part at a given instance
with reference to a fixed point or another vibrating part. Phase measurements offer a convenient
way to determine how one part is vibrating relative to another part.
To obtain phase measurements, an analyzer with a strobe light or remote reference pickup
is required. The use of strobe light necessities visual observation of the rotating shaft and the
capability to fire the strobe light with vibration signal in order to obtain phase. The remote phase
pickup, which is usually an electromagnetic pickup, non-contact transducer or photocell must be
installed so that to observe mechanical protrusion (depression) or a reflective mark on the shaft.
The strobe light measurement involves observing the angular position of the reference mark that
appears under the strobe light, while the remote reference pickup provides phase readout (digital
or analog) using a meter on the analyzer.
.
20
10. DATA INTERPRETATION
Once the necessary information have been collected by manual, or semi-automatic or automatic,
the next step is to review and compare the reading with the characteristics of vibration typical of
various types of troubles. A key to this comparison is the frequency. If a machine part has some
defect, the frequency of vibration resulting from this defect will be a multiple of the RPM. This
multiplying factor will be different for different defects. Also there are some defects which will
produce vibration frequencies that are not related with the speed of the rotor.
Causes of Vibration and its identification through data interpretation
The major causes of vibration on Rotary machines are
i) Unbalance: It is found that the vibration caused due to unbalance in the machinery parts will
be identified by observing the Vibration amplitude Vs frequency data curves generated by the
recorder.
ii) Mechanical looseness: The vibration may be the result of loose mounting bolts, excessive
bearing clearance, a crack or break in the structure or bearing pedestal, a rotor which is loose on
the shaft, or some other loose machine component. The vibration characteristic of mechanical
looseness will not occur unless there is some other exciting force such as unbalance or
misalignment which can result in large amplitudes of looseness vibration. The vibration due to
looseness can be detected from Amplitude Vs Frequency when taking the reading in vertical
direction.
iii) Misalignment: Misalignment is an extremely common problem. Misalignment, even with
flexible couplings, results in two forces, axial and radial vibration. The significant characteristic
of misalignment and bent shafts is that vibration will be noted in both the radial and axial
directions. As a result, a comparative axial vibration is the best indication of misalignment or a
bent shaft.
21
iv) Defective antifriction bearing: Flaws on the raceways, balls or rollers of rolling element
bearings cause high-frequency vibrations and the frequency is not just the multiple of the shaft
RPM. The amplitude of vibration depends on the extent of the bearing fault. The natural
frequency vibrations typically occur as vibration peaks in the 10,000 to 100,000 CPM. Defects in
the bearing components can generate vibration peaks at frequencies related to the bearing
geometry. The vibration generated by the bearing is not normally transmitted to other points of
the machine.
11. USE OF COMPUTERS IN CONDITION MONITORING PROGRAMS
Computers can be of great help in a condition monitoring program in handling, filing and storing
data and in performing tedious computations such as spectrum comparison and trend analysis. A
condition monitoring system which incorporates a computer includes:
1. A recording device for storing the analog or digital time signals or frequency
spectra. In a permanently installed monitoring system, the analog time signal is
directly connected to the following items.
2. An analyzer with both fast Fourier transform (FFT) narrowband analysis and
advanced diagnostic techniques (zoom, cepstrum) for diagnostics.
3. A computer and appropriate software which provides
a. Management of the measurement program, including route mapping, storage of reference
spectra/cepstra, and new spectra/cepstra;
b. A comparison of spectra and a printout of significant changes;
c. Trend analysis of any chosen parameter (individual component or overall level in a given
frequency range). In a permanent monitoring system, the complete process (i.e., a new
analysis) is performed automatically at a predetermined rate, which is adjusted as the fault
develops.
22
CONCLUSION
In this report an attempt was made to understand the concept of vibration monitoring and
the techniques associated with it. In most of the practical applications, it might be very difficult
to develop a mathematical model, derive the suitable governing equations and conduct analysis
to predict the vibration characteristics of the system. In such cases, vibration characteristics of
the system are measured under known input conditions and a mathematical model is developed.
This technique of measuring vibrational characteristics of a system is helpful in analyzing and
interpreting the behaviour of the system.
In this work, the concept of vibration monitoring systems and the various types of systems have
been explained. The steps involved in establishing a vibration monitoring system have been
discussed. Further, some of the vibration analysis techniques have been explained to achieve
condition monitoring of the system. Also, the applications of vibration monitoring has been
highlighted and recent developments to achieve condition monitoring using computer programs
have been listed.
23
REFERENCES
[1] Eshleman, R. L., “Machinery Vibration Analysis II Notes,” Vibration Institute, Willowbrook,
Ill., 2000.
[2] Eshleman, R. L.: “Basic Machinery Vibrations,” VI Press, Clarendon Hills, Ill., 1999.
[3] Mitchell, J. S.: “An Introduction to Machinery Analysis and Monitoring,” Penwell Publishing
Company, Tulsa, Okla., 1981
[4] Joëlle Courrech and Ronald L. Eshleman, "Condition monitoring of machinery", A paper on
Condition monitoring and analysis.
[5] A book on "Mechanical Vibrations" by Singiresu S. Rao, University of Miami. (ISBN 978-0-
13-212819-3) Page no: 870-928.

Más contenido relacionado

La actualidad más candente

Condition monitoring of rotating machines ppt
Condition monitoring of rotating machines pptCondition monitoring of rotating machines ppt
Condition monitoring of rotating machines pptRohit Kaushik
 
Vibration Monitoring-Vibration Transducers-Vibration Troubleshooting
Vibration Monitoring-Vibration Transducers-Vibration TroubleshootingVibration Monitoring-Vibration Transducers-Vibration Troubleshooting
Vibration Monitoring-Vibration Transducers-Vibration TroubleshootingDhanesh S
 
Introduction to vibration monitoring
Introduction to vibration monitoringIntroduction to vibration monitoring
Introduction to vibration monitoringKevin Pereira
 
Vibration analysis unit 4
Vibration analysis unit 4Vibration analysis unit 4
Vibration analysis unit 4Dibyendu De
 
Vibration analysis to find out fault in machines
Vibration analysis to find out fault in machinesVibration analysis to find out fault in machines
Vibration analysis to find out fault in machinesHarkishan Prajapati
 
Condition monitoring
Condition monitoringCondition monitoring
Condition monitoringAnkit Narain
 
Condition monitoring & vibration analysis
Condition monitoring & vibration analysisCondition monitoring & vibration analysis
Condition monitoring & vibration analysisJai Kishan
 
CONDITION MONITORING
CONDITION MONITORINGCONDITION MONITORING
CONDITION MONITORINGlaxtwinsme
 
CONDITION BASED MONITORING PRESENTATION
CONDITION BASED MONITORING PRESENTATIONCONDITION BASED MONITORING PRESENTATION
CONDITION BASED MONITORING PRESENTATIONIgnesias Tsotetsi
 
MTBF vs MTTR.pptx
MTBF vs MTTR.pptxMTBF vs MTTR.pptx
MTBF vs MTTR.pptxBalakumarV6
 
Vibration Analysis, Emerson Makes it Easy for You
Vibration Analysis, Emerson Makes it Easy for YouVibration Analysis, Emerson Makes it Easy for You
Vibration Analysis, Emerson Makes it Easy for YouDieter Charle
 
BASICS OF VIBRATION.ppt
BASICS OF VIBRATION.pptBASICS OF VIBRATION.ppt
BASICS OF VIBRATION.pptvishal laddha
 

La actualidad más candente (20)

Condition monitoring of rotating machines ppt
Condition monitoring of rotating machines pptCondition monitoring of rotating machines ppt
Condition monitoring of rotating machines ppt
 
Vibration Analysis
Vibration AnalysisVibration Analysis
Vibration Analysis
 
1 vibration basics0
1 vibration basics01 vibration basics0
1 vibration basics0
 
VIBRATION-ANALYSIS.ppt
VIBRATION-ANALYSIS.pptVIBRATION-ANALYSIS.ppt
VIBRATION-ANALYSIS.ppt
 
Vibration Monitoring-Vibration Transducers-Vibration Troubleshooting
Vibration Monitoring-Vibration Transducers-Vibration TroubleshootingVibration Monitoring-Vibration Transducers-Vibration Troubleshooting
Vibration Monitoring-Vibration Transducers-Vibration Troubleshooting
 
Introduction to vibration monitoring
Introduction to vibration monitoringIntroduction to vibration monitoring
Introduction to vibration monitoring
 
20 presentation
20 presentation20 presentation
20 presentation
 
Vibration analysis unit 4
Vibration analysis unit 4Vibration analysis unit 4
Vibration analysis unit 4
 
Vibration analysis to find out fault in machines
Vibration analysis to find out fault in machinesVibration analysis to find out fault in machines
Vibration analysis to find out fault in machines
 
Condition monitoring
Condition monitoringCondition monitoring
Condition monitoring
 
Condition monitoring
Condition monitoringCondition monitoring
Condition monitoring
 
Condition monitoring & vibration analysis
Condition monitoring & vibration analysisCondition monitoring & vibration analysis
Condition monitoring & vibration analysis
 
Vibration
VibrationVibration
Vibration
 
CONDITION MONITORING
CONDITION MONITORINGCONDITION MONITORING
CONDITION MONITORING
 
CONDITION BASED MONITORING PRESENTATION
CONDITION BASED MONITORING PRESENTATIONCONDITION BASED MONITORING PRESENTATION
CONDITION BASED MONITORING PRESENTATION
 
MTBF vs MTTR.pptx
MTBF vs MTTR.pptxMTBF vs MTTR.pptx
MTBF vs MTTR.pptx
 
Vibration Analysis, Emerson Makes it Easy for You
Vibration Analysis, Emerson Makes it Easy for YouVibration Analysis, Emerson Makes it Easy for You
Vibration Analysis, Emerson Makes it Easy for You
 
BASICS OF VIBRATION.ppt
BASICS OF VIBRATION.pptBASICS OF VIBRATION.ppt
BASICS OF VIBRATION.ppt
 
Presentation on Condition Monitoring
Presentation on Condition MonitoringPresentation on Condition Monitoring
Presentation on Condition Monitoring
 
Vibration analysis
Vibration analysisVibration analysis
Vibration analysis
 

Similar a Vibration monitoring

CONDITION BASED MAINTAINACE BASICS presentation
CONDITION BASED MAINTAINACE BASICS presentation CONDITION BASED MAINTAINACE BASICS presentation
CONDITION BASED MAINTAINACE BASICS presentation RAJKUMAR Rswagmare
 
cbmpresentation2-160829024753.pptx
cbmpresentation2-160829024753.pptxcbmpresentation2-160829024753.pptx
cbmpresentation2-160829024753.pptxveeramaniveltraining
 
(Modifid)condition m0nitoring of longwall face supportd
(Modifid)condition m0nitoring of longwall face supportd(Modifid)condition m0nitoring of longwall face supportd
(Modifid)condition m0nitoring of longwall face supportdrockyraj19
 
Ifm efector octavis brochure England 2013
Ifm efector octavis brochure England 2013Ifm efector octavis brochure England 2013
Ifm efector octavis brochure England 2013ifm electronic gmbh
 
Modal Analysis and Condition Monitoring
Modal Analysis and Condition MonitoringModal Analysis and Condition Monitoring
Modal Analysis and Condition MonitoringAbhishek Turamandi
 
Vibration Analysis Services | Vibration Analysis Services
Vibration Analysis Services | Vibration Analysis ServicesVibration Analysis Services | Vibration Analysis Services
Vibration Analysis Services | Vibration Analysis ServicesRMSC
 
Importence of Vibration Transmitters.pptx
Importence of Vibration Transmitters.pptxImportence of Vibration Transmitters.pptx
Importence of Vibration Transmitters.pptxCentum Controls
 
2-03.pdf
2-03.pdf2-03.pdf
2-03.pdfkhans21
 
Machinery Dignostic_Introduction pdf info
Machinery Dignostic_Introduction pdf infoMachinery Dignostic_Introduction pdf info
Machinery Dignostic_Introduction pdf infossusere1ee8b
 
IRJET- Trouble Shooting of Rotary Equipments using Vibration Anaysis
IRJET- Trouble Shooting of Rotary Equipments using Vibration AnaysisIRJET- Trouble Shooting of Rotary Equipments using Vibration Anaysis
IRJET- Trouble Shooting of Rotary Equipments using Vibration AnaysisIRJET Journal
 
Condition Monitoring of DC Motor using Artificial Intelligence Technique
Condition Monitoring of DC Motor using Artificial Intelligence TechniqueCondition Monitoring of DC Motor using Artificial Intelligence Technique
Condition Monitoring of DC Motor using Artificial Intelligence Techniqueijsrd.com
 
Vibration Analysis Guide.pdf
Vibration Analysis Guide.pdfVibration Analysis Guide.pdf
Vibration Analysis Guide.pdfPratap Kota
 
Smart Maintenance engineering
Smart Maintenance engineering Smart Maintenance engineering
Smart Maintenance engineering Michel Mafumba
 
MIS_Ch_1_for_studentsNew.pdf
MIS_Ch_1_for_studentsNew.pdfMIS_Ch_1_for_studentsNew.pdf
MIS_Ch_1_for_studentsNew.pdfShivajiThube2
 
MIS_Ch_1_for_studentsNew.pdf
MIS_Ch_1_for_studentsNew.pdfMIS_Ch_1_for_studentsNew.pdf
MIS_Ch_1_for_studentsNew.pdfShivajiThube2
 
R. Keith Mobley President and CEO of Integrated Systems Inc. - Vibration Fun...
R. Keith Mobley President and CEO of Integrated Systems  Inc. - Vibration Fun...R. Keith Mobley President and CEO of Integrated Systems  Inc. - Vibration Fun...
R. Keith Mobley President and CEO of Integrated Systems Inc. - Vibration Fun...srinivaskappagantula1
 

Similar a Vibration monitoring (20)

Maintenance engineering- Unit- 3
Maintenance engineering- Unit- 3Maintenance engineering- Unit- 3
Maintenance engineering- Unit- 3
 
CONDITION BASED MAINTAINACE BASICS presentation
CONDITION BASED MAINTAINACE BASICS presentation CONDITION BASED MAINTAINACE BASICS presentation
CONDITION BASED MAINTAINACE BASICS presentation
 
cbmpresentation2-160829024753.pptx
cbmpresentation2-160829024753.pptxcbmpresentation2-160829024753.pptx
cbmpresentation2-160829024753.pptx
 
(Modifid)condition m0nitoring of longwall face supportd
(Modifid)condition m0nitoring of longwall face supportd(Modifid)condition m0nitoring of longwall face supportd
(Modifid)condition m0nitoring of longwall face supportd
 
Ifm efector octavis brochure England 2013
Ifm efector octavis brochure England 2013Ifm efector octavis brochure England 2013
Ifm efector octavis brochure England 2013
 
201421402011.pptx
201421402011.pptx201421402011.pptx
201421402011.pptx
 
Modal Analysis and Condition Monitoring
Modal Analysis and Condition MonitoringModal Analysis and Condition Monitoring
Modal Analysis and Condition Monitoring
 
Vibration Analysis Services | Vibration Analysis Services
Vibration Analysis Services | Vibration Analysis ServicesVibration Analysis Services | Vibration Analysis Services
Vibration Analysis Services | Vibration Analysis Services
 
Importence of Vibration Transmitters.pptx
Importence of Vibration Transmitters.pptxImportence of Vibration Transmitters.pptx
Importence of Vibration Transmitters.pptx
 
2-03.pdf
2-03.pdf2-03.pdf
2-03.pdf
 
Machinery Dignostic_Introduction pdf info
Machinery Dignostic_Introduction pdf infoMachinery Dignostic_Introduction pdf info
Machinery Dignostic_Introduction pdf info
 
IRJET- Trouble Shooting of Rotary Equipments using Vibration Anaysis
IRJET- Trouble Shooting of Rotary Equipments using Vibration AnaysisIRJET- Trouble Shooting of Rotary Equipments using Vibration Anaysis
IRJET- Trouble Shooting of Rotary Equipments using Vibration Anaysis
 
J046015861
J046015861J046015861
J046015861
 
Condition Monitoring of DC Motor using Artificial Intelligence Technique
Condition Monitoring of DC Motor using Artificial Intelligence TechniqueCondition Monitoring of DC Motor using Artificial Intelligence Technique
Condition Monitoring of DC Motor using Artificial Intelligence Technique
 
Vibration Analysis Guide.pdf
Vibration Analysis Guide.pdfVibration Analysis Guide.pdf
Vibration Analysis Guide.pdf
 
Smart Maintenance engineering
Smart Maintenance engineering Smart Maintenance engineering
Smart Maintenance engineering
 
MIS_Ch_1_for_studentsNew.pdf
MIS_Ch_1_for_studentsNew.pdfMIS_Ch_1_for_studentsNew.pdf
MIS_Ch_1_for_studentsNew.pdf
 
MIS_Ch_1_for_studentsNew.pdf
MIS_Ch_1_for_studentsNew.pdfMIS_Ch_1_for_studentsNew.pdf
MIS_Ch_1_for_studentsNew.pdf
 
R. Keith Mobley President and CEO of Integrated Systems Inc. - Vibration Fun...
R. Keith Mobley President and CEO of Integrated Systems  Inc. - Vibration Fun...R. Keith Mobley President and CEO of Integrated Systems  Inc. - Vibration Fun...
R. Keith Mobley President and CEO of Integrated Systems Inc. - Vibration Fun...
 
21 industrial vibration analysis
21 industrial vibration analysis21 industrial vibration analysis
21 industrial vibration analysis
 

Último

Hazard Identification (HAZID) vs. Hazard and Operability (HAZOP): A Comparati...
Hazard Identification (HAZID) vs. Hazard and Operability (HAZOP): A Comparati...Hazard Identification (HAZID) vs. Hazard and Operability (HAZOP): A Comparati...
Hazard Identification (HAZID) vs. Hazard and Operability (HAZOP): A Comparati...soginsider
 
DC MACHINE-Motoring and generation, Armature circuit equation
DC MACHINE-Motoring and generation, Armature circuit equationDC MACHINE-Motoring and generation, Armature circuit equation
DC MACHINE-Motoring and generation, Armature circuit equationBhangaleSonal
 
UNIT - IV - Air Compressors and its Performance
UNIT - IV - Air Compressors and its PerformanceUNIT - IV - Air Compressors and its Performance
UNIT - IV - Air Compressors and its Performancesivaprakash250
 
VIP Call Girls Palanpur 7001035870 Whatsapp Number, 24/07 Booking
VIP Call Girls Palanpur 7001035870 Whatsapp Number, 24/07 BookingVIP Call Girls Palanpur 7001035870 Whatsapp Number, 24/07 Booking
VIP Call Girls Palanpur 7001035870 Whatsapp Number, 24/07 Bookingdharasingh5698
 
Minimum and Maximum Modes of microprocessor 8086
Minimum and Maximum Modes of microprocessor 8086Minimum and Maximum Modes of microprocessor 8086
Minimum and Maximum Modes of microprocessor 8086anil_gaur
 
2016EF22_0 solar project report rooftop projects
2016EF22_0 solar project report rooftop projects2016EF22_0 solar project report rooftop projects
2016EF22_0 solar project report rooftop projectssmsksolar
 
Thermal Engineering -unit - III & IV.ppt
Thermal Engineering -unit - III & IV.pptThermal Engineering -unit - III & IV.ppt
Thermal Engineering -unit - III & IV.pptDineshKumar4165
 
Block diagram reduction techniques in control systems.ppt
Block diagram reduction techniques in control systems.pptBlock diagram reduction techniques in control systems.ppt
Block diagram reduction techniques in control systems.pptNANDHAKUMARA10
 
Unit 2- Effective stress & Permeability.pdf
Unit 2- Effective stress & Permeability.pdfUnit 2- Effective stress & Permeability.pdf
Unit 2- Effective stress & Permeability.pdfRagavanV2
 
VIP Model Call Girls Kothrud ( Pune ) Call ON 8005736733 Starting From 5K to ...
VIP Model Call Girls Kothrud ( Pune ) Call ON 8005736733 Starting From 5K to ...VIP Model Call Girls Kothrud ( Pune ) Call ON 8005736733 Starting From 5K to ...
VIP Model Call Girls Kothrud ( Pune ) Call ON 8005736733 Starting From 5K to ...SUHANI PANDEY
 
data_management_and _data_science_cheat_sheet.pdf
data_management_and _data_science_cheat_sheet.pdfdata_management_and _data_science_cheat_sheet.pdf
data_management_and _data_science_cheat_sheet.pdfJiananWang21
 
Unleashing the Power of the SORA AI lastest leap
Unleashing the Power of the SORA AI lastest leapUnleashing the Power of the SORA AI lastest leap
Unleashing the Power of the SORA AI lastest leapRishantSharmaFr
 
notes on Evolution Of Analytic Scalability.ppt
notes on Evolution Of Analytic Scalability.pptnotes on Evolution Of Analytic Scalability.ppt
notes on Evolution Of Analytic Scalability.pptMsecMca
 
ONLINE FOOD ORDER SYSTEM PROJECT REPORT.pdf
ONLINE FOOD ORDER SYSTEM PROJECT REPORT.pdfONLINE FOOD ORDER SYSTEM PROJECT REPORT.pdf
ONLINE FOOD ORDER SYSTEM PROJECT REPORT.pdfKamal Acharya
 
Work-Permit-Receiver-in-Saudi-Aramco.pptx
Work-Permit-Receiver-in-Saudi-Aramco.pptxWork-Permit-Receiver-in-Saudi-Aramco.pptx
Work-Permit-Receiver-in-Saudi-Aramco.pptxJuliansyahHarahap1
 
University management System project report..pdf
University management System project report..pdfUniversity management System project report..pdf
University management System project report..pdfKamal Acharya
 

Último (20)

Integrated Test Rig For HTFE-25 - Neometrix
Integrated Test Rig For HTFE-25 - NeometrixIntegrated Test Rig For HTFE-25 - Neometrix
Integrated Test Rig For HTFE-25 - Neometrix
 
Hazard Identification (HAZID) vs. Hazard and Operability (HAZOP): A Comparati...
Hazard Identification (HAZID) vs. Hazard and Operability (HAZOP): A Comparati...Hazard Identification (HAZID) vs. Hazard and Operability (HAZOP): A Comparati...
Hazard Identification (HAZID) vs. Hazard and Operability (HAZOP): A Comparati...
 
Water Industry Process Automation & Control Monthly - April 2024
Water Industry Process Automation & Control Monthly - April 2024Water Industry Process Automation & Control Monthly - April 2024
Water Industry Process Automation & Control Monthly - April 2024
 
DC MACHINE-Motoring and generation, Armature circuit equation
DC MACHINE-Motoring and generation, Armature circuit equationDC MACHINE-Motoring and generation, Armature circuit equation
DC MACHINE-Motoring and generation, Armature circuit equation
 
UNIT - IV - Air Compressors and its Performance
UNIT - IV - Air Compressors and its PerformanceUNIT - IV - Air Compressors and its Performance
UNIT - IV - Air Compressors and its Performance
 
VIP Call Girls Palanpur 7001035870 Whatsapp Number, 24/07 Booking
VIP Call Girls Palanpur 7001035870 Whatsapp Number, 24/07 BookingVIP Call Girls Palanpur 7001035870 Whatsapp Number, 24/07 Booking
VIP Call Girls Palanpur 7001035870 Whatsapp Number, 24/07 Booking
 
Cara Menggugurkan Sperma Yang Masuk Rahim Biyar Tidak Hamil
Cara Menggugurkan Sperma Yang Masuk Rahim Biyar Tidak HamilCara Menggugurkan Sperma Yang Masuk Rahim Biyar Tidak Hamil
Cara Menggugurkan Sperma Yang Masuk Rahim Biyar Tidak Hamil
 
Minimum and Maximum Modes of microprocessor 8086
Minimum and Maximum Modes of microprocessor 8086Minimum and Maximum Modes of microprocessor 8086
Minimum and Maximum Modes of microprocessor 8086
 
2016EF22_0 solar project report rooftop projects
2016EF22_0 solar project report rooftop projects2016EF22_0 solar project report rooftop projects
2016EF22_0 solar project report rooftop projects
 
Thermal Engineering -unit - III & IV.ppt
Thermal Engineering -unit - III & IV.pptThermal Engineering -unit - III & IV.ppt
Thermal Engineering -unit - III & IV.ppt
 
Block diagram reduction techniques in control systems.ppt
Block diagram reduction techniques in control systems.pptBlock diagram reduction techniques in control systems.ppt
Block diagram reduction techniques in control systems.ppt
 
Unit 2- Effective stress & Permeability.pdf
Unit 2- Effective stress & Permeability.pdfUnit 2- Effective stress & Permeability.pdf
Unit 2- Effective stress & Permeability.pdf
 
VIP Model Call Girls Kothrud ( Pune ) Call ON 8005736733 Starting From 5K to ...
VIP Model Call Girls Kothrud ( Pune ) Call ON 8005736733 Starting From 5K to ...VIP Model Call Girls Kothrud ( Pune ) Call ON 8005736733 Starting From 5K to ...
VIP Model Call Girls Kothrud ( Pune ) Call ON 8005736733 Starting From 5K to ...
 
data_management_and _data_science_cheat_sheet.pdf
data_management_and _data_science_cheat_sheet.pdfdata_management_and _data_science_cheat_sheet.pdf
data_management_and _data_science_cheat_sheet.pdf
 
Unleashing the Power of the SORA AI lastest leap
Unleashing the Power of the SORA AI lastest leapUnleashing the Power of the SORA AI lastest leap
Unleashing the Power of the SORA AI lastest leap
 
notes on Evolution Of Analytic Scalability.ppt
notes on Evolution Of Analytic Scalability.pptnotes on Evolution Of Analytic Scalability.ppt
notes on Evolution Of Analytic Scalability.ppt
 
ONLINE FOOD ORDER SYSTEM PROJECT REPORT.pdf
ONLINE FOOD ORDER SYSTEM PROJECT REPORT.pdfONLINE FOOD ORDER SYSTEM PROJECT REPORT.pdf
ONLINE FOOD ORDER SYSTEM PROJECT REPORT.pdf
 
Work-Permit-Receiver-in-Saudi-Aramco.pptx
Work-Permit-Receiver-in-Saudi-Aramco.pptxWork-Permit-Receiver-in-Saudi-Aramco.pptx
Work-Permit-Receiver-in-Saudi-Aramco.pptx
 
Call Girls in Ramesh Nagar Delhi 💯 Call Us 🔝9953056974 🔝 Escort Service
Call Girls in Ramesh Nagar Delhi 💯 Call Us 🔝9953056974 🔝 Escort ServiceCall Girls in Ramesh Nagar Delhi 💯 Call Us 🔝9953056974 🔝 Escort Service
Call Girls in Ramesh Nagar Delhi 💯 Call Us 🔝9953056974 🔝 Escort Service
 
University management System project report..pdf
University management System project report..pdfUniversity management System project report..pdf
University management System project report..pdf
 

Vibration monitoring

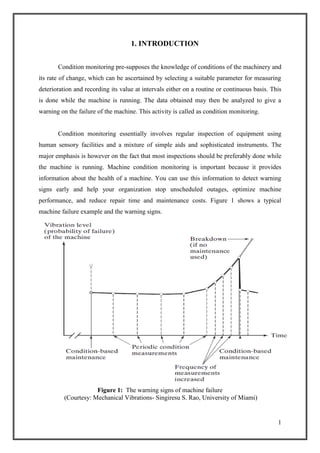
  • 1. 1 1. INTRODUCTION Condition monitoring pre-supposes the knowledge of conditions of the machinery and its rate of change, which can be ascertained by selecting a suitable parameter for measuring deterioration and recording its value at intervals either on a routine or continuous basis. This is done while the machine is running. The data obtained may then be analyzed to give a warning on the failure of the machine. This activity is called as condition monitoring. Condition monitoring essentially involves regular inspection of equipment using human sensory facilities and a mixture of simple aids and sophisticated instruments. The major emphasis is however on the fact that most inspections should be preferably done while the machine is running. Machine condition monitoring is important because it provides information about the health of a machine. You can use this information to detect warning signs early and help your organization stop unscheduled outages, optimize machine performance, and reduce repair time and maintenance costs. Figure 1 shows a typical machine failure example and the warning signs. Figure 1: The warning signs of machine failure (Courtesy: Mechanical Vibrations- Singiresu S. Rao, University of Miami)
  • 2. 2 2. VIBRATION MONITORING Vibration monitoring is a well established method for determining the physical movements of the machine or structure due to imbalanced alignment of the mountings, this method is very simple and it is very easy to use and understand or even carry out sophisticated real time analysis. Vibration monitoring usually involves the attachment of a transducer to a machine to record its vibration level special equipments are also available for using the output from sensor to indicate vibrational problem and even its precise cause. Vibration monitoring involves measuring the frequency and amplitude of vibrations. It is well Known that readings of machinery will change as the wear sets in. such readings can be interpreted as indicators of the systems condition, and timely maintenance actions can be scheduled accordingly. Electrical machines and mechanical reciprocating or rotating machines generate their own vibration patterns (signatures) during operation. However such raw signals contain a lot of background noise, which makes it difficult or even impossible to extract useful, precise information by simply measuring the overall signal. It is thus necessary to develop an appropriate filter to remove the operationally and environmentally contaminated components of signals so as to reveal the clear signals generated by the events under study. To capture useful condition monitoring data, vibration should be measured at carefully chosen points and directions. Transducers used for the measurement of vibrations might work on electromagnetic, electrodynamics, capacitive, piezoelectric, or strain gauge principles. Out of all among these piezoelectric accelerometers are most widely used. Among the monitoring techniques vibration monitoring has gained considerable importance because of following fundamental factors 1) All rotational and reciprocating machines vibrate because of defects or inaccuracies in the system. 2) When inaccuracies are more it results in increased vibration and each kind of defect provides a vibration characterized in the unique way. Therefore characteristic vibration of the machinery reveal the health condition of machine.
  • 3. 3 3. HISTORY OF VIBRATION MONITORING In the early days, the system's maintenance was conducted only when the equipment failed. The work was more “fix it” than maintenance .But nowadays it is more like performing regular maintenance and renovation tasks on the equipment which could keep equipment operating for longer periods. This is known as Periodic Maintenance, Calendar Based Maintenance or Preventive Maintenance (PM). The goal in this case was to achieve that the equipment would be able to operate most of the time until the next scheduled maintenance outage. This approach is also outdated. Now Condition monitoring has made good progress in recent years, maintenance is being carried out based on condition of machine which reduces the cost of unnecessary opening of equipment Most of the defects encountered in the rotating machinery gives rise to a distinct vibration pattern. Vibration Monitoring is the ability to record and identify vibration “Signatures” which makes the technique so powerful for monitoring rotating machinery. In recent years as observed by R.K BISWAS, states that Condition Monitoring is defined as the collection, comparison and storage of measurements defining machine condition. Almost everyone will recognize the existence of a machine problem sooner or later. SIMMONS showed that vibrations from their sources origin may be small but excite the resonant frequencies of the rotating parts such as the rotor shaft and set-up considerable extra dynamic load on bearings. This will cause and effect reinforcements such that the machine will progresses towards ultimate break down. As per GYARMATHY, there are generally two situations in which vibration measurements are taken. One is surveillance mode to check the health of machinery on routine basis. The second situation is during an analysis process where the ultimate goal is to tag the problem. In the later case, vibration measurements are taken to understand the cause, so that an appropriate fix can be undertaken.
  • 4. 4 4. TYPES OF VIBRATION MONITORING SYSTEM Vibration monitoring systems are broadly classified into two types which are given as follows 1) Periodic monitoring system or off-line monitoring: In this type of monitoring system machine vibration is measured or recorded initially and later it will be analyzed at selected time intervals in the field. Then an analysis is made either in the field or in the laboratory. Advanced analysis techniques are required for fault diagnosis and trend analysis. Intermittent monitoring provides information at a very early stage about early failure and usually it is used when  Very early warning of faults is required.  Advanced diagnostics are required.  Measurements are made at many locations on a machine.  Machines are complex. Figure 2: AC vibration monitoring systems - typical offline set-up using a standard 100mV/g accelerometer.
  • 5. 5 2) Permanent monitoring system or online monitoring: In this type of monitoring system machine vibration is measured continuously at selected points of the machine and is constantly compared with acceptable levels of vibration. The principal function of a permanent condition monitoring system is to protect one or more machines by providing a warning that the machine is operating improperly and/or to shut the machine down when a preset safety limit is exceeded, thereby avoiding catastrophic failure and destruction. The measurement system may be permanent, or it may be quasi-permanent. In a permanent monitoring system, transducers are mounted permanently at each selected measurement point. For this reason, this type of a system can be very costly. These systems are usually used in very critical applications such as when  No personnel are available to perform measurements (offshore, remote pumping stations etc).  It is necessary to stop the machine before a breakdown occurs in order to avoid a catastrophic accident.  An instantaneous fault may occur that requires machine shutdown.  The environment (explosive, toxic, or high-temperature) does not permit the human involvement required by intermittent measurements. Before a permanent monitoring system is selected, preliminary measurements should be made periodically over a period of time to become acquainted with the vibration characteristics of the machine. This procedure will make it possible to select the most appropriate vibration measurement parameter, frequency range, and normal alarm and trip levels. Figure 3: A Continuous vibration monitoring system
  • 6. 6 5. ESTABLISHING A CONDITION MONITORING PROGRAM A condition monitoring program is established to check the satisfactory operation of a single machine or, more usually, it is established to check the operation of a number of machines, perhaps all the machines in an entire plant. The following steps are usually considered in the establishment of such a program, depending upon on the type of machine and impact of failure on the operations of machine. Figure 4: Basic vibration measurement scheme (Courtesy: Mechanical Vibrations- Singiresu S. Rao, University of Miami) Step 1. Determine the type of condition monitoring system, described in the above section that best meets the needs of the plant. Step 2. Make a list of all of the machines to be monitored (see, for example, Table 1), based on the importance of these machines in the production line. TABLE 1. Machinery Classification for Monitoring Machinery classification Result of failure Critical Unexpected shutdown or failure causes significant production loss. Interrupts production Unexpected shutdown or failure causes minor interruptions in production lines. Causes inconvenience Inconvenience in operation, but no interruption in production. Noncritical Production is not affected by failure. Step 3. Tabulate the characteristics of the machines that are important in conducting vibration analyses of the machines of step 2.These characteristics are associated with machine construction such as the natural frequencies of shafts, casings, and pedestals, and
  • 7. 7 operational and defect responses. A tabulation of machine frequencies is important because fault analysis is conducted by matching machine frequencies to measured frequencies appearing in a spectrum. The following machine characteristics provide the necessary information for fault analysis.  Shaft rotational speeds, bearing defect frequencies, number of teeth in gears, number of vanes and blades in pumps and fans, number of motor poles and number of stator slots and rotor bars.  Vibratory forces such as due to misalignment, mass unbalance and reciprocating masses.  Vibration responses due to process changes, such as temperature and pressure.  Fault responses associated with specific machine types, such as motors, pumps and fans.  Sensitivity to instability in components, such as fluid film bearings and seals due to wear and clearance.  Loads or changes in operating conditions. Figure 5: Displacement and velocity spectra obtained under identical conditions (Courtesy: CONDITION MONITORING OF MACHINERY-Joëlle Courrech and Ronald L.Eshleman) Step 4. Select the most appropriate vibration measurement parameter. When an accelerometer is employed as the sensing device in a condition monitoring system, the resulting acceleration signal can be electronically integrated to obtain velocity or displacement, so any one of these three parameters may be used in measurements. The appropriate parameter may be selected by application of the following simple rule as stated below Use the parameter which provides the “flattest” spectrum. The flattest spectrum requires the least dynamic range from the instrumentation which follows the transducer. For
  • 8. 8 example, Fig.5 shows a velocity spectrum and a displacement spectrum obtained under identical conditions. The dynamic range (i.e., the range from the highest to the lowest signal level) required to measure the displacement spectrum is much larger than the range for the velocity spectrum; it may even exceed the available dynamic range of the instrumentation. Therefore, according to this rule, velocity measurements should be selected. The flattest spectrum rule applies only to the frequency range of interest. Therefore, the parameter selection to some extent, depends on the type of machine and the type of faults considered. Step 5. Select one of the following vibration pickups that will best meet the requirements of step 4. Displacement Transducer. A displacement transducer is a transducer that converts an input mechanical displacement into an electrical output that is proportional to the input displacement. Displacement transducer of the eddy-current type which have no contacting probes, are commonly used to measure the relative motion between a shaft and its bearings. This information can be related directly to physical values such as mechanical clearance or oil-film thickness, e.g., it can give an indication of incipient rubbing. Shaft vibration provides information about the current condition of a machine and is principally used in permanent monitoring systems, which immediately shut the machine down in the event of trouble. The use of displacement transducers is essential in machinery having journal bearings. However, proximity probe transducers are i. Usually difficult to calibrate absolutely. ii. Have limited dynamic range because of the influence of electrical and mechanical run out on the shaft. iii. Have a limited high-frequency range. Accelerometers and Velocity Pickup. Pickups of this type, are usually lightweight and rugged. They are always used for detecting faults which occur at high frequencies (say, above 1000 Hz), for example, to detect rolling element bearing deterioration or gearbox wear. Acceleration measurements of bearing vibration will provide very early warning of incipient faults in a machine.
  • 9. 9 Figure 6: An Accelerometer Step 6. Select the measurement locations. When a periodic (off-line) monitoring system is employed, the number of points at which measurements are made is limited only by the requirement for keeping measurement time to a minimum. As a general rule, bearing vibration measurements are made in the radial direction on each accessible bearing and in the axial direction on thrust bearings. It is not usually necessary to measure bearing vibration in both the horizontal and the vertical direction, since both measurements give the same information regarding the forces within the machine. This information is merely transmitted through two different transmission paths, this will be used for detecting developing faults. It will later be seen however, in order to subsequently diagnose the origin of the impending fault, measurements in both the horizontal and the vertical direction may give valuable information. When measuring shaft vibrations with permanently mounted proximity transducers, it is convenient to use two probes on each bearing, located at 90° from each other, thereby providing an indication of the orbit of the shaft within the bearing. Axial displacement transducers, programmed to shut the machine down on preset levels, are mounted where a thrust measurement will protect the machine rotating parts, such as blades, from rubbing the stationary casing due to fault induced axial forces. When a permanent (on-line) monitoring system is employed using a seismic pickup, the number of measurement points usually is minimized for reasons of economy. Selection must be made following a study of the vibration spectra of different bearings in order to locate those points where all significant components related to the different expected faults are transmitted at measurable vibration
  • 10. 10 levels if full spectrum comparison is performed. If only broadband measurements are monitored, then a further requirement is that all frequency components related to the expected faults must be of approximately the same level within the selected frequency range. Otherwise, measurements must be made in selected frequency bands. Step 7. Select the time interval between measurements. The selection of the time interval between measurements requires knowledge of the specific machine. Some machines develop faults quickly, and others run trouble-free for years. A compromise must be found between the safety of the system and the time taken for measurements and analysis. Measurements should be made frequently in the initial stages of a condition monitoring program to ensure that the vibration levels measured are stable and that no fault is already developing. When a significant change is detected, the time interval between measurements should be reduced sufficiently so as not to risk a breakdown before the next measurement .The trend curve will help in determining when the next measurement should be performed. Step 8. Establish an optimum sequence of data acquisition. The sequence in which data acquired in a condition monitoring program must be planned so that the data are acquired efficient. For example, the data collection may be planned on the basis of plant layout, or the type of data required, or on the sequence of components in the machine train, from driver to driven components.
  • 11. 11 6. FAULT DETECTION IN ROTATING MACHINERY It is required to detect all types of faults likely to occur during the operation of rotating machinery. Such faults range from vibrations at very low frequencies at vibrations at very high frequencies. Such detection should be applicable to the complete range of machines in a plant, which operate from very low to very high speed. This requires the selection of equipment and analysis techniques which cover a very broad frequency range. Measurements of absolute vibration levels of bearings provide no indication of the machine‟s condition, since they are influenced by the transmission path between the force and the measurement point, which may amplify some frequencies and attenuate others. Bearing vibration levels change from one measurement point to another on a given machine, since the transmission paths are different. They also change for the same reason from machine to machine for measurements made at the same measurement point. Therefore, in estimating the condition of a machine, it is essential to monitor changes in vibration from a reference value established when the machine was known to be in good condition. Changes are expressed as a ratio or, more commonly as a change of level i.e., the log of a ratio, in decibels. The main objective of condition monitoring of a machine is to predict a fault well in advance of its occurrence. Therefore, a measurement of the overall vibration level will not provide successful prediction because the highest vibration component within the overall frequency range will dominate the measurement. This is illustrated in Fig.7, which shows an example where overall measurements of the vibration velocity resulted in an incorrect prediction with an overestimate of the lead time. The early detection of faults in machinery can be made successfully only by comparison with a reference spectrum. This section compares types of spectrum analysis for this purpose.
  • 12. 12 Figure 7: Trend analysis performed on an overall measurement and on an individual component. (A) The velocity spectrum of vibration measured on a gearbox after installation. Note the high amplitude of the 480-Hz component, dominating the reference spectrum. (B) The velocity spectrum 3 months later (Courtesy: CONDITION MONITORING OF MACHINERY-Joëlle Courrech and Ronald L. Eshleman) Condition monitoring techniques employed during transient operating conditions of the machine (i.e., when the machine is running up to full speed or slowing down from full speed) differ significantly from the techniques employed during steady-state operating conditions. Therefore it is essential that a careful investigation be carried out to ensure that the condition monitoring technique selected is appropriate for the conditions of measurement. 7. FALSE ALARMS Changes in machinery vibration may result from a number of causes which are not necessarily related to the deterioration of the machine. For example, a change in speed of the machine or a change in the load on the machine usually greatly modifies the relative amplitudes of the different components of vibration at a fixed transducer location or modifies the relative pattern of vibration at different locations. Depending on the criteria used for fault detection, such changes may result in a false indication of deterioration of the machine. Appropriate selection of the technique employed can avoid such false alarms.
  • 13. 13 8. VIBRATION ANALYSIS Vibration analysis is most commonly used for condition monitoring of machinery. Vibration in machines are caused by cyclic excitation forces arising from imbalances, wear, or failure of parts. What type of changes occur in the vibration level, how these changes can be detected, and how the condition of the machine is interpreted has been the topic of several research studies in the past. Some of the vibration analysis techniques are given below. Time-Domain Analysis: Time-domain analysis uses the time history of the signal. The signal is stored in an oscilloscope or a real time analyzer and any nonsteady or transient impulses are noted. Discrete damages such as broken teeth in gears and cracks in inner or outer races of bearings can be identified easily from the waveform of the casing of a gearbox. As an example, Fig.8 shows the acceleration signal of a single stage gearbox. The pinion of the gear pair is coupled to a 5.6-kW, 2865-rpm, AC electric motor. Since the pinion (shaft) speed is 2865 rpm or 47.75 Hz, the period can be noted as 20.9 ms. The acceleration waveform indicates that pulses occur periodically with a period of 20 ms approximately. Noting that this period is the same as the period of the pinion, the origin of the pulses in the acceleration signal can be attributed to a broken gear tooth on the pinion. Figure 8: Time-domain waveform of a faulty gearbox (Courtesy: Mechanical Vibrations- Singiresu S. Rao, University of Miami)
  • 14. 14 Indices: In some cases, indices such as the peak level or the root mean square level and the crest factor are used to identify damage in machine condition monitoring. Since the peak level occurs only once, it is not a statistical quantity and hence is not a reliable index to detect damage in continuously operating systems. Although the RMS value is a better index to detect damage in steady-state applications, it may not be useful if the signal contains information from more than one component, as in the case of vibration of a complete gearbox that consists of several gears, shafts, and bearings. The crest factor, defined as the ratio of the peak to RMS level, includes information from both the peak and the RMS levels. However, it may also not be able to identify failure in certain cases. For example, if the failure occurs progressively, the RMS level of the signal might be increasing gradually, although the crest factor might be showing a decreasing trend. Orbits: Sometimes, certain patterns known as Lissajous figures can be obtained by displaying time waveforms obtained from two transducers whose outputs are shifted by 90° in phase. Any change in the pattern of these figures or orbits can be used to identify faults such as misalignment in shafts, unbalance in shafts, shaft rub, wear in journal bearings, and hydrodynamic instability in lubricated bearings. Figure 9, illustrates a change in orbit caused by a worn bearing. The enlarged orbit diameter in the vertical direction indicates that the bearing has become stiffer in the horizontal direction that is, it has more bearing clearance in the vertical direction. Figure 9: Change in orbit due to a bearing failure (Courtesy: Mechanical Vibrations- Singiresu S. Rao, University of Miami)
  • 15. 15 Frequency-Domain Analysis: The frequency-domain signal or frequency spectrum is a plot of the amplitude of vibration response versus the frequency and can be derived by using the digital fast Fourier analysis of the time waveform. The frequency spectrum provides valuable information about the condition of a machine. The vibration response of a machine is governed not only by its components but also by its assembly, mounting and installation. Thus the vibration characteristics of any machine are somewhat unique to that particular machine; hence the vibration spectrum can be considered as the vibration signature of that machine. As long as the excitation forces are constant or vary by small amounts, the measured vibration level of the machine also remains constant or varies by small amounts. However, as the machine starts developing faults, its vibration level and hence the shape of the frequency spectrum change. By comparing the frequency spectrum of the machine in damaged condition with the reference frequency spectrum corresponding to the machine in good condition, the nature and location of the fault can be detected. Another important characteristic of a spectrum is that each rotating element in a machine generates identifiable frequency, as illustrated in Fig.10, thus the changes in the spectrum at a given frequency can be attributed directly to the corresponding machine component. Since such changes can be detected more easily compared to changes in the overall vibration levels, this characteristic will be very valuable in practice. Since the peaks in the spectrum relate to various machine components, it is necessary to be able to compute the fault frequencies. A number of formulas can be derived to find the fault frequencies of standard components like bearings, gearboxes, pumps, fans, and pulleys. Figure 10: Relationship between machine components and the vibration spectrum. (Courtesy: Mechanical Vibrations- Singiresu S. Rao, University of Miami)
  • 16. 16 Vibration Analysis is a two step process involving the ACQUISITION and INTERPRETATION of machinery vibration data. Its purpose is to determine the mechanical condition of a machine and specific mechanical or operational defects. The Data Acquisition procedure is a means of systematic measuring and recording of the vibration characteristics needed to analyze a problem. The Data Interpretation involves comparing the recorded data with the details of the machine, like its speed or speeds, its foundations, the construction details etc. then the characteristic of vibration typical of various defects are compared with the characteristics that have been measured. By this, one can pinpoint the trouble and take corrective measures. 9. DATA ACQUISITION Data acquisition is the essential first step in vibration analysis, since the right data must be acquired under the right conditions to completely interpret a machine‟s condition. Data acquisition can be done in several ways depending on the available instruments. Apart from data acquisition, additional data acquisition procedure such as semi-automatic, automatic and real time analysis are employed where the job can be quicker and more accurate. In the semi-automatic method, the operator manually adjusts the filter through the frequency ranges, while the data is automatically recorded in a recorder. These types of plots are records of vibration amplitudes in the „Y‟ axis and the frequencies in the „X‟ axis. Such a plot is called Machinery Vibration Profile (Signature) and the analysis of the same is called as Signature Analysis. Automatic data acquisition is the term used to describe the procedure of obtaining the data, where the instrument automatically plots the vibration profiles. This type of instrument incorporates and electronically swept filter as well as provisions for simultaneous plotting of data with the recorders.
  • 17. 17 Selection of Measurement Parameters The various measurement parameters are displacement, velocity and acceleration Displacement: Displacement can be measured with both velocity and acceleration pickups. This is accomplished by means of integrator circuits that are normally included in the circuit of vibration meters and analyzers. Pickups that respond directly to vibration displacement are readily available, but are usually used in the non-contact pickups. Velocity: Velocity can also be measured with both velocity and acceleration pickups. Seismic and piezoelectric velocity pickups obtain vibration directly. The output from an accelerometer can be integrated to produce the equivalent of a velocity measurement, down to about 3Hz. Acceleration: Acceleration should be measured only with an accelerometer. It is theoretically possible to differentiate signals from a velocity transducer to produce acceleration readings, but this would be needlessly complicated and expensive. Common Types of Measurements used in vibration analysis: The common types of measurements used are as follows: 1) Overall vibration amplitude measurements: Overall vibration amplitude measurements provide a quick check of general machinery condition. A vibration meter or analyzer can be used for these measurements. This measurement is generally manually recorded in tabular form, or the data automatically stored in memory for computer based automated instruments 2) Amplitude Vs Frequency measurements: Amplitude Vs Frequency measurements provide frequency spectrum which is used to pinpoint the problem to a specific frequency or range of frequencies. Full capacity or advanced check analyzers are required to take these measurements. Data can be recorded manually in tabular form, or by semi automatic or automatic swept filter
  • 18. 18 analysis with tabular or graphic hard copy recording of the data. FFT type analyzer can also provide tabular/graphic hard copy of visual display of the data. It is estimated that over 85% of the mechanical problems occurring on rotating machinery can be identified by displaying the vibration Amplitude Vs Frequency data. Figure 11: A simple Amplitude vs Frequency curve Importance of tri-axial readings: It is common practice to record the Amplitude Vs Frequency data measured in the horizontal, vertical and axial pickup directions at each bearing of the machines being analyzed. Obtaining measurements in all the three directions is extremely important for distinguishing between various mechanical problems. E.g. Unbalance, Misalignment, bend shaft structural weakness (loose parts) will generally cause vibration at a frequency 1 RPM. Unbalance will almost always produce high amplitudes in the horizontal direction while lower amplitudes in the axial direction. Misalignment of couplings and bearings or a bend shaft will generally show relatively high amplitude of vibration in the axial direction. Amplitudes due to structural weakness, loose parts are shown in Vertical direction 3) Amplitude Vs Time measurements: Time measurements can be made during machine operation to detect vibrations that would not be apparent from Amplitude Vs Frequency analysis. Amplitude Vs Time measurements can be made for very fast transient vibrations or for slowly occurring vibrations. For fast transient vibrations use an oscilloscope with the horizontal axis scaled in milliseconds. For slowly varying vibrations use a recorder with the horizontal axis scaled in seconds. It can be taken with a DC recorder connected to an analyzer with that built-in- capability.
  • 19. 19 Figure 12: A typical Amplitude vs Time curve. 4) Phase measurements: Phase measurements are important when analyzing mechanical problems in machinery. Phase is defined as the position of a vibrating part at a given instance with reference to a fixed point or another vibrating part. Phase measurements offer a convenient way to determine how one part is vibrating relative to another part. To obtain phase measurements, an analyzer with a strobe light or remote reference pickup is required. The use of strobe light necessities visual observation of the rotating shaft and the capability to fire the strobe light with vibration signal in order to obtain phase. The remote phase pickup, which is usually an electromagnetic pickup, non-contact transducer or photocell must be installed so that to observe mechanical protrusion (depression) or a reflective mark on the shaft. The strobe light measurement involves observing the angular position of the reference mark that appears under the strobe light, while the remote reference pickup provides phase readout (digital or analog) using a meter on the analyzer. .
  • 20. 20 10. DATA INTERPRETATION Once the necessary information have been collected by manual, or semi-automatic or automatic, the next step is to review and compare the reading with the characteristics of vibration typical of various types of troubles. A key to this comparison is the frequency. If a machine part has some defect, the frequency of vibration resulting from this defect will be a multiple of the RPM. This multiplying factor will be different for different defects. Also there are some defects which will produce vibration frequencies that are not related with the speed of the rotor. Causes of Vibration and its identification through data interpretation The major causes of vibration on Rotary machines are i) Unbalance: It is found that the vibration caused due to unbalance in the machinery parts will be identified by observing the Vibration amplitude Vs frequency data curves generated by the recorder. ii) Mechanical looseness: The vibration may be the result of loose mounting bolts, excessive bearing clearance, a crack or break in the structure or bearing pedestal, a rotor which is loose on the shaft, or some other loose machine component. The vibration characteristic of mechanical looseness will not occur unless there is some other exciting force such as unbalance or misalignment which can result in large amplitudes of looseness vibration. The vibration due to looseness can be detected from Amplitude Vs Frequency when taking the reading in vertical direction. iii) Misalignment: Misalignment is an extremely common problem. Misalignment, even with flexible couplings, results in two forces, axial and radial vibration. The significant characteristic of misalignment and bent shafts is that vibration will be noted in both the radial and axial directions. As a result, a comparative axial vibration is the best indication of misalignment or a bent shaft.
  • 21. 21 iv) Defective antifriction bearing: Flaws on the raceways, balls or rollers of rolling element bearings cause high-frequency vibrations and the frequency is not just the multiple of the shaft RPM. The amplitude of vibration depends on the extent of the bearing fault. The natural frequency vibrations typically occur as vibration peaks in the 10,000 to 100,000 CPM. Defects in the bearing components can generate vibration peaks at frequencies related to the bearing geometry. The vibration generated by the bearing is not normally transmitted to other points of the machine. 11. USE OF COMPUTERS IN CONDITION MONITORING PROGRAMS Computers can be of great help in a condition monitoring program in handling, filing and storing data and in performing tedious computations such as spectrum comparison and trend analysis. A condition monitoring system which incorporates a computer includes: 1. A recording device for storing the analog or digital time signals or frequency spectra. In a permanently installed monitoring system, the analog time signal is directly connected to the following items. 2. An analyzer with both fast Fourier transform (FFT) narrowband analysis and advanced diagnostic techniques (zoom, cepstrum) for diagnostics. 3. A computer and appropriate software which provides a. Management of the measurement program, including route mapping, storage of reference spectra/cepstra, and new spectra/cepstra; b. A comparison of spectra and a printout of significant changes; c. Trend analysis of any chosen parameter (individual component or overall level in a given frequency range). In a permanent monitoring system, the complete process (i.e., a new analysis) is performed automatically at a predetermined rate, which is adjusted as the fault develops.
  • 22. 22 CONCLUSION In this report an attempt was made to understand the concept of vibration monitoring and the techniques associated with it. In most of the practical applications, it might be very difficult to develop a mathematical model, derive the suitable governing equations and conduct analysis to predict the vibration characteristics of the system. In such cases, vibration characteristics of the system are measured under known input conditions and a mathematical model is developed. This technique of measuring vibrational characteristics of a system is helpful in analyzing and interpreting the behaviour of the system. In this work, the concept of vibration monitoring systems and the various types of systems have been explained. The steps involved in establishing a vibration monitoring system have been discussed. Further, some of the vibration analysis techniques have been explained to achieve condition monitoring of the system. Also, the applications of vibration monitoring has been highlighted and recent developments to achieve condition monitoring using computer programs have been listed.
  • 23. 23 REFERENCES [1] Eshleman, R. L., “Machinery Vibration Analysis II Notes,” Vibration Institute, Willowbrook, Ill., 2000. [2] Eshleman, R. L.: “Basic Machinery Vibrations,” VI Press, Clarendon Hills, Ill., 1999. [3] Mitchell, J. S.: “An Introduction to Machinery Analysis and Monitoring,” Penwell Publishing Company, Tulsa, Okla., 1981 [4] Joëlle Courrech and Ronald L. Eshleman, "Condition monitoring of machinery", A paper on Condition monitoring and analysis. [5] A book on "Mechanical Vibrations" by Singiresu S. Rao, University of Miami. (ISBN 978-0- 13-212819-3) Page no: 870-928.