
Recomendados
Más contenido relacionado
Similar a Transparencies ch02-pp192-201
Similar a Transparencies ch02-pp192-201 (20)
Más de lschmidt1170
Más de lschmidt1170 (20)
Último
Último (20)
Transparencies ch02-pp192-201
- 1. From Teaching Geography, Second Edition, by Phil Gersmehl. Copyright 2008 by The Guilford Press. Permission to photocopy is granted to purchasers of this book for personal use only (see copyright page for details). 192
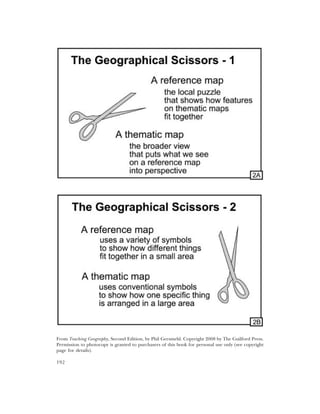
- 2. Teacher ’s Guide for Transparency 2A I debated in writing this book whether to refer to the scissors diagram at the beginning or end of the chapter. At the beginning, it would serve as a reminder of the scissors analogy, one of the main themes in this book. At the end, it would summarize that main point. I decided to do it at the beginning, but I still wonder if placing it at the end would have been a better way to convey the material in this chapter. Activity: Explain the scissors idea and then describe a place and ask students to think of how regional and topical analysis could work together to look at that place. Then, ask them how they might design a reference map to show the features in that place and some thematic maps to show the global pattern of some of the things that are important in that particular place. Or reverse the process – show some maps about one place first, and then ask for other examples of the geographical scissors at work. Chapter 5 covers deductive and inductive reasoning and the use of themes in teaching. Here, let us just say that a teacher could use any of the diagrams in this book as a framework for discussion. There are no hard and fast rules about what works best in a given situation. In fact, most of the metaphors and other examples in this book have been used in any number of ways. Teacher ’s Guide for Transparency 2B It is often useful to show the same diagram several times during a class period, in order to review or amplify a point. Better yet, use several variations of an important diagram at differ- ent times in the discussion. Repetition with slight variations helps students abstract the key con- cepts and eliminate unnecessary detail. 193
- 3. From Teaching Geography, Second Edition, by Phil Gersmehl. Copyright 2008 by The Guilford Press. Permission to photocopy is granted to purchasers of this book for personal use only (see copyright page for details). 194
- 4. Teacher ’s Guide for Transparency 2C A reference map shows the locations and spatial relationships of several different kinds of things. To show many different kinds of information, a reference map might have a fairly large legend, because the legend must show the symbols used to depict features like mountains, rivers, swamps, cities, roads, and so on. The designer of a reference map can make the map reader’s task easier by selecting symbols that are easy to remember (e.g., wiggly lines for rivers, fuzzy patterns for forests). Color cer- tainly helps, and there are “natural” associations colors with some features (e.g., green with trees, blue with water, gray with roads). Activity: Post or project some reference maps from atlases, newspapers, or magazines. Then cover the legend and ask students what they think specific symbols might mean. Have them dis- cuss why they associate particular meanings with particular colors, patterns, or other symbols. Summarize by pointing out that a good map maker usually tries to choose symbols that are intuitively clear to the intended readers of the map or that have become conventionally accepted ways of symbolizing particular features. Teacher ’s Guide for Transparency 2D A thematic map shows the spatial pattern of only a few things, sometimes only one. The designer of a thematic map can make the map reader’s job easier by using established conven- tions for showing each idea – dots for cities, for example, or shaded areas for forests or prop- erty ownership, isolines for elevation or temperature, choropleth color gradations for ratios such as crime rate or population density, and so forth. In the Transparencies that are thematic maps in this book I’ve tried to include a variety of topics and maps, to illustrate the many differ- ent approaches and symbols that can be used for different tasks (see the CD unit on Choosing Tools). Activity: To help students learn how to evaluate maps, find a number of reference and the- matic maps in newspapers, magazines, or online sites. Post or project them, and have students try to classify the maps into four categories: Primarily reference maps, such as USGS topographic maps or maps of a whole country, such as often appear in newspaper, encyclopedia, and magazine articles. Primarily thematic maps, such as dot maps of population, choropleth maps of household income, isoline maps of temperature. Mixtures of the two, as in the case of a map that emphasizes a single topic such as the locations of nuclear power plants but that also may show roads, cities, rivers, mountains, and other reference information. Badly designed maps, with unnecessary information or symbols that are unclear. Since this is a rather basic skill, it is probably better to choose clear examples in which the cate- gory is fairly easy to distinguish (in other words, don’t start the discussion with too many exam- ples in the last category!). Many of the Transparencies in this book are useful as illustrations of appropriate map symbols to express particular ideas. Cartographic literacy is not as easy to learn as some people seem to think (why else would we see so many juicy examples of terrible map design in newspapers and magazines?) 195
- 5. From Teaching Geography, Second Edition, by Phil Gersmehl. Copyright 2008 by The Guilford Press. Permission to photocopy is granted to purchasers of this book for personal use only (see copyright page for details). 196
- 6. Teacher ’s Guide for Transparency 2E Reference maps, by their very nature, tend to be cluttered. This can make it hard to discern the spatial patterns of specific features (unless the cartographer is very skillful). This Transparency is a more complex version of Transparency 2C, and 2F is a more complex version of 2D. Activity: Ask students to trace the outline of a country, state, or other area shown on a refer- ence map, and then try to transfer a single feature from the reference map to their new outline version of it. For example, one student could try to copy all cities in their approximate loca- tions; another could copy rivers, mountain areas, and so forth. This is called “extracting a theme” from a reference map. In effect, one is taking informa- tion from a reference map and making a thematic map of it. The ability to copy things in their correct relative locations is an acquired skill that is useful for many purposes. This is the kind of exercise students should practice a number of times, in a number of different contexts. For example, in a history class, students might extract the pattern of forts from a reference map of the 13 colonies at the time of the American Revolution (see Transparency 6R). Teacher ’s Guide for Transparency 2F This map deals with the same topic as Transparency 2D, but it uses different symbolic “lan- guage” to make its point. To see a third option, look at the CD unit on the Spread of Islam. Many of the skills the National Geography Standards focus on involve selecting appropriate symbols for specific kinds of information and then analyzing the pattern. Activity: Find thematic maps that use appropriate symbols (see the CD unit on Choosing Tools): Isolines for climatic data, such as temperature or growing season (Transparencies 3J and 4J). Shading for surface features, such as glaciers (3L) or malaria (4V). Choropleth maps of ratio (“per”) data in political areas, such as farm production per per- son (1B) or welfare payments per family (4Y). Dots for discrete features, such as plantations (4X), settlements (9C), or video stores (10A). Cover the title and legend of the map. Then post or project the map and ask students to describe the geographic pattern they see on the map: Does the feature cover a large or small part of the map? Is the feature evenly spread across the map or is it primarily on one side of the area? Is the feature shown on the map dispersed evenly? or does it occur in clusters? long strings? pairs, trios, rings, or other shapes? Is the general shape of the pattern round or elongated? if elongated, in what direction? is the alignment of individual pairs, trios, or strings consistent throughout the map, or are they oriented in different directions? (See the CD unit on Spatial Patterns.) The goal at this time is pattern recognition and vocabulary building, not accurate taxonomy. We are just starting to explore the uses of pattern analysis (more in Chapter 6). If the discus- sion leads to questions about the topics shown on the maps and maybe even the causes of the patterns, so much the better. That’s what a geography course is about! 197
- 7. From Teaching Geography, Second Edition, by Phil Gersmehl. Copyright 2008 by The Guilford Press. Permission to photocopy is granted to purchasers of this book for personal use only (see copyright page for details). 198
- 8. Teacher ’s Guide for Transparency 2G Part of geography is about the forces that make a particular place what it is. Many of these forces act from the outside – things such as solar energy, ocean currents, immigration, trade, or political inf luence. Some of the forces that shape a place, however, are from inside. These are consequences of the everyday actions of the people who live there. For example, if people in an area buy food, then we expect to see food stores or markets of some kind there. The size and spacing of stores is a result of the way people typically buy things – how often they shop, how far they are willing to travel, and so forth. Geographers often use an imaginary “flat, featureless plain” to explore processes and their consequences. This is not a fictional place – it is an attempt to see what a real place would be like if it did not have so many complications. A teacher can do the same kind of thing in a class- room. Activity: Write a list like this on the board: new car, rental video, baseball game, loaf of bread, wedding dress, tank of gasoline. Project the Transparency, and ask students where they would expect to find stores selling the items on the list. The question may be phrased in several ways: Would people sell (name a product from the list) in every small town or shopping area, or only in big cities or major malls? How many places sell new cars, as compared to gasoline? How far do people typically seem to be willing to travel in order to rent a video, attend a baseball game, or go to college? How many grocery stores could one soft-drink bottling company serve? How many cancer hospitals would there be, as compared to dentists’ offices? What do all these questions have in common? They tease at the fact that some products and services are needed by a significant portion of the people, and frequently (e.g., gas stations or video rental stores), and others are inherently specialized and needed less often (e.g., cancer clinics or stores that sell wedding dresses). Stores of the first kind tend to be abundant and located close to customers. The second kind tend to occur in only a few places, usually in high- traffic centers where there are enough people to support the providers. Teacher ’s Guide for Transparency 2H Putting the abstract idea embodied in Transparency 2G into the real world is the next step. Activity: Have students look at maps of Colorado in an atlas. What accounts for the north-to-south string of medium-to-large cities, from Fort Collins to Pueblo? (They are all right at the eastern edge of the Rocky Mountains.) How about the smaller string that runs east from Pueblo? (They are along the Arkansas River [pronouced ARKansas here, ArKANsas in Kansas!].) Why is Denver the biggest city? (Perhaps it started earliest? Maybe because it is near the center of the settled area? Maybe its river is the biggest? That is important in a dry region!) Activity: Have students make similar maps of other areas, in the United States or in other coun- tries. What seems to influence the patterns of cities? 199
- 9. From Teaching Geography, Second Edition, by Phil Gersmehl. Copyright 2008 by The Guilford Press. Permission to photocopy is granted to purchasers of this book for personal use only (see copyright page for details). 200
- 10. Teacher ’s Guide for Transparency 2I This Transparency might be useful early in a geography course. Activity: Explain different ways of organizing the subjects covered in a course, and then ask stu- dents whether the textbook is organized topically, regionally, or as a combination of the two. Talking about course organization is way of reminding students of the purpose of learning and doing geography. Here are two related questions: “Why are things like cities and malls located where they are in this country?” and “What criteria should people use in deciding where to locate things like malls, clinics, and school district boundaries?” The first question implies a regional organization of a class; the second points to a more topical emphasis. If you have already discussed climate a little, show this Transparency and ask students to think of a reason why it might be a good idea to start at the equator. The goal is to get students to see that the schedule of topics is a matter of choice, but that there are reasons why someone might choose a particular sequence. This Transparency might be even more useful in discussions with parents, administrators, and colleagues. It was created as a presentation for the 1992 ARGUS Steering Committee meet- ing. That meeting was supposed to address editorial details, but basic questions about textbook organization kept coming up, even though they presumably had been “settled” at earlier meet- ings. The truth of the matter is that the organizational framework of a geography class does not matter nearly as much as the content. Teacher ’s Guide for Transparency 2J After a course framework has been set, we must decide how to fit into the major theories and regions into it. One useful tactic is to make a matrix like this Transparency, adapted from part of the outline of GIGI (Geographical Inquiry into Global Issues). Only a glance is needed to see if there are any major gaps in the coverage of topics and regions. This kind of careful plan- ning is necessary, because, as the Transparency says, “the world is too big to study everything.” Awareness of the vastness of the world does not give us a license to teach whatever we want. Society still expects a geography class to “cover” the major world regions (or at least equip stu- dents to learn about them on their own). The prescription is simple: insist on seeing a matrix of this kind from every textbook pub- lisher. In time (with luck!), they’ll get the hint: teachers expect authors and publishers to show evidence of having thought about the relationships between topics and regions. The alternative is the kind of cheap educational schlock that often floods the market after a major initiative like the No Child Left Behind Act. Teachers deserve better. Activity: Students can learn from the effort of trying to figure out which region would be a good setting in which to discuss a particular topic. An interesting way of introducing (or sum- marizing) this discussion would be to ask “absurd” questions and check student reaction: Would it make sense to discuss farming in a unit on Antarctica? How about a book that “covers” steel production in a chapter on Florida? If students see the humor in such suggestions, that is a good step in the right direction! They are showing a grasp of the idea that the world has some “spatial logic” – that there are reasons why things are where they are. 201