08448380779 Call Girls In Shahdara Women Seeking Men
Transparencies ch09-pp294-299
1. From Teaching Geography, Second Edition, by Phil Gersmehl. Copyright 2008 by The Guilford Press.
Permission to photocopy is granted to purchasers of this book for personal use only (see copyright
page for details).
294
2. Teacher ’s Guide for Transparencies 9A and 9B
The location of a town is both a historical event and a geographical fact. At a specific point in
time, a specific group of people made a decision. That historical fact is often immortalized by a
plaque or statue in a park or other prominent place.
Activity: Describe the origins of a town that is familiar to your students. Then ask whether
there would be a town at that particular location if the originating event (General Dingbat
building a fort, Dewey Cheatham building a trading post, or whatever actually happened) had
not occurred in that place at that time.
In some cases, the answer is no. But in other cases, a town would have developed at that
location anyway, because it had clear advantages: a good site for a fort, perhaps, or a valuable
mineral deposit. The advantages of particular locations fall into two broad categories: site
advantages (favorable conditions in the local area) and situation advantages (good connections
with other areas). Those advantages, however, can change over time, for many reasons.
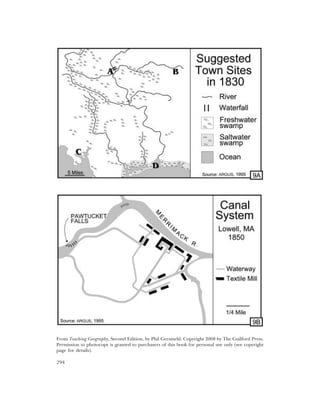
Activity: Tell students to imagine they are on a boat heading for America in 1830. Then project
Transparency 9A and ask students to discuss which lettered location they would choose for a
settlement (this well-known Activity is from the 1968 High School Geography Project, as modi-
fied for the 2003 ARGUS materials).
Site A? It’s not very promising from an agricultural point of view, because it is swampy and
hard to reach. A waterfall, however, would be an important asset in the early 1800s. Peo-
ple at Site A could take water out of the river that comes from the north. They could
build canals to carry it across the site, use it to drive waterwheels in a mill, and then
release it back in the other river.
Site B? It has dry land and fresh water. It may be the best of the four places for farming, but
it is not very accessible from the ocean. Flooding seems to be no threat, and being away
from the swamp would have been a health advantage in a time before antibiotics.
Site C? It has good ocean access, reasonable protection from storms, and perhaps some
cropland. It would probably be a preferred site for a port or fishing village, although
there is no obvious source of fresh water. The jaggedness of the coastline implies a
rocky and rugged site (though this is not certain).
Site D? It is probably the most dangerous from a construction point of view. It is swampy
and also exposed to ocean storms; it may not even have a source of fresh water. It might
be a good fishing area, however.
Aha! This is not a hypothetical situation – sites A through D are all real places. Rotate the
Transparency 90 degrees counterclockwise, so that the east edge becomes the top. The map
now shows the area around Salem and Lowell, Massachusetts. By 1830 the government of the
young United States was well established. The frontier was beyond the Mississippi River, and
farmers on rich land in Ohio and Illinois were sending grain and meat eastward. New England
farmers were leaving their rocky land and moving to cities or to the frontier. Immigrants from
Europe included people who knew how to build factories and work in them. Site A is Lowell,
which soon became one of the most famous milltowns in New England. Thousands of people
worked in mills driven by water that was brought through an elaborate system of canals (as
shown in Transparency 9B). Site B is Derry, a small farming town that has become a minor
industrial center since Interstate 93 was built north from Boston. Site C is Salem, a fishing town
with a distinguished history and a good harbor but little chance for growth. Finally, site D is
now a resort service area for people coming to the beach (during favorable weather!).
295
3. From Teaching Geography, Second Edition, by Phil Gersmehl. Copyright 2008 by The Guilford Press.
Permission to photocopy is granted to purchasers of this book for personal use only (see copyright
page for details).
296
4. Teacher ’s Guide for Transparency 9C
These two maps show the geographic pattern of Arab and Israeli settlements in the hilly region
known as the West Bank (the dry hills on the west side of the Jordan River). Shortly after cap-
turing this area in 1967, the Israeli government began a program of settlement.
The maps on Transparency 9C are examples of simple thematic maps. They clearly show
that the Arab and Israeli settlements have quite different geographic patterns. The older Arab
settlements are “unbalanced.” Their geographic pattern has a pronounced “bias” toward the
west side of the area. The newer Israeli towns are spread quite evenly throughout the entire
area, but at a more detailed scale you might describe many of them as arranged in “strings” (see
the CD unit on Spatial Patterns).
Activity: Have students draw a line that separates the area into a half with only a few dots and a
half that has most of the dots. Then, they can count the dots in each half, add them together to
get a total for the entire area, and calculate percentages in each half. When that is done, the
students can make a generalization about the pattern – is it balanced, obviously biased, or
somewhere in between? You can run this activity with this map or any other dot map with a dis-
tinctive pattern.
For example, one might draw a diagonal line through Charlotte, North Carolina, and count
shopping centers on each side of the line. The conclusion? “about 85 percent of the major
shopping centers are in the southeast half of the urban area.” Similar analysis of a map of Afri-
can-Americans in Charlotte leads to the conclusion that “more than 70 percent of the black
people in Charlotte live in the northwest half of the city.” Together, these two statements could
be cited as proof that different groups within the population of Charlotte do not have equal
access to large shopping centers. Before judging too quickly, however, one should study other
maps, in order to see if factors such as industrial areas, parks, or road patterns would explain
the imbalance.
This is one way in which map pattern analysis can contribute to a public discussion of issues
of fairness and efficiency.
Teacher ’s Guide for Transparency 9D
The reasons for geographic patterns are usually easier to see if a thematic map includes at least
a little bit of reference information. These two maps have exactly the same thematic informa-
tion as the ones on Transparency 9C, but the map maker added a few lines to show roads and a
pale gray shading to show areas of high elevation. With this background, the map reader can
see that the majority of the Arab settlements are at higher elevations. This makes sense,
because the weather gets cooler and rainier as you go higher in the mountains. Both of those
climate trends are advantageous for farming and grazing in a hot and dry region.
The Israeli settlements, by contrast, appear to have been located for defensive or military
reasons rather than to take advantage of favorable climate. Most of them are along major
roads, with a sizeable number in the very dry area close to the border with Jordan.
Activity: Find some interesting data that occur at discrete points – for example, burglaries,
street festivals, car accidents, video rental stores, or schools with winning football records. Have
students make a bare thematic map of the data by putting dots or other point symbols in appro-
priate places on a blank outline map of the area. Then have groups of students add different
kinds of background information to their maps – streets, rivers, political borders, landmarks,
and so on. Finally, ask students to compare the maps and decide what kind of reference infor-
mation helps a map communicate its main message best.
297
5. From Teaching Geography, Second Edition, by Phil Gersmehl. Copyright 2008 by The Guilford Press.
Permission to photocopy is granted to purchasers of this book for personal use only (see copyright
page for details).
298
6. Teacher ’s Guide for Transparencies 9E and 9F
California has a lot of environmental risks to buildings and people.
Some of the risks are due to California’s unique climate. California is located at the north-
ern edge of a subsidence region (see Transparencies 4H and 4I). The zone of sinking air (the
subsidence) moves northward in summer, bringing hot and dry weather to most of the West
Coast from Mexico to Oregon. In winter, the dry subsidence shifts to the south. As a result, San
Francisco has about 6 months of rainy “winter”; Los Angeles about 3; and San Diego has only a
few rainy weeks.
This seasonal shift in the subsidence (and the resulting pattern of dry summers and rainy
winters) brings four distinctive climatic hazards to much of the state of California:
In summer, smog accumulates in the hot and dry air.
In autumn, fires burn in vegetation that has been drying all summer.
In winter, floods and mudflows occur when rain falls on hilly areas that burned in
autumn; the fires often leave bare ground that is especially vulnerable to erosion.
In spring, coastal cliffs collapse when waves beat against shores that have lost their sandy
beaches during winter storms
These seasonal hazards occur in various parts of the state nearly every year. As a result, many
Californians have what some geographers call a “disaster culture.” In a disaster culture, people
expect weather-related hazards every year, and they plan for them. Such preparation is exhaust-
ing, and therefore the people don’t have enough political energy left to plan for longer-term
hazards, such as earthquakes.
Part of their complacency about earthquakes stems from the way the earthquake hazard is
perceived. For example, after an especially damaging earthquake in 1970, the state legislature
passed a tough law, the Alquist-Priolo Special Studies Zones Act. This law requires sellers to
notify buyers if a house for sale is located in an earthquake-prone area. Realtors and homeown-
ers realized that this law would hurt house prices and sales. They therefore lobbied the legisla-
ture to adopt fairly lenient criteria for what constitutes an earthquake-prone area. These politi-
cal pressures are evident on maps. The first map on Transparency 9E shows the location of
known earthquake faults. The middle map shows historic earthquakes. The third map shows a
measure of earthquake risk. Meanwhile, Transparency 9F shows the official map of earthquake-
prone areas. Clearly, you can get a different impression of the earthquake hazard, depending
on the criteria and symbols that were used in making a map. For example, try counting the
major earthquakes (on the dot map) that occurred in places that are not shown as risky on the
map of special studies zones.
This is a major goal of geographic education, to give people enough background to evaluate
the maps and data that they might encounter in the course of their everyday lives as citizens.
Activity: Ask students why real estate brokers might prefer to use Transparency 9F instead of
other maps when they obey the rule about notifying buyers about earthquake risk. Ask about
the financial implications of declaring a house to be in a quake-prone area if it is not really in
danger. “Wouldn’t that unfairly deprive a house owner of profit?” The issue is complex, and
careful comparison of these maps can help students move toward a reasonable middle ground
between over-regulation and laissez-faire. Have students try to draft a fairly worded warning
that could be given to potential homebuyers.
299