Rate of Return for Stocks and BondsFIN571Running he.docx
Ups
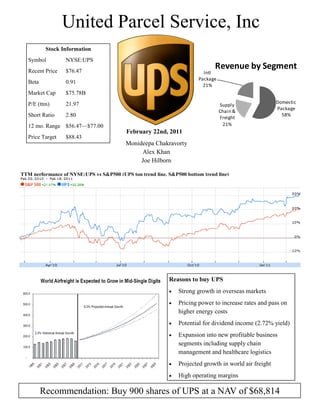
1. United Parcel Service, Inc
Stock Information
Symbol NYSE:UPS
Recent Price $76.47
Revenue by Segment
Intl
Package
Beta 0.91
21%
Market Cap $75.78B
P/E (ttm) 21.97 Domestic
Supply
Package
Chain &
Short Ratio 2.80 Freight
58%
12 mo. Range $56.47—$77.00 21%
February 22nd, 2011
Price Target $88.43
Monideepa Chakravorty
Alex Khan
Joe Hilborn
TTM performance of NYSE:UPS vs S&P500 (UPS top trend line, S&P500 bottom trend line)
Reasons to buy UPS
Strong growth in overseas markets
Pricing power to increase rates and pass on
higher energy costs
Potential for dividend income (2.72% yield)
Expansion into new profitable business
segments including supply chain
management and healthcare logistics
Projected growth in world air freight
High operating margins
Recommendation: Buy 900 shares of UPS at a NAV of $68,814
3. QUALITATIVE ANALYSIS
Investment Thesis
UPS Comparative Advantage
End-to End Global Service Portfolio: UPS is the only competitor in the industry that handles all levels
of service (express, ground, domestic, international, commercial, residential) through its integrated
pickup and delivery network.
Sustainability1: UPS utilizes vehicles that operate on compressed natural gas, liquefied natural gas,
propane, hydrogen fuel cell, electric and hybrid electric power plants.
Customizable Supply Chain Solutions: Has a variety of logistics partnerships with retail, healthcare
and high tech companies like Amazon, Merck and Toshiba.
Tracking-and-Tracing IT Platform: Consistently investing in Information Technology to give
customers better knowledge of tracking their packages. They have recently enhanced tracking to include
more descriptive statuses and special messaging to inform of unexpected delays.
Brand Equity: Built a leading and trusted brand that stands for quality service, reliability and product
innovation. It is synonymous with parcel delivery and logistics. In 2010, UPS was ranking #16 among
the 100 most valuable global brands.2
Financial Strength: UPS has demonstrated high capital efficiency and strong cash flow generation
throughout its history. Despite its vast network, UPS has been able to produce high end returns, with a
six-year average ROE of 28% vs. 10% for FDX. The ability of UPS to consistently grow cash will allow
the company to maintain growth through internal initiatives, make acquisitions, maintain an attractive
dividend, and continue aggressive share buybacks.
Why Now?
Economic Turnaround: UPS volumes trend with the economy, which is rebounding in all regions. In
2009 and 2010, UPS instituted a number of cost savings initiatives across the company which becomes
more evident in 2011when there is margin expansion and more leverage to the bottom line. In fact,
management is forecasting 2011 to exceed the peak earnings level recorded in 2007.
International growth: UPS provides shipping and logistics services all over the world and will benefit
from global trade trends. There is specifically a high potential for growth in Asia. In 2010, the
company increased capacity out of Asia by over 40% to capture demand. In 2011, UPS is adding
additional capacity by expanding their air fleet, adding two 747-400s as well as five additional 747s.
The decision to expand their air fleet shows that UPS expects to see continued market share gains in
2011 across the International and Freight divisions. Many companies are expanding to the use of
airfreight to better manage lean inventories and their supply chain and as a way to minimize
warehousing and other costs associated with maintaining large inventories. This growth in airfreight
would be a significant shift since only 2-3% of the world’s international freight is carried on a plane.
Cash Position: Uses of cash for 2011 include share repurchases of up to $2 billion which is up from the
$800 million in 2010 and capital expenditures of $2.2 billion. Dividends are also a high priority for UPS
and are expected to roughly increase at a rate of 2.53%.3
Long term play: While 2011 may not be the most groundbreaking year, UPS will see gains and
ultimately will see operating margins at the levels they were before the financial crisis. UPS appears to
be in the early stages of operating margin recovery, rebounding from 2009 lows. Currently UPS is
300 bps below its peak consolidated operating margin of 14.4% posted in 2005. Also, DHL‖s exit from
the domestic market give UPS higher pricing power.
1
UPS Fact Sheet
2
Millward Brown Optimor Ranking
3
Q4 Earnings Conference Call
2
4. Risks
Slowdown in global economy: The amount of operating leverage UPS has could reverse any positive
trends. Recent efforts to increase yields could be damaged if there is softer demand as package volumes
and a move to lower yielding services would apply pressure to both margins and yields. UPS may find it
difficult to meaningfully cut costs because of the breadth of its network if there is another downturn.
Economic cyclicality: The transportation industry is subject to cyclical factors, including economic
condition, customer’s business conditions, credit markets, and seasonal patterns, which may adversely
affect customer shipping volumes and industry freight demand.
E.U. Credit Issues: With roughly 25% of UPS’s revenue as international, with more focus on Europe,
E.U credit issues could hinder UPS’s international growth plans.
Rising Labor Costs4: UPS’s model is labor intensive with compensation accounting for 60% of
operating expenses. Also, almost 60% of UPS workers are unionized through Teamsters and the current
contract expires in 2013. The last union-organized strike was in 1998.
Fluctuating Fuel Prices: Higher prices coupled with lower demand would impact the margins
negatively as consumers may look for lower-cost but SLOWER parcel delivery methods.
Company Business Model
UPS
United Parcel Services (UPS) is the premier source for global transportation and logistics solutions. Founded in
1907, UPS has navigated successfully through several recessions and was able to reinvent itself throughout the
century. UPS’s logistics model is built on a hub and spoke network for pickup, delivery and sorting terminals
across the U.S. and the world. The company’s largest domestic hub is in Louisville, KY with major international
hubs in Cologne, Germany and Taipei, Taiwan.
Company Segments (Percentage of 2010 Q4 Revenue)
U.S. Domestic Package (60%) International Package (22%) Supply Chain and Freight (18%)
Ground (70%) Export (74%) Forwarding & Logistics (69%)
Deferred (10%) Cargo (5%) Freight (26%)
Next Day Air (20%) Domestic (21%) Other (5%)
Sources of Revenue
1. U.S. Domestic Package5: This group provides guaranteed air and ground delivery of small packages,
documents, and time definite delivery of heavy weight packages to the entire U.S. In 2010, revenue rose
7% YoY to $8.1 billion.
Margin expansion was
driven by strong growth in
volume, higher yields, and
improved efficiencies.
Average daily volume
inched up 1.7% YoY on
strong growth in Ground and
Next Day Air. As evident in
the graph above, UPS
Ground, a component of
Domestic Packages is
strengthening in Avg Daily
Packages.
4
Lazard Report
5
Q4 Company Presentation
3
5. 2. International Package6: This segment provides air and ground delivery, both domestic and export, to
more than 200 countries and territories. UPS provides guaranteed express delivery to over 50 countries
outside of the U.S. In 2010, revenue and operating profit increased 9.2% and 15% YOY, respectively.
Export average daily volume rose 8.7% year over mainly from more than 30% export growth in China.
Exports from Europe showed solid performance with double-digit growth in Germany. As seen in the
figure below, international exports are growing at a rapid rate.
3. Supply Chain & Freight: The supply chain group provides freight forwarding, logistics, distribution,
customs brokerage, capital, and other services to various industry verticals and customers around the
world. The freight segment provides nationwide regional, inter-region and national Less-than-Truckload
service across the U.S., Canada, Mexico, and other territories. Over the year, revenue climbed 12. 8%.
Profits increased on stronger revenue in UPS Freight as well as the Forwarding and Logistics business.
Strategy
Operating Margins: DHL and the recession challenged UPS’s pricing power in the past three years,
especially in the Domestic market. However DHL exited the market in 2009 and the economy is recovering.
UPS focuses on returning on historic margin levels in the domestic business by cutting costs and creating
greater efficiencies in their network.
Continue International Expansion7: While international revenue is roughly 22% of total revenue we see
potential growth. In 2010, international volume increased 13.6% to a record 2.3 million packages per day
and airlift out of Asia increased 40%. While nearly 50% of international revenue is from Europe, Asia is
UPS’s main focus for growth. At the beginning of fiscal 2010, UPS added a new air hub in China and has
already seen growth in demand. In fact, in UPS is set to buy freighter capacity in 2011 to capture the
airfreight demand internationally.
Increase Success of Customized Supply Chain Solution: UPS’s growth strategy is to increase the number
of customers benefiting from supply chain solutions, particularly in the healthcare, retails, and high tech
sectors, and to increase the amount of small package transportation from these customers. UPS intends to
leverage small package and freight customers through cross-selling the full complement of UPS services.
Healthcare Supply Chain: An aging population is putting pressure on the healthcare systems
around the world. Besides delivery speed, strict temperature control, chain of custody and other
regulations must be used to ensure quality and reliability of every delivery. In the past four years,
UPS’s healthcare facility footprint has doubled, signaling a surge in growth of customer needs.
6
Q4 Company presentation
7
BB&T Report
4
6. Healthcare is a fast-growing sector and UPS’s capabilities match well to the needs of the sector.
Today, UPS has nearly 30 healthcare facilities in Asia, Europe, Canada, and the U.S and are
continuing to invest and expand their footprint in this industry.
SWOT Analysis
Strengths
Sustainability: UPS is the environmental leader in the U.S. package delivery industry. UPS reduces its
carbon footprint through its integrated network, modern airfleet, alternative fuel sources, and extensive
use of rails.
Network: UPS has an established network and continues to make investments to expand its network,
especially in China.
Superior Financial Strength: UPS is known for maintaining higher operating margins than its
competitors. It is highly profitable, averaging a 28% ROE for the past six years.
Dividend Value Strength: Has consistently increased dividends annually with the exception of 2009, at
which it was kept constant. Since 2000, Dividend yield has increased by an average of 2.53% annually.
Brand Equity: UPS is synonymous with parcel delivery. The brown color scheme of its logo and
delivery trucks is iconic to the delivery industry.
Weaknesses
Brand Lag: While UPS’s brown trucks are recognizable, people may not have a complete picture of
UPS’s full range of capabilities.
Unionization: UPS’s labor force is unionized and has therefore impacts UPS’s labor costs. The threat
for strikes could pressure UPS to increase wages.
Debt: UPS has higher debt financial ratios than its competitors. However, with the
Opportunities:
Olympic Games: Selected to manage the transportation and logistical operations of the London
Olympic Games in 20128
Business to Business Growth: Increase in B-to-B growth will help expand operating margins due to
economies of scale.
Asian Market: By increasing customer’s expectation of higher quality products, UPS has the potential
to expand in a fragmented Asian market. They first infiltrate the market by partnering with a key
business player in the market with a focus on exports/imports. After this, they will pursue acquisitions
and more of a domestic play.
Logistics Solutions Business: UPS leverages its network by providing logistics solutions for retail and
manufacturing companies. This growing business had been expanding double digits pre-recession and in
2009 these revenues decreased by 20%. However, this has recently reversed due to their ―We Love
Logistics‖ campaign.
Global Healthcare Distribution Network: New facilities are being added in the U.S., Asia, Europe,
and Canada to accommodate rapid growth in healthcare.
Yield Growth: While DHL, who had priced down the market, left the U.S. parcel market more than two
years ago, we believe that full pricing power was partially delayed since shipper contracts are usually 1-3
years. Therefore, UPS could be increasing profit margin by having more price control.
United States Postal Service Volume Decline: Over the last 10 years, the USPS has steadily lost share
to UPS and FedEx. Their continued decline could yield modest volume gains for UPS
8
2009 UPS Annual Report
5
7. Threats9
Rising Fuel Prices: UPS charges fuel surcharges to their domestic and international package and LTL
services as their primary means of reducing the risk of adverse fuel price changes. They also periodically
enter into option contracts on energy commodity products to manage price risks associated with
forecasted transactions involving refined fuels like jet fuel.
Challenging Weather Conditions: Bad weather can hurt volume and impact efficiency in delivery of
goods. In addition, bad weather can impact retail sales and other groups UPS partners with which may
hurt revenues. While UPS cannot control the weather, they have improved their tracking platform for
customers by providing more information and an updated delivery time to customers in the event of
unexpected delays.
Currency Headwinds: Currency translation headwind within their international business could impact
cost inflation. However, UPS has delivered strong cost side and margin performance in 2010 that we
believe makes them competitive with others in the industry. With over a century of experience, we
believe UPS has expertise in foreign currency hedging activities using derivate financial instruments like
currency forward contracts and currency options.
Pension Fund Liability: In 2007, UPS added $6.1 billion in debt to restructure pension program. If the
fund is not producing adequate returns, UPS is obligated to pay from their operating income to meet
required distributions.
Recent Alliances/Partnership
London 2012 Olympic Games: UPS will serve as the Official Logistics and Express Delivery Supporter of the
2012 Olympic Games. UPS will be responsible for the pick-up and delivery of everything from documents to
heavy freight as well as the operation and management of the Games Logistics and Command Centre, where all
the materials associated with the Games will be inventoried, warehoused and processed. In addition, UPS will
provide logistics planning services to ensure optimal efficiency in the Olympic supply chain and customs to get
shipments cleared through customs quickly and efficiently.
UPS Trackside: UPS is the official express delivery company sponsor for NASCAR and will deliver to vendors,
NASCAR family members, and to NASCAR equipment. This partnership is from middle of February to
November 2011.
Red Cross: UPS will take part in a charitable initiative to increase Logistics Emergency Teams for American
Red Cross chapters. Through this effort, UPS will provide logistics expertise, transportation and warehousing to
local Red Cross Disaster Servicers Coordinators in the event of a large, scale emergency.
Recent News
MANAGEMENT GUIDANCE
On February 2nd, UPS announced almost a 44% improvement in earnings over the prior year period. Global
revenue grew 8.4%, increasing adjusted operating profit by almost 40%.
Management will also place high priority on service and technology enhancements for 2011. This includes
higher visibility to customers by providing more tracking information details like a status bar and special
messages for unforeseen events.
9
Q3 2010 Report
6
8. In a recent earnings call, management expected to increase share repurchase substantially from $800 million in
2010 to $2 billion in 2011.
GLOBAL EXPANSION
UPS Express Freight goes to Israel and Slovakia. The expansion of service lets it serve expanding hubs for
high-tech, industrial and automotive companies. Israel is a key destination in the high tech sector, which major
players in the industry maintain operation in the county. Slovakia has developed as a key center for automotive
and industrial manufacturing, representing manufacturing operations of some of the world’s largest auto
makers.10
UPS Capital, the financial services arm of UPS has plans to expand its Latin American presence by opening
new offices in Bogota, Colombia and Lima, Peru to help facilitate global trade. This would impact the ―Other‖
segment of Supply Chain & Freight, which has the most growth potential. (helps give loans to qualified
international businesses)
In addition, UPS has also bought 7 new planes, a sign of growing demand and a need to increase their capacity.
FRANCHISE EXPANSION
The UPS Store, a system of independently owned retail shops for shipping, print and other business services, has
lined up nearly $23 million in loans for franchises and expects new credit access to spur 40% more store
openings this year than in 2010. They have set an aggressive goal to sell 120 new franchises in the U.S. for
2011. More stores will be added in ―nontraditional‖ locations such as in hotels or college campuses. An increase
in franchises would provide growth for the ―Other‖ segment component of Supply Chain & Freight. As of last
quarter, this segment contributed around 17% to quarter revenues.
HEALTHCARE SECTOR GROWTH11
UPS is seeing increased demand from healthcare manufacturers wanting more agile supply chains. In January,
UPS announced a significant expansion of global healthcare distribution facility networks to accommodate
continued rapid growth in its healthcare business. The new facilities will be located in Kentucky, Singapore,
Venlo (the Netherlands), Burlington (Canada). All of these facilities are strategically located near international
and UPS air hubs.
10
www.bizjournals.com
11
UPS Press Release: January 4, 2011
7
9. “WE ♥ LOGISTICS” CAMPAIGN
Since September 2010, UPS has started a new advertising campaign to demonstrate how it has vaulted past
competitors to offer the broadest range of logistics services in the industry and will focus on the theme ―We Love
Logistics‖ to reflect UPS’s passion for delivering transportation and supply chain solution that can help both
large and small businesses compete better. This is UPS’s first campaign that advertises for all of their global
services. The purpose for this is to associate a new definition to logistics and to show the complex system and
network involved to make it successful. In Fall 2010, this campaign debuted in the U.S., China, the U.K., and
Mexico. It will debut in other markets around the world in the beginning of 2011.
Surprise Analysis12
In the past six quarters, UPS has beat market EPS expectations. In the four most recent quarters UPS has beaten
EPS estimates by more three cents or more—leading to more than a 2.6% surprise. Surprise analysis is
important, because typically when there are positive EPS surprises, the share price will increase. Also, a positive
surprise may imply that the market is undervaluing the stock and that the company is performing and exceeding
expectations.
12
Reuters
8
10. Z-Score Analysis13
One of UPS’s weaknesses is its use of debt which has steadily risen over time. Therefore, based on this long term
debt trend, we decided to perform a Z-Score Analysis to assess the probability of UPS going bankrupt in the next
two years.
Altman’s equation is:
Z = 0.012T1 + 0.014T2 + 0.033T3 + 0.006T4 + 0.999T5
Where,
T1 = Working Capital / Total Assets
T2 = Retained Earnings / Total Assets
T3 = EBIT/ Total Assets Variable Inputs
T4 = Market Value of Equity / Book Value of Total 2009 2010 Q3
Liabilities Working Capital 3036 3955
T5 = Sales/ Total Assets Retained Earnings 12745 13603
EBIT 3811 5325*
Sales 45297 48501*
MV of Equity 57025.78 66089.79
Zones of Discrimination:
Total Assets 31883 32907
Z > 2.99 -―Safe‖ Zones
1.8 < Z < 2.99 -―Grey‖ Zones BV of Liabilities 24187 24381
Z < 1.80 -―Distress‖ Zones
Using this equation, we calculated a Z-Score for year end 2009 and the year end 2010 Q3.
2009: 1.2(.095) + 1.4(0.4) + 3.3 (0.12) + 0.6(2.358) + 0.999(1.421) = 3.902
2010 Q3: 1.2(0.12) +1.4(0.413) + 3.3 (0.162) + 0.6 (2.711) + 0.999(1.474) = 4.356
While debt rises, UPS bolsters even further into the ―safe zone‖ and decreases the probability of UPS going
bankrupt. A large part of its safety status is driven by EBIT and Sales and its overall operational improvements
in operating margin, network efficiency, and cost reductions. Its profitability strength allows UPS to increase its
use of debt. Therefore, we do not see UPS’s use of debt as a weakness.
13
Edward Altman, UPS 2009 10k, UPS 10Q
* 2009 Q4 was used to adjust for EBIT and Sales figures in 2010 Q3
9
11. Industry Analysis 14
UPS is in the air delivery and freight services industry. This is a broad industry and is made up of
logistics companies such as UPS, state-owned postal systems, the cargo divisions of airlines, and other
logistics and freight companies.
Industry Trends
The industry has and will continue to experience growth as firms turn to outsource their
operations to third party logistics companies.
Additional need for freight will come as the demand for shipping consumer goods grows with a
shift towards e-commerce and online shopping.
Some companies, such as UPS, have grown and transformed their business to encompass a
wider view of the logistics process to create a competitive advantage and boost revenues. For
example, the two largest players in the industry, UPS and Fedex, have both created ―drop-ship‖
solutions by integrating their operations with warehouses of online retailers, such as
Amazon.com15.
Managing the entire logistics process allows customers to focus on core business and the
industry to achieve greater economies of scale
There is a growing market for healthcare industry logistic solutions. UPS has 3 million sq ft of
warehouse space that is compliant with health regulations and standards. This includes
managing new orders and accounts receivable.16
Market Players
In the worldwide shipping market, Fedex and UPS dominate business, accounting for more than
80% of revenues
In local metropolitan markets, the industry is much more fragmented due to small-volume and
limited-footprint couriers.
This difference between geographic markets exists because of the barriers to entry: larger
companies require more capital expenditure for investments such as aircraft, vehicles, and
warehouses while local companies have less fixed capital needs and primarily increase labor as
their business increases.
Alliances and Competition
The delivery portion of the shipping business faces both competition and alliance from
the postal system.
In the United States, USPS has increasingly become a competitor to shipping companies
business as they have also moved away from exclusively letter delivery and expanded offerings
in package and freight shipments.
USPS has forged alliances with its competitors to tender packages to Fedex for some delivery
routes including international shipments.
14
http://trinity.firstresearch-learn.com/industry.aspx?chapter=0&pid=408
15
Amazon.com 2009 Annual Report
16
http://www.ups-scs.com/solutions/healthcare.html
10
12. Porter’s Five Forces
New Entrants – Low
UPS has established brand equity
Long term contracts with corporate customers
Capital intensive industry that involves aircraft, vehicles, software, and warehouses
Substitutes – Medium
Some customers with non-time sensitive logistics needs can trade down to using slower and less
expensive delivery options, such as USPS
Firms may create their own in-house supply chain and logistics solutions rather than
outsourcing the operations to a company such as UPS
Threat to letter delivery business as a result of a movement towards electronic documents
Supplier Power – Low
UPS does not rely on specific suppliers to operate their business outside of major capital
expenditures
Buyer Power - Medium
Smaller customers have less ability to negotiate prices because prices are fixed
Larger companies using full logistics solutions have more pricing power due to the ability to
negotiate long term contracts
Competitive Rivalry - High
Closest competitor, Fedex, has similar offerings in freight and logistics business
UPS focuses on growth overseas and expansion in supply chain business
Comparable prices across industry
11
13. Macroeconomic Analysis
Economic Outlook for 201117,18
The January report from the Bureau of Labor Statistics reported that the unemployment rate fell
to 9.0%. Some of this decline is related to people leaving the job market and stopping their
search for employment rather than an increase in the employment rate.
Overall employment in most industries remained fairly constant
Employment in retail trade, healthcare, and manufacturing segments experienced the largest
amount of growth.
Growth in manufacturing jobs is favorable for economic growth, as indices such as PMI are
leading indicators of economic growth.
Rapid increase in many commodity prices forecasted, including that of energy prices
The United States had positive GDP growth in the second half of 2009 and all of 201019
The Federal Reserve raised their projection of GDP growth in 2011 to 3.9%20
UPS in the Economy
Manufacturing growth in not only favorable for the economy as a whole, but UPS will directly
benefit and larger quantities of manufactured goods enter their logistics chain to reach their
destinations
Rising energy costs have the potential to impact profits in the company’s delivery business
UPS is able to stabilize cash flows related to variable energy costs by hedging using futures
contracts as well as an additional fuel surcharge to pass on higher costs to their customers
Expansion in healthcare jobs is positive and coincides with UPS’ goals to increase their Global
Healthcare Network, a new area of profit for the company
17
http://www.ism.ws/ismreport/mfgrob.cfm
18
http://www.bls.gov/news.release/pdf/empsit.pdf
19
http://www.bea.gov/national/index.htm#gdp
20
http://www.federalreserve.gov/monetarypolicy/files/fomcminutes20110126.pdf
12
14. Competitors
FedEx Corporation21
(NYSE:FDX) operates several
business segments that compete
directly with UPS including
Fedex Express, FedEx Services,
and FedEx Ground. The
company provides various solutions for transportation and delivery, logistics, e-commerce, and
business services. The company provides various package delivery and outsourced business services.
FedEx SmartPost is a subsidiary of FedEx ground that contracts with the United States Postal System
transport deliveries across regions.
CH Robinson
Worldwide, Inc22
(NASDAQ:CHRW) is a third
party logistics provider that
contracts with transportation
companies around the world to
arrange logistics services for their customers. CHRW does not own any of the transportation systems
to move freight, but instead mixes and matches various offerings from their contractors with customer
needs to create what they call ―multimodal transportation services.‖ They also have a business services
unit that provides supply-chain analysis and information reporting.
Expeditors International
of Washington Inc23
(NASDAQ: EXPD) provides
logistics services. Their two
main sources of revenue come
from air freight and ocean
freight services. In both operations, they find the optimal carrier for the cargo based on the customer’s
needs, including time schedules, cost, and destinations. EXPD also operates a customs brokerage
service for goods moving across borders by air, sea, rail, and truck. Operations of their customs
business, which account for 41% of the company’s revenue, include arranging inspection, paying
import taxes on behalf of the client, and warehousing and product distribution.
21
http://www.reuters.com/finance/stocks/companyProfile?rpc=66&symbol=FDX
22
http://www.reuters.com/finance/stocks/companyProfile?rpc=66&symbol=CHRW.O
23
http://www.reuters.com/finance/stocks/companyProfile?rpc=66&symbol=EXPD.O
13
15. Quantitative Analysis
Financial Ratios24
Liquidity: Good
UPS Liquidity Trend
2005 2006 2007 2008 2009 2010
Current 1.65 1.40 1.20 1.13 1.49 1.95
Ratio
Quick Ratio 1.65 1.40 1.20 1.13 1.49 1.95
Cash Ratio 0.47 0.30 0.26 0.13 0.34 0.68
Peers Companies Recent Fiscal Year Comparisons
2010 2009 2009 Peer S&P 2010
FDX CHRW EXPD Average Average UPS
Current 1.57 1.79 2.52 1.96 .82 1.95
Ratio
Quick Ratio 1.57 1.79 2.52 1.96 .52 1.95
Cash Ratio 0.42 0.46 1.31 0.73 0.68
Liquidity Rankings
Current Quick Ratio Cash Ratio Total
Ratio
UPS 2nd 2nd 2nd 2nd
FDX 4th 4th 4th 4th
CHRW 3rd 3rd 3rd 3rd
EXPD 1st 1st 1st 1st
S&P 500 5th 5th - 5th
Since the global recession, UPS has seen great improvement in its liquidity ratios. In 2010, liquidity ratios raised
above its six year highs in 2005. UPS accomplished this despite spending more on its main U.S. hub expansion in
the first half of 2010 and in opening a new intra-Asia hub in Shenzhen, China. UPS achieved this in large part due
to the improving economy which helped volume and revenue trends, as well as the cost containment initiatives
and efficiencies implemented over the past few quarters. Also, the new business improvements added to greater
efficiencies in their network and reduced time in transit for shipments in the region. The quick and current ratios
are the same for UPS because they do not have any inventory; they are a services company.
24
Yahoo Finance, Reuters, Annual Reports
14
16. Asset Management: Good
UPS Asset Management Trend
2005 2006 2007 2008 2009 2010
Day Sales in - - - - - -
Inventory
Average 52.029 47.094 47.467 42.142 44.951 -
Collection
Period
Fixed Asset 2.79 2.83 2.81 2.82 2.52 2.85
Turnover
Total Asset 1.22 1.43 1.27 1.62 1.42 1.47
Turnover
Peer Companies Recent Fiscal Year Comparisons
2010 2009 2009 Peer S&P 2010
FDX CHRW EXPD Average Average UPS
Day Sales in - - - - - -
Inventory
Average 43.147 42.073 71.289 52.17 47.46 44.95125*
Collection
Period
Fixed Asset 2.41 64.38 8.26 25.02 - 2.85
Turnover
Total Asset 1.39 4.13 1.76 2.43 .46 1.47
Turnover
Asset Mgmt Rankings
ACP FATO TATO Total
UPS 3rd 3rd 3rd 2nd
FDX 2nd 4th 4th 4th
CHRW 1st 1st 1st 1st
EXPD 5th 2nd 2nd 3rd
S&P 500 4th - 5th 5th
Fixed Asset Turnover has maintained above 2.5 in the past six years and reached record high levels in 2010.
While 2010 FATO is a little bit above the standard for the past 6 years, it shows significant improvement from
2009 levels. This is especially important as it is evident that UPS is improving its use of fixed asset investments
from recent expansion asset additions which were supposed to improve business efficiencies. UPS’s unique
business model – all packages go through one integrated network—creates efficient use of assets and has
allowed UPS to maintain high operating margins. While UPS has maintained decent TATO and superior TATO
compared to the S&P average, we believe there is still much room for improvement. As the economy improves,
UPS will have better generation of revenues and will increase its operating margins to pre-recession levels.
*
2009 ACP figures are used for UPS
15
17. Debt Management: Below Average
UPS Debt Management Trend
2005 2006 2007 2008 2009 2010
Debt Ratio .11 .12 .28 .31 .30 .31
Debt/Equity .24 .27 .90 1.46 1.25 1.30
Ratio
Times 35.32 30.85 1.75 11.35 7.56 15.6
Interest Ratio
Average 17.843 16.2 13.333 14.485 15.321 -
Payment
Period
Peer Companies Recent Fiscal Year Comparisons
2010 2009 2009 Peer S&P 2010
FDX CHRW EXPD Average Average UPS
Debt Ratio .07 .01 - .04 .60 .31
Debt/Equity .12 .01 - .07 1.5 1.3
Ratio
Times 23.97 3106 810.61 1313.58 16.28 15.6
Interest Ratio
Average 16.738 27.249 53.086 32.357 - 15.321*26
Payment
Period
Debt Mgmt Rankings
Debt D/E TIER APP Total
UPS 3rd 3rd 4th 4th 4th
FDX 2nd 2nd 3rd 3rd 3rd
CHRW 1st 1st 1st 2nd 1st
EXPD - - 2nd 1st 2nd
S&P 500 4th 4th 5th - 5th
UPS fairs poorly compared to its competitors and the market. Debt use has been slowly rising over time in
comparison to assets and equity and at levels worse than most of its competitors. There was slight improvement
from 2008 to 2009, but we believe this is correlated to conservative spending during the economic recession.
However, while debt levels rise, UPS is able to cover its interest payments by almost 16 times, almost double the
amount from 2009 and a vast improvement from the past three years. By debt levels increasing slightly in 2010,
we take this as a sign of advancement and UPS’s increased priority for investment and expansion.
*
2009 APP is used for UPS comparisons
16
18. Profitability: Excellent
UPS Profitability Trend
2005 2006 2007 2008 2009 2010
Operating 14.43% 13.95% 1.16% 10.45% 8.39% 11.86%
Margin
Net Profit 9.09% 8.84% 0.77% 5.83% 4.75% 7.04%
Margin
Return on 11.07% 12.65% 0.98% 9.42% 6.75% 10.36
Assets
Return on 22.92% 27.14% 3.14% 44.29% 28.20% 43.15%
Equity
Peer Companies Recent Fiscal Year Comparisons
2010 2009 2009 Peer S&P 2010
FDX CHRW EXPD Average Average UPS
Operating 5.75% 7.75% 9.41% 7.64% - 11.86%
Profit Margin
Net Profit 3.41% 4.76% 5.87% 4.68% 10.9% 7.04%
Margin
Return on 4.75% 19.67% 10.34% 11.59% 5.1% 10.36%
Assets
Return on 8.57% 33.41% 15.47% 18.94% 14.2% 43.15%
Equity
Profitability Rankings
OPM NPM ROA ROE Total
UPS 1st 2nd 2nd 1st 1st
FDX 4th 5th 5th 5th 5th
CHRW 3rd 4th 1st 2nd 2nd
EXPD 2nd 3rd 3rd 3rd 3rd
S&P 500 - 1st 4th 4th 4th
Profitability is definitely one of UPS’s strengths. In 2010, margins recovered from recessionary price cutting.
UPS’s operating margin power shows superior in comparison to its peers, while it’s ROA and ROE far exceed
S&P averages. While there has been margin improvement, they are still below historical six year highs for UPS,
showing that there is still room for improvement. As the economy recovers, we see UPS increasing margins as it
receives more volume and more pricing power.
17
19. Extended DuPont: Excellent
UPS DuPont Trend
2005 2006 2007 2008 2009 2010
Net Profit 3.41% 4.76% 5.87% 4.68% 10.9% 7.04%
Margin
Total Asset 1.22 1.43 1.27 1.62 1.42 1.47
Turnover
Equity 2.07 2.15 3.20 4.70 4.18 4.17
Multiplier
Return on 22.92% 27.14% 3.14% 44.29% 28.20% 43.15%
Equity
Peer Companies Recent Fiscal Year Comparisons
2010 2009 2009 Peer S&P 2010
FDX CHRW EXPD Average Average UPS
NPM 3.41% 4.76% 5.87% 4.68% 10.9% 7.04%
TATO 1.39 4.13 1.76 2.43 .46 1.47
EM 1.80 1.70 1.50 1.67 2.5 4.17
ROE 8.57% 33.41% 15.47% 18.94% 14.2% 43.15%
Extended DuPont Rankings
NPM TATO EM ROE Total
UPS 2nd 3rd 1st 1st 1st
FDX 5th 4th 3rd 5th 5th
CHRW 4th 1st 4th 2nd 2nd
EXPD 3rd 2nd 5th 3rd 4th
S&P 500 1st 5th 2nd 4th 3rd
While UPS’s leverage may be a concern in comparison to its peers, its profitability and ROE to investors is far
superior. From this model it is evident that ROE is most impacted by the fluctuations in Net Profit Margin and
the Equity Multiplier. As the economy picks up in 2011 and 2012, we expect profit margins to increase as UPS
will have higher pricing capability and see the impact/benefits of cutting costs and improving efficiencies during
the recession.
ROE
50.00%
44.29% 43.15%
40.00%
30.00% 28.20%
27.14%
20.00% 22.92%
ROE
10.00%
3.14%
0.00%
2005 2006 2007 2008 2009 2010 18
21. Dividend Growth Model
UPS has consistently paid a very strong dividend relative to its share price meaning that not only would
the SMF portfolio benefit from share price appreciation, but also dividend income. Additionally, the
growth rate of the quarterly dividends has been consistent and has increased by over 2.5% annually
since 2000. UPS’ significant dividend amount and high yield percentage help to ensure the price of the
stock remains relatively high, as a decrease in price would cause the yield to go up, which under
normal circumstances, would cause the stock price to correct itself.
Using the dividend growth pricing model and assuming a 6.0% required rate of return for the stock and
continued dividend growth rate of 2.53% annually, the value of UPS is $75.22. The closeness between
the market price and dividend growth model valuation is indicative that this stock is used for dividend
income, meaning it is likely that the robust dividend acts as a price support.
20
22. Pro Forma Income Statement
United Parcels Service, Inc.
Consolidated Income Statement
(dollars in millions, except per share amounts)
2009 2010 2011 Estimates
Growth % Pessimistic Most Likely Optimistic
U.S. Domestic Package Growth 1% 3% 6%
International Package Growth 7% 10% 14%
Supply Chain & Freight Growth 5% 8% 13%
Total Revenue Growth 3.05% 5.29% 8.56%
Revenue:
U.S. Domestic Package $ 28,158 $ 29,742 $ 30,039 $ 30,634 $ 31,527
International Package 9,699 11,133 11,912 12,246 12,692
Supply Chain & Freight 7,440 8,670 9,104 9,364 9,797
Total Revenue 45,297 49,545 51,055 52,244 54,015
Operating expenses:
Compensation and benefits 25,640 26,324 26,549 27,167 28,088
Repairs and maintenance 1,075 1,131 1,174 1,202 1,242
Depreciation and amortization 1,747 1,792 1,838 1,881 1,945
Purchased transportation 5,379 6,640 6,076 6,217 6,428
Fuel 2,365 2,972 3,063 3,135 3,241
Other Occupancy 985 939 1,021 1,045 1,080
Other Expenses 4,305 3,873 4,748 4,859 5,023
Total Other Expenses 15,856 17,347 17,920 18,338 18,959
Total operating expenses 41,496 43,671 44,469 45,505 47,047
Operating profit:
U.S. Domestic Package 2,138 3,373 3,787 3,875 4,007
International Package 1,367 1,904 2,140 2,190 2,265
Supply Chain & Freight 296 597 659 674 697
Total operating profit 3,801 5,874 6,586 6,739 6,968
Other income (expense):
Investment income (loss) 10 3 1 1 1
Interest expense (445) (354) (434) (444) (459)
Total other income (expense) (435) (351) (433) (443) (458)
Income before income taxes 3,366 5,523 6,153 6,296 6,510
Income tax expense 1,214 2,035 2,154 2,204 2,278
Net income $ 2,152 $ 3,488 $ 4,000 $ 4,093 $ 4,231
Per share amounts
Basic earnings per share $ 2.16 $ 3.51 $ 4.02 $ 4.12 $ 4.26
Diluted earnings per share $ 2.14 $ 3.48 $ 3.99 $ 4.08 $ 4.22
21
23. 2011 Pro Forma Income Statement Assumptions
Revenues: In order to forecast revenue growth for 2011, we broke UPS’s revenues down into the three main
operating segments, U.S. Domestic Package, International Package, and Supply Chain and Freight, and
forecasted the growth of each segment separately.
U.S. Domestic Package: For the U.S. Domestic Package segment, we made a growth matrix from the revenues
spanning back to 2005. The growth matrix is displayed in the Appendix, page 31. Based off of the growth
matrix, we assigned growth rates of 1%, 3%, and 5% to our pessimistic, most likely, and optimistic cases
respectively. The pessimistic growth rate of 1% is slightly higher than the median growth rate of .78%. Most
likely is set at 3% to mimic the U.S. economic growth. The optimistic growth rate of 5% is set slightly below the
growth rate from 2009 to 2010, which was 5.63%.
International Package: For the International Package segment, we made a growth matrix from the revenues
spanning back to 2005. The growth matrix is displayed in the Appendix, page 31. Based off of the growth
matrix, we assigned growth rates of 7%, 10%, and 14% to our pessimistic, most likely, and optimistic cases
respectively. The pessimistic growth rate of 7% is set slightly higher than the 6.89% median growth rate. Most
likely is set at 10% which is slightly lower than the growth rate from the years 2005 to 2008, which we believe
more accurately represent UPS’s growth opportunities. The optimistic growth rate of 14% is set slightly below
the 14.79% growth rate from 2009 to 2010.
Supply Chain and Freight: For the Supply Chain and Freight segment, we made a growth matrix from the
revenues spanning back to 2005. The growth matrix is displayed in the Appendix, page 31. Based off of the
growth matrix, we assigned growth rates of 5%, 8%, and 13% to our pessimistic, most likely, and optimistic
cases respectively. The pessimistic growth rate was set at 5% which is slightly lower than the median of 5.55%.
Most likely was set at 8% which is half of the growth rate from 2009 to 2010. Optimistic is once again set below
the growth rate from 2009 to 2010, which was 16.53%.
Total Growth Rate: The total revenue growth rates are 3.05%, 5.29%, and 8.56% for our pessimistic, most likely,
and optimistic cases respectively.
Total Operating Expenses: Total operating expenses were set at 89.1% of revenue. Of the 89.1%, 52% is
attributed to Compensation and benefits. The other 35.1% is attributed to other expenses. Of the other expenses,
purchased transportation is the largest taking up 11.9% of the allotted 89.1% of revenue.
Total Operating Profits: Total operating profits are broken down as follows: U.S. Domestic Package is 57.5%
of total operating Profits, International Package is 32.5% of total profits, and Supply Chain and Freight is 10% of
total profits.
Income Tax Expense: Income Tax Expense was set at 35% of EBIT based on Valueline estimates.
Shares Outstanding: Shares outstanding was set at the current amount of shares outstanding to be conservative
because there is no guarantee that UPS will buy back shares.
P/E Valuation
Historical P/E Multiples
2002 2003 2004 2005 2006 2007 2008 2009 Average
UPS 28.5 25.9 26.1 21.1 19.8 17.8 18.4 22.6 22.5
FDX 19.7 19.3 19.6 18.5 16.3 16.5 17 17.5 18.1
CHRW 27.4 27 28.1 26 29.2 27.2 25.9 24.6 26.9
EXPD 28.6 31.7 32.9 32 41.5 36.9 28.7 28.7 32.6
Averge 26.05 25.975 26.675 24.4 26.7 24.6 22.5 23.35 25.0
22
24. Historic P/E Multiple: Above is a table with the historic P/E multiples for UPS and its peer competitors. UPS
has had a higher P/E multiple than FDX, its main competitor, for the last 8 years. However, it has had lower P/E
multiples than the other two peers, CHRW and EXPD. From 2002 to 2007 the P/E multiple for UPS has
declined, but has started in increase since 2008. We believe this trend will continue and the P/E Multiple will
continue to increase slightly in the years to come.
Historical P/E Multiples
45
40
35
30
25
20
15
10
5
0
2002 2003 2004 2005 2006 2007 2008 2009
UPS FDX CHRW EXPD Averge
Above is a graph of UPS and its competitors’ P/E multiples dating back to 2002.
P/E Valuation
Pessimistic Most Likely Optimistic
EPS $ 3.99 $ 4.08 $ 4.22
P/E Multiple 18.5 21.5 23.5
Price Per Share $ 73.77 $ 87.73 $ 99.14
Probability 0.15 0.7 0.15
Weighted Average Price $ 87.35
Current Price $ 76.47
Margin of Safety 14%
P/E Valuation: P/E multiples were set at 18, 21.5, and 23.5 for our pessimistic, most likely, and optimistic
scenarios respectively. The pessimistic multiple was set at 18.5 which is about equal to the P/E multiple in 2008.
We put a multiple of 21.5 as the most likely which is below the 2009 multiple and also below the average. For
optimistic we placed the multiple at 23.5 based on UPS having higher multiples prior to 2005.
23
25. P/S Valuation
Historical P/S Multiples
2001 2002 2003 2004 2005 2006 2007 2008 2009 2010 Average
UPS 2.65 3.1 2.75 2.5 2 1.65 1.6 1.5 1.4 1.4 2.1
Historic P/S Multiples:We could not locate P/S multiples for the UPS’s peer competitors. Above is a
table of historic P/S multiples for UPS since 2001.
UPS
3.5
3 3.1
2.65 2.75
2.5 2.5
2 2
1.65 1.6
1.5 1.5 1.4 1.4 UPS
1
0.5
0
2001 2002 2003 2004 2005 2006 2007 2008 2009 2010
Above is a graph of the P/S multiples for UPS. There has been a trend down in the last eight years, but
the trend seems to be leveling out.
P/S Valuation 2011
Pessimistic Most Likely Optimistic
Revenue $ 51,055 $ 52,244 $ 54,015
Shares Outstanding 1003 1003 1003
Sales Per Share $ 50.90 $ 52.09 $ 53.85
P/S Multiple 1.3 1.6 2.2
Price Per Share $ 66.17 $ 83.34 $ 118.48
Probability 0.15 0.7 0.15
Weighted Average $ 86.04
Current Price $ 76.47
Margin of Safety 13%
P/S Valuation: For our P/S valuation, we divided our 2011 pro forma revenues for each scenario by
the number of current shares outstanding (Both revenue and Shares outstanding are in millions). We
then multiplied the sales per share by a corresponding P/S multiple. For pessimistic we placed the
multiple at 1.3 if the trend continues downward. Most likely we placed a 1.6 multiple which would be a
slight increase from the 2010 multiple. For optimistic, we placed the multiple at 2.2, which is slightly
above the average multiple over the last ten years.
24
26. EV/EBITDA Valuation
Historical EV/EBITDA Multiples
2002 2003 2004 2005 2006 2007 2008 2009 2010 Average
UPS 13 14.5 14 12.5 10 9.5 26 14 11 13.8
Historic EV/EBITDA Multiples: Above are historic EV/EBITDA multiples for UPS. We were unable
to find EV/EBITDA multiples for their peer competitors.
Historical EV/EBITDA Multiples
30
25 26
20
15 14.5
13 14 14
12.5 UPS
10 10 11
9.5
5
0
2002 2003 2004 2005 2006 2007 2008 2009 2010
Above is a graph of the historical EV/EBITDA multiples from 2002 to 2010. There was a significant
spike in the EV/EBITDA multiple in 2008. This can be attributed to lag of the low EBITDA of 2007.
EV / EBITDA Valuation
Pessimistic Most Likely Optimistic
EBIT 6,586,000,000 6,739,000,000 6,968,000,000
D&A 1,838,000,000 1,881,000,000 1,945,000,000
EBITDA 8,424,000,000 8,620,000,000 8,913,000,000
EV / EBITDA Multiple 9.00 11.00 13.00
Enterprise Value 75,816,000,000 94,820,000,000 115,869,000,000
Cash 4,081,000,000 4,081,000,000 4,081,000,000
Debt 10,491,000,000 10,491,000,000 10,491,000,000
Market Cap 69,406,000,000 88,410,000,000 109,459,000,000
Shares Outstanding 1,003,000,000 1,003,000,000 1,003,000,000
Price Per Share $ 73.40 $ 88.15 $ 109.13
Probability 0.15 0.7 0.15
Weighted Average Price $ 89.08
Current Price $ 76.47
Margin of Safety 16.5%
25
27. EV/EBITDA Valuation: For our EV/EBITDA, we started with our projected operating profit from each
scenario from our 2011 pro forma income statement. We then added the depreciation and amortization to arrive
at the EBITDA value. The depreciation was combined in UPS income statement with amortization under the
Other Expenses category. We then multiplied the EBITDA by the EV/EBITDA multiple to arrive at the
enterprise value. EV/EBITDA multiples were 9, 11, and 13 for our pessimistic, most likely, and optimistic
respectively. Our pessimistic multiple of 9.5 is the lowest multiple for UPS in the last 9 year. Our most likely
was set at 11 which was the EV/EBITDA multiple for 2010. Our optimistic was set at 13 which is slightly below
the average multiple over the past eight years. For the price per share, we added cash back to the enterprise
value. We then divided that number by the number of shares outstanding to arrive at out price per share.
DCF Valuation
Free Cash Flow Calculation
Actual Estimated
2008 2009 2010 2011 2012 2013 2014 2015
Revenue Growth -12.02% 9.38% 5.45% 5.29% 5.29% 5.29% 5.29%
Revenue 51,486 45,297 49,545 52,244 55,008 57,918 60,982 64,208
EBIT Margin 9.74% 7.43% 11.15% 12.05% 12.05% 12.05% 12.05% 12.05%
EBIT 5,015 3,366 5,523 6296 6,628 6,979 7,348 7,737
Taxes 2,012 1,214 2,035 2,204 2,320 2,408 2,535 2,669
NOPAT 3,003 2,152 3,488 4,093 4,308 4,571 4,813 5,068
Plus: D&A 1,814 1,747 1,792 1881 2,019 2,126 2,238 2,356
Less: Cap Ex 2,636 1,602 1,389 1567 1650 1738 1829 1926
Less: Change 1,130 194 1,090 1,149 1,210 1,274 1,342 1,413
NWC
FCFF 1,051 2,103 2,801 3,257 3,467 3,685 3,880 4,085
Free Cash Flow Assumptions:
Revenue: We based revenue growth off of the Pro Forma Income Statement along with consideration
from the growth matrixes found in the appendix. Growth for 2011 is 5.45% and decreases to 5.29% for
the years 2012 to 2015.
EBIT: We based our EBIT off of historical EBIT margins. There has been a trend up in the margin and
UPS is expected to continue to improve their EBIT margin in the years to come.
Tax Rate: We set the tax rate at 35% of EBIT for the years 2011 and 2012. For the years 2013 to 2015
we lowered the tax rate to 34.5% of EBIT because the increase in international sales should effectively
lower the tax rate for UPS.
Depreciation and Amortization: For our forecast of depreciation and amortization for 2011 to 2015, we
looked at the expenses as a percent of revenue. We used the historical average of 3.67% to forecast our
estimates.
Capital Expenditures: We looked at historical capital expenditures on the Cash Flow Statement and
then set them up as a percentage of revenue. We used a historical average of 3% of revenue.
26
28. Net Working Capital: We looked at historical net working capital expenditures on the Cash Flow
Statement and then set them up as a percentage of revenue. We used a historical average of 2.2% of
revenue.
Discounted Cash Flows
2011 2012 2013 2014 2015 Terminal Value
FCFF $ 3,257 $ 3,467 $ 3,685 $ 3,880 $ 4,085 $ 136,179
WACC 8.25% 8.25% 8.25% 8.25% 8.25% 8.25%
PV of CF $ 3,009 $ 2,959 $ 2,905 $ 2,826 $ 2,748 $ 91,616
Number of Periods 1 2 3 4 5 5
Discounted Cash Flow Assumptions:
WACC:
WACC = (% Debt)(Cost of Debt)(1-T) + (% Equity)(Cost of Equity)
WACC = (28.6%)(4.77%)(65%)+(71.4%)(10.71%)
WACC = (8.25%)
Terminal Value: In Order to forecast terminal value for UPS, we used a 3% estimate for our expected steady
growth rate of UPS’s FCFF in perpetuity.
Spreadsheet DCF Valuation
PV of CFs 14,447
PV of TV 91,616
Enterprise Value 106,063
Debt 10,491
Cash 4,081
Market Cap 91,491
Shares Outstanding 1,003
Price Per Share $ 91.22
Current Price $ 76.47
Margin of Safety 19%
Spreadsheet DCF Valuation: For our spreadsheet DCF valuation we added together the total present values of
each of the yearly forecasts along with the terminal value estimate to arrive at an enterprise value. We then
subtracted debt and cash to arrive at market cap. We then divided the market cap by shares outstanding to arrive
at an estimated price per share of $91.22.
27
29. Price Target
Price Target
P/E P/S EV/EBITDA DCF
Valuation Price $ 87.35 $ 86.04 $ 89.09 $ 91.22
Weight 25% 25% 25% 25%
Weighted Value Price $ 88.43
Current Price $ 76.47
Margin of Safety 16%
Target Price: For our target price, we weighted each valuation equally at 25%. We arrived at a weighted
valuation price of $88.43, which gives us a margin of safety of 16%.
Conclusion
We recommend buying 900 shares of UPS at an approximate NAV of $68,814
We believe UPS has high potential in fragmented emerging markets like China, as evident by its recent
expansions in 2010 and its purchase of seven new airplanes in 2011. Air freight transportation is
growing here.
UPS has high operating margins and will gain even higher profits as the economy recovers and they
have higher pricing power in 2011 and 2012. Management has even forcasted 2011 earnings to exceed
peek levels in 2007.
UPS is growing its Supply Chain and Freight division, using customizable logistics solutions. While
they are already utilized for many retail and high tech companies, they are branching out into global
healthcare distribution market We believe there is high growth potential for this segment. In January,
UPS announced UPS Healthcare facilities expansion in Kentucky, Singapore, Netherlands, and in
Canada.
UPS operates in a dupology competitive environment, with their only direct competitor being FedEx.
Past performance has shown they are able to set prices on rates as well as pass along higher costs of
doing business, such as energy price increases.
Thec ompany’s financial strength has allowed them to generate consistent cash flows across all their
business segments and produce a 6-year average ROE of 28%.
2011 EPS is projected to reach an all-time high.
28
30. APPENDIX
Financial Statements
UNITED PARCEL SERVICE, INC. AND SUBSIDIARIES
CONSOLIDATED BALANCE SHEETS
(In millions)
December 31,
2009 2008
ASSETS
Current Assets:
Cash and cash equivalents $ 1,542 $ 507
Marketable securities 558 542
Accounts receivable, net 5,369 5,547
Finance receivables, net 287 480
Deferred income tax assets 585 494
Income taxes receivable 266 167
Other current assets 668 1,108
Total Current Assets 9,275 8,845
Property, Plant and Equipment, Net 17,979 18,265
Goodwill 2,089 1,986
Intangible Assets, Net 596 511
Non-Current Finance Receivables, Net 337 476
Other Non-Current Assets 1,607 1,796
Total Assets $31,883 $31,879
LIABILITIES AND SHAREOWNERS’ EQUITY
Current Liabilities:
Current maturities of long-term debt and commercial paper $ 853 $ 2,074
Accounts payable 1,766 1,855
Accrued wages and withholdings 1,416 1,436
Self-insurance reserves 757 732
Income taxes accrued 258 37
Other current liabilities 1,189 1,683
Total Current Liabilities 6,239 7,817
Long-Term Debt 8,668 7,797
Pension and Postretirement Benefit Obligations 5,457 6,323
Deferred Income Tax Liabilities 1,293 588
Self-Insurance Reserves 1,732 1,710
Other Non-Current Liabilities 798 864
Shareowners’ Equity:
Class A common stock (285 and 314 shares issued in 2009 and 2008) 3 3
Class B common stock (711 and 684 shares issued in 2009 and 2008) 7 7
Additional paid-in capital 2 —
Retained earnings 12,745 12,412
Accumulated other comprehensive loss (5,127) (5,642)
Deferred compensation obligations 108 121
Less: Treasury stock (2 shares in 2009 and 2008) (108) (121)
Total Equity for Controlling Interests 7,630 6,780
Noncontrolling Interests 66 —
Total Shareowners’ Equity 7,696 6,780
Total Liabilities and Shareowners’ Equity $31,883 $31,879
29
31. UNITED PARCEL SERVICE, INC. AND SUBSIDIARIES
STATEMENTS OF CONSOLIDATED INCOME
(In millions, except per share amounts)
Years Ended December 31,
2009 2008 2007
Revenue $45,297 $51,486 $49,692
Operating Expenses:
Compensation and benefits 25,640 26,063 31,745
Repairs and maintenance 1,075 1,194 1,157
Depreciation and amortization 1,747 1,814 1,745
Purchased transportation 5,379 6,550 5,902
Fuel 2,365 4,134 2,974
Other occupancy 985 1,027 958
Other expenses 4,305 5,322 4,633
Total Operating Expenses 41,496 46,104 49,114
Operating Profit 3,801 5,382 578
Other Income and (Expense):
Investment income 10 75 99
Interest expense (445) (442) (246)
Total Other Income and (Expense) (435) (367) (147)
Income Before Income Taxes 3,366 5,015 431
Income Tax Expense 1,214 2,012 49
Net Income $ 2,152 $ 3,003 $ 382
Basic Earnings Per Share $ 2.16 $ 2.96 $ 0.36
Diluted Earnings Per Share $ 2.14 $ 2.94 $ 0.36
UNITED PARCEL SERVICE, INC. AND SUBSIDIARIES
STATEMENTS OF CONSOLIDATED CASH FLOWS
(In millions)
Years Ended December 31,
2009 2008 2007
Cash Flows From Operating Activities:
Net income $ 2,152 $ 3,003 $ 382
Adjustments to reconcile net income to net cash from operating activities:
Depreciation and amortization 1,747 1,814 1,745
Pension and postretirement benefit expense 872 726 513
Pension and postretirement benefit contributions (924) (246) (687)
Self-insurance reserves 47 87 69
Deferred taxes, credits and other 471 187 (249)
Stock compensation expense 430 516 447
Asset impairment charges 181 575 221
Other (gains) losses 115 634 243
Changes in assets and liabilities, net of effect of acquisitions:
Accounts receivable (30) 197 (380)
Income taxes receivable 27 1,161 (1,191)
Other current assets 136 (144) (3)
Accounts payable (107) 87 (37)
Accrued wages and withholdings (102) 44 108
Other current liabilities 184 (184) 56
Other operating activities 86 (31) (114)
Net cash from operating activities 5,285 8,426 1,123
Cash Flows From Investing Activities:
Capital expenditures (1,602) (2,636) (2,820)
Proceeds from disposals of property, plant and equipment 60 147 85
Purchases of marketable securities (2,251) (3,391) (9,017)
Sales and maturities of marketable securities 2,240 3,113 9,638
30
32. Net (increase) decrease in finance receivables 261 (49) (39)
Other investing activities 44 (363) (46)
Net cash (used in) investing activities (1,248) (3,179) (2,199)
Cash Flows From Financing Activities:
Net change in short-term debt (1,738) (2,016) 2,613
Proceeds from long-term borrowings 3,160 3,613 4,094
Repayments of long-term borrowings (1,944) (2,518) (198)
Purchases of common stock (561) (3,570) (2,639)
Issuances of common stock 149 169 174
Dividends (1,751) (2,219) (1,703)
Other financing activities (360) (161) (44)
Net cash provided by (used in) financing activities (3,045) (6,702) 2,297
Effect Of Exchange Rate Changes On Cash And Cash Equivalents 43 (65) 12
Net Increase (Decrease) In Cash And Cash Equivalents 1,035 (1,520) 1,233
Cash And Cash Equivalents:
Beginning of period 507 2,027 794
End of period $ 1,542 $ 507 $ 2,027
Cash Paid During The Period For:
Interest (net of amount capitalized) $ 390 $ 359 $ 248
Income taxes $ 443 $ 760 $ 1,351
Growth Matrixes
2005 2006 2007 2008 2009 2010
Total Revenue 42,581 47,547 49,692 51,486 45,297 49,545
2006 2007 2008 2009 2010
2005 11.66% 8.03% 6.53% 1.56% 3.08%
2006 4.51% 4.06% -1.60% 1.03%
2007 3.61% -4.52% -0.10%
2008 -12.02% -1.90%
2009 9.38%
Median 3.08%
Mean 2.22%
2005 2006 2007 2008 2009 2010
U.S. Domestic Package Revenue 28,610 30,456 30,985 31,278 28,158 29,742
2006 2007 2008 2009 2010
2005 6.45% 4.07% 3.02% -0.40% 0.78%
2006 1.74% 1.34% -2.58% -0.59%
2007 0.95% -4.67% -1.36%
2008 -9.98% -2.49%
2009 5.63%
31
33. Median 0.78%
Mean 0.13%
2005 2006 2007 2008 2009 2010
International Package Revenue 7,977 9,089 10,281 11,293 9,699 11,133
2006 2007 2008 2009 2010
2005 13.94% 13.53% 12.29% 5.01% 6.89%
2006 13.11% 11.47% 2.19% 5.20%
2007 9.84% -2.87% 2.69%
2008 -14.11% -0.71%
2009 14.79%
Median 6.89%
Mean 6.22%
2005 2006 2007 2008 2009 2010
Supply Chain & Freight Revenue 5,994 8,002 8,426 8,915 7,440 8,670
2006 2007 2008 2009 2010
2005 33.50% 18.56% 14.14% 5.55% 7.66%
2006 5.30% 5.55% -2.39% 2.02%
2007 5.80% -6.03% 0.96%
2008 -16.54% -1.38%
2009 16.53%
Median 5.55%
Mean 5.95%
List of International Hubs
Main U.S. Hubs Europe
Louisville, KY Cologne Bonn Airport (Main Hub)
Philadelphia, PA East Midlands Airport, UK
Dallas, TX London Stansted Airport, UK
Rockford, IL Asia & Pacific
Columbia, SC Incheon, Korea
Hartford, CT Pampanga, Philippines
Canada Taipei, Taiwan
Hamilton, ON Hong Kong
Concord, ON Shanghai
Mississauga, ON
Mirabel, QC
Calgary, AB
Vancouver, BC
32