Get on the Fast-Track
•Descargar como PPTX, PDF•
1 recomendación•128 vistas

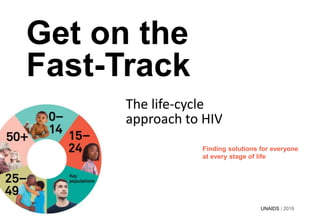
The life-cycle approach to HIV Finding solutions for everyone at every stage of life

Recomendados
Recomendados
Más contenido relacionado
La actualidad más candente
La actualidad más candente (20)
Similar a Get on the Fast-Track
Similar a Get on the Fast-Track (20)
Más de Marcelo Gomes Freire
Más de Marcelo Gomes Freire (20)
Último
Último (20)
Get on the Fast-Track
- 1. The life-cycle approach to HIV Get on the Fast-Track Finding solutions for everyone at every stage of life UNAIDS | 2016
- 2. Introduction
- 3. Source: UNAIDS 2016 estimates. Proportion of new HIV infections by sex, global and eastern and southern Africa, 2015 Men Age (years) global Percentage(%) Women Age (years) eastern and southern Africa
- 4. Investments in the AIDS responses of low- and middle- income countries, by source of funding, 2000–2015 Source: UNAIDS estimates, June 2016 - UNAIDS-Kaiser Family Foundation. Financing the response to AIDS in low- and middle-income countries till 2015 - OECD CRS last accessed June 2016. Global Fund to Fight AIDS, Tuberculosis and Malaria US$(billion) United States (bilateral) Other bilateral governmentsDomestic (public and private) Other multilaterals and foundations
- 5. Source: Lamontagne E, Over M, Stover J et al. The economic returns of ending the AIDS epidemic by 2030. 2016, in press. Additional HIV infections averted through a Fast-Track response, compared to 2015 levels of coverage, 2016–2030 Eastern and southern Africa Asia and the Pacific Latin America and the Caribbean Western and central Africa Eastern Europe and central Asia North Africa and the Middle East) Number(millions)
- 6. Additional AIDS-related deaths averted through a Fast-Track response, compared to 2015 levels of coverage, 2016–2030 Source: Lamontagne E, Over M, Stover J et al. The economic returns of ending the AIDS epidemic by 2030. 2016, in press. Number(millions) Eastern and southern Africa Western and central Africa Asia and the Pacific Latin America and the Caribbean Eastern Europe and central Asia North Africa and the Middle East)
- 7. Finding solutions for everyone at every stage of life Children (0–14)
- 8. New HIV infections among children (aged 0–14 years) and percentage of pregnant women living with HIV receiving antiretroviral medicines (either prophylaxis or lifelong therapy) to prevent mother-to-child transmission, global, 2005–2015 Source: UNAIDS 2016 estimates. Note: In 2010, single-dose nevirapine was no longer included in ARV coverage as an effective regimen for the prevention of mother-to-child transmission. New HIV infections PMTCT coverage Global targets of new HIV infections Global PMTCT target Number of new HIV infections among children (aged 0–14 years) Percentage (%) of pregnant women living with HIV accessing PMTCT services
- 9. Source: 2016 Global AIDS Response Progress Reporting; UNAIDS 2016 estimates. Children (aged 0–14 years) living with HIV on antiretroviral therapy and number of AIDS-related deaths among children, global, 2005–July 2016 Children living with HIV on antiretroviral treatment Global child antiretroviral treatment target AIDS-related deaths among children Number of AIDS- related deaths among children (aged 0–14 years) Number of children living with HIV (aged 0–14 years) on antiretroviral therapy
- 10. Source: UNAIDS 2016 estimates. Distribution of new HIV infections among children (aged 0–14 years), global, 2015 Nigeria India Kenya Indonesia Zimbabwe South Africa United Republic of Tanzania Mozambique Remaining countries Malawi Zambia
- 11. Progress toward the elimination of HIV infections among children (aged 0–14 years), by country, 2015 For countries not shown, both measures are not available or under review. L Measures not available ≤ 32% 33–65% 66–94% ≥95% Decline in new HIV infections among children (aged 0-14 years), low- and middle-income countries, 2010-2015 Percentage of pregnant women living with HIV receiving antiretroviral medicines (either prophylaxis or lifelong therapy) to prevent mother-to-child transmission, low- and middle- income countries, 2015 Asia and the Pacific Afghanistan Australia Bangladesh India Indonesia Malaysia Mongolia Myanmar Nepal Pakistan Papua New Guinea Philippines Sri Lanka Thailand Viet Nam Eastern Europe and Central Asia Azerbaijan Belarus Georgia Kazakhstan Kyrgyzstan Republic of Moldova Tajikistan Ukraine Uzbekistan Legend Measures not available ≤ 19% 20–49% 50–79% ≥80%
- 12. Progress toward the elimination of HIV infections among children (aged 0–14 years), by country, 2015 For countries not shown, both measures are not available or under review. Decline in new HIV infections among children (aged 0-14 years), low- and middle-income countries, 2010-2015 Percentage of pregnant women living with HIV receiving antiretroviral medicines (either prophylaxis or lifelong therapy) to prevent mother-to-child transmission, low- and middle- income countries, 2015 Latin America and the Caribbean Argentina Bahamas Belize Bolivia (Plurinational State of) Brazil Colombia Costa Rica Cuba Dominican Republic Ecuador El Salvador Guatemala Guyana Haiti Honduras Jamaica Mexico Nicaragua Panama Paraguay Peru Suriname Trinidad and Tobago Uruguay Venezuela (Bolivarian Republic of) L Measures not available ≤ 32% 33–65% 66–94% ≥95% Legend Measures not available ≤ 19% 20–49% 50–79% ≥80%
- 13. Progress toward the elimination of HIV infections among children (aged 0–14 years), by country, 2015 For countries not shown, both measures are not available or under review. Decline in new HIV infections among children (aged 0-14 years), low- and middle-income countries, 2010-2015 Percentage of pregnant women living with HIV receiving antiretroviral medicines (either prophylaxis or lifelong therapy) to prevent mother-to-child transmission, low- and middle- income countries, 2015 Eastern and southern Africa Angola Botswana Eritrea Kenya Lesotho Madagascar Malawi Mozambique Namibia Rwanda South Africa South Sudan Swaziland Uganda United Republic of Tanzania Zambia Zimbabwe Middle East and North Africa Algeria Djibouti Egypt Iran (Islamic Republic of) Morocco Somalia Sudan Yemen L Measures not available ≤ 32% 33–65% 66–94% ≥95% Legend Measures not available ≤ 19% 20–49% 50–79% ≥80%
- 14. Progress toward the elimination of HIV infections among children (aged 0–14 years), by country, 2015 For countries not shown, both measures are not available or under review. Decline in new HIV infections among children (aged 0-14 years), low- and middle-income countries, 2010-2015 Percentage of pregnant women living with HIV receiving antiretroviral medicines (either prophylaxis or lifelong therapy) to prevent mother-to-child transmission, low- and middle- income countries, 2015 Western and central Africa Benin Burkina Faso Burundi Cameroon Cabo Verde Central African Republic Chad Côte d’Ivoire Democratic Republic of the Congo Equatorial Guinea Gabon Gambia Ghana Guinea Liberia Mali Mauritania Niger Senegal Sierra Leone Togo Western & Central Europe & North America Greece Italy Latvia Legend Measures not available ≤ 19% 20–49% 50–79% ≥80% L Measures not available ≤ 32% 33–65% 66–94% ≥95% Spain
- 15. Six-week and final mother-to-child transmission rates, by country, 2015 Source: UNAIDS 2016 estimates. Six-week transmission rate Final transmission rate Mother-to-child transmission rate (%) Angola Chad Ghana Côte d’Ivoire Cameroon Lesotho Malawi United Republic of Tanzania Zimbabwe Burundi Mozambique Zambia Namibia Swaziland Uganda Botswana South Africa Democratic Republic of the Congo Kenya
- 16. AIDS-related deaths among children by age group, global, 2000–2015 Source: UNAIDS 2016 estimates. Number 0–4 years 5–9 years 10–14 years
- 17. Percentage of infants born to women living with HIV receiving a virological test within the first two months of life, by country, 2015 Source: 2016 Global AIDS Response Progress Reporting. Percentage(%)
- 18. Four prongs to eliminate mother-to-child transmission of HIV and improve maternal health Prong 4 Provision of appropriate treatment, care and support to women, children living with HIV and their families Women of reproductive age Women living with HIV Pregnant women living with HIV Children living with HIV Prong 1 Primary prevention of HIV among women of childbearing age Prong 2 Prevention of unintended pregnancies among women living with HIV Prong 3 Prevention of HIV from a woman living with HIV to her infant
- 19. Finding solutions for everyone at every stage of life Young people (15–24)
- 20. New HIV infections among young women (aged 15–24 years), global, 2005–2015 Source: UNAIDS 2016 estimates. New HIV infections Global target Number
- 21. Source: Population-based surveys, 2012–2015. * Data for South Africa refers to condom use at last sex among young women aged 15-24 who reported being sexually active. Percentage of young women (aged 15–24 years) reporting use of a condom at last sexual intercourse with a non-regular partner in the 12 months prior to the survey, eight countries in sub-Saharan Africa, 2012–2015Percentage(%) Lesotho Namibia Kenya Rwanda South Africa* Nigeria Zambia Comoros
- 22. Demand for family planning satisfied by modern methods among young women (aged 15–24 years), by country, 2010–2015 Source: Demographic and Health Surveys, 2010-2015. Percentage(%)
- 23. Percentage of people living with HIV (aged 15–59 years) who have ever been tested for HIV and received the results, by age group, 19 low- and middle-income countries, 2011–2015 Source: Demographic and Health Surveys, 2011–2015. Percentage(%) 15–19 20–24 25–29 30–34 35–39 40–44 45–49 50–54 55–59 Age (years)
- 24. Distribution of new HIV infections among men and women by five-year age groups, nine locations in eastern and southern Africa, 2010–2014 Source: Network for Analysis of Longitudinal Population-based HIV/AIDS Data on Africa (ALPHA), 2016. Percentage(%) Age (years) eastern African countries Age (years) southern African countries Men Women
- 25. Cycle of HIV transmission, results from a phylogenetic study, KwaZulu-Natal, South Africa, 2016 Source: Centre for the AIDS Programme of Research in South Africa, 2016. Among men linked to young women (<25), 39% were simultaneously linked to a 25-40-year-old woman Most HIV transmission is likely from higher prevalence (men 25-40 years old) to lower prevalence )women under 25 years old) Most HIV transmission is likely from higher prevalence (women 25-40 years old) to lower prevalence (men 25-40 years old) As women age, the cycle repeats
- 26. ** The 25 countries included in the analysis are Botswana, Brazil, Cameroon, Côte d’Ivoire, Democratic Republic of the Congo, Ethiopia, Haiti, India, Indonesia, Iran (Islamic Republic of), Kenya, Lesotho, Malawi, Mozambique, Namibia, Nigeria, Rwanda, South Africa, Swaziland, Thailand, Uganda, Ukraine, United Republic of Tanzania, Zambia and Zimbabwe. Source: UNAIDS special analysis, 2016; for more details, see annex on methodology. Number of young people living with HIV (aged 15–19 years) by mode of HIV acquisition, 25 countries,* 1970–2015 Mother-to-child transmissionSexual and unsafe injection transmission Number
- 27. Detailed strategy mix for HIV prevention among young women–a menu of options Support choices of women who have agency Reduce susceptibility and transmissibility Enhance agency among adolescent girls and young women
- 28. Programmes for adolescent girls and young women (aged 15–24 years) in Swaziland, 2016 *DREAMS is supported by the United States President’s Emergency Plan for AIDS Relief (PEPFAR), the Bill & Melinda Gates Foundation, Girl Effect, Johnson & Johnson, Gilead Sciences, and ViiV Healthcare. Source: Swaziland Central Statistics Office 2016; PEPFAR Swaziland 2016. 1 Determined, Resilient, Empowered, AIDS-free, Mentored, and Safe Women. The partnership is supported by the United States President’s Emergency Plan for AIDS Relief (PEPFAR), the Bill & Melinda Gates Foundation, Girl Effect, Johnson & Johnson, Gilead Sciences and ViiV Healthcare. 2 Kenya, Lesotho, Malawi, Mozambique, South Africa, Swaziland, Uganda, United Republic of Tanzania, Zambia and Zimbabwe. Together, these countries accounted for an estimated 55% of new HIV infections among adolescent girls and young women in 2015. DREAMS* DREAMS and the Global Fund PEPFAR Country Operational Plan PEPFAR Country Operational Plan and the Global Fund The Global Fund to Fight AIDS, Tuberculosis and Malaria (Global Fund)
- 29. Past-week adolescent antiretroviral therapy non-adherence, by access to various social protection measures, South Africa, 2016 Source: L. D. Cluver, E. Toska, F. M. Orkin, F. Meinck, R. Hodes, A. R. Yakubovich & L. Sherr (2016) Achieving equity in HIV-treatment outcomes: can social protection improve adolescent ART-adherence in South Africa?, AIDS Care, 28:sup2, 73-82, DOI: 10.1080/09540121.2016.1179008. No social protection Support group Food security Monitoring Food security and support group Support group and monitoring Food security and monitoring Food security, support group and monitoring Percentage(%)
- 30. Finding solutions for everyone at every stage of life Key populations throughout the life cycle
- 31. Trends in new HIV infections among key populations, global, 2011–2015 * Data on transgender people are from the Asia-Pacific and Latin America and Caribbean regions only. Source: UNAIDS special analysis, 2016. Number Sex workers People who inject drugs Gay man and other men who have sex with men Transgender people*
- 32. Country status Criminalization of any aspect of sex work, by country, 2016 Source: Sexual Rights Initiative. 2016. National sexual rights law and policy database. (http://sexualrightsdatabase.org/page/welcome, accessed 13 November, 2016)” Selling and buying sexual services criminalized Selling sexual services criminalized Buying sexual services criminalized Partial criminalization Other punitive regulation Not subject to punitive regulation /not criminalized Issue determined /differs at subnational level Data not available
- 33. Country status Criminalization of same-sex sexual relations, by country Source: International Lesbian, Gay, Bisexual, Trans and Intersex Association, State Sponsored Homophobia 2016: A world survey of sexual orientation laws: criminalisation, protection and recognition (Geneva; May 2016). Death penalty Imprisonment 15 years to life Imprisonment up to 14 years Relationship between males is illegal, no penalty specified Promotion ("propaganda") laws limiting freedom of expression Laws penalizing same-sex sexual acts decriminalized, or never existed Data not available
- 34. Comprehensive approaches Detailed strategy mix for HIV prevention among transgender people 1/2 Reduce host susceptibility Decrease source of HIV Infection Increase safer sexual behaviours, uptake of services and adherence (CONTINUATION ON NEXT SLIDE)
- 35. Comprehensive approaches Detailed strategy mix for HIV prevention among transgender people 2/2 Effective anti discrimination legislation and recognition under the law
- 36. Comprehensive approaches Detailed strategy mix for HIV prevention among people who inject drugs (CONTINUATION ON NEXT SLIDE) 1/2 Availability of a services Risk perception and adoption of safer behaviours
- 37. Comprehensive approaches Detailed strategy mix for HIV prevention among people who inject drugs 2/2 Enabling environment and empowerment for service uptake
- 38. Comprehensive approaches Detailed strategy mix for HIV prevention among sex workers 1/2 (CONTINUATION ON NEXT SLIDE) Availability of a services Increased agency and adoption of safer behaviours Violence systematically reported by sex workers and increased follow-up
- 39. Comprehensive approaches Detailed strategy mix for HIV prevention among sex workers 2/2 Improved risk environment
- 40. Comprehensive approaches Detailed strategy mix for HIV prevention among gay men and other men who have sex with men 1/2 (CONTINUATION ON NEXT SLIDE) Reduce transmissibility Increase access Increase safer sexual behaviours, uptake of services and adherence
- 41. Comprehensive approaches Detailed strategy mix for HIV prevention among gay men and other men who have sex with men 2/2 Decriminalization of same sex behaviours and empowerment
- 42. Rapid scale-up of HIV testing and counselling services for sex workers: the experience of the Red Umbrella Programme in South Africa, 2013–2016 Source: Networking HIV & AIDS Community of Southern Africa (NACOSA), 2016. Percentage(%) Actual Target
- 43. Geospatial data visualization in the UNAIDS Key Populations Atlas
- 44. Finding solutions for everyone at every stage of life Adulthood (25–49)
- 45. New HIV infections among men and women (aged 25–49 years), global, 2005–2015 Source: UNAIDS 2016 estimates. Women aged 25-49 years Men aged 25-49 years
- 46. People living with HIV on antiretroviral therapy, all ages, global, 2010–July 2016 Source: Global AIDS Response Progress Reporting, 2016; UNAIDS 2016 estimates. Number(millions) People living with HIV on antiretroviral therapy (all ages) Global target
- 47. Source: 2016 Global AIDS Response Progress Reporting; UNAIDS 2016 estimates. Country status Progress toward the 90–90–90 targets, all ages, by country, 2015 For countries not shown, both measures are not available or under review. Knowledge of status among people living with HIV (%) Coverage of antiretroviral therapy among people living with HIV (%) Viral suppression among people living with HIV (%) Asia and the Pacific Afghanistan Australia Bangladesh Cambodia India Indonesia Malaysia Mongolia Myanmar Nepal Pakistan Papua New Guinea Philippines Sri Lanka Thailand Eastern Europe and Central Asia Azerbaijan Belarus Georgia Kazakhstan Kyrgyzstan Republic of Moldova Tajikistan Ukraine Uzbekistan Legend 90% and higher 45–89% 44% or lower Measures not available L 81% or higher 41–80% 40% or lower Measures not available L 73% and higher 37–72% 36% or lower Measures not available Viet Nam Armenia
- 48. Source: 2016 Global AIDS Response Progress Reporting; UNAIDS 2016 estimates. Country status Progress toward the 90–90–90 targets, all ages, by country, 2015 For countries not shown, both measures are not available or under review. Knowledge of status among people living with HIV (%) Coverage of antiretroviral therapy among people living with HIV (%) Viral suppression among people living with HIV (%) Latin America and the Caribbean Argentina Bahamas Belize Bolivia (Plurinational State of) Brazil Colombia Costa Rica Cuba Dominican Republic Ecuador El Salvador Guatemala Guyana Haiti Honduras Jamaica Mexico Nicaragua Panama Paraguay Peru Suriname Trinidad and Tobago Uruguay Venezuela (Bolivarian Republic of) Legend 90% and higher 45–89% 44% or lower Measures not available L 81% or higher 41–80% 40% or lower Measures not available L 73% and higher 37–72% 36% or lower Measures not available Barbados Chile
- 49. Source: 2016 Global AIDS Response Progress Reporting; UNAIDS 2016 estimates. Country status Progress toward the 90–90–90 targets, all ages, by country, 2015 For countries not shown, both measures are not available or under review. Knowledge of status among people living with HIV (%) Coverage of antiretroviral therapy among people living with HIV (%) Viral suppression among people living with HIV (%) Eastern and southern Africa Angola Botswana Eritrea Kenya Lesotho Madagascar Malawi Mozambique Namibia Rwanda South Africa South Sudan Swaziland Uganda United Republic of Tanzania Zambia Zimbabwe Middle East and North Africa Algeria Djibouti Egypt Iran (Islamic Republic of) Lebanon Morocco Somalia Legend 90% and higher 45–89% 44% or lower Measures not available L 81% or higher 41–80% 40% or lower Measures not available L 73% and higher 37–72% 36% or lower Measures not available Mauritius Tunisia Yemen Sudan
- 50. Source: 2016 Global AIDS Response Progress Reporting; UNAIDS 2016 estimates. Country status Progress toward the 90–90–90 targets, all ages, by country, 2015 For countries not shown, both measures are not available or under review. Knowledge of status among people living with HIV (%) Coverage of antiretroviral therapy among people living with HIV (%) Viral suppression among people living with HIV (%) Western and central Africa Benin Burkina Faso Burundi Cabo Verde Cameroon Central African Republic Chad Côte d’Ivoire Democratic Republic of the Congo Equatorial Guinea Gabon Gambia Ghana Guinea Liberia Mali Mauritania Niger Senegal Sierra Leone Togo Western & Central Europe & North America Greece Latvia Spain Legend 90% and higher 45–89% 44% or lower Measures not available L 81% or higher 41–80% 40% or lower Measures not available L 73% and higher 37–72% 36% or lower Measures not available
- 51. Percentage of people living with HIV (aged 15–49 years) who have ever been tested for HIV and received the results, men and women, 21 countries, 2011–2015 Source: Demographic and Health Surveys, 2011–2015. *Includes Dominican Republic and Haiti. Women living with HIV (aged 15–49 years) Men living with HIV (aged 15–49 years)
- 52. Comparison of men and women 10 years after HIV infection, before and after the availability of antiretroviral therapy, three locations in southern Africa Source: Network for Analysis of Longitudinal Population-based HIV/AIDS data on Africa (ALPHA), 2016. Percentage(%) Alive, started antiretroviral therapy Alive, never had antiretroviral therapy Died
- 53. A comprehensive approach Detailed strategy mix for HIV prevention among adolescent boys and adult men in high-prevalence settings—a menu of options Sexual behaviors Demand and uptake of health services Susceptibility and transmissibility Health-seeking and gender-based violence
- 54. Finding solutions for everyone at every stage of life Ageing (50+)
- 55. Number of people living with HIV (aged 50 years and over), high-income countries and low- and middle-income countries, 2000–2015 and projected to 2020 Source: UNAIDS 2016 estimates. Note: Projections 2016–2020 are based on an assumption that scale up of antiretroviral treatment will reach 81% coverage of all people living with HIV by 2020. Country income classifications are from 2015. People living with HIV (aged 50 years and over) in high-income countries People living with HIV (aged 50 years and over) in low- and middle-income countries People living with HIV (aged 50 years and over) in high-income countries People living with HIV (aged 50 years and over) in low- and middle-income countries Number(million)
- 56. Critical risks, services and strategic information for people living with HIV aged 50 and over
- 57. UNAIDS Joint United Nations Programme on HIV/AIDS 20 Avenue Appia CH-1211 Geneva 27 Switzerland +41 22 791 3666 unaids.org