
Recomendados
Más contenido relacionado
Destacado
Similar a Graph
Similar a Graph (20)
Más de maricrisracho
Más de maricrisracho (6)
Graph
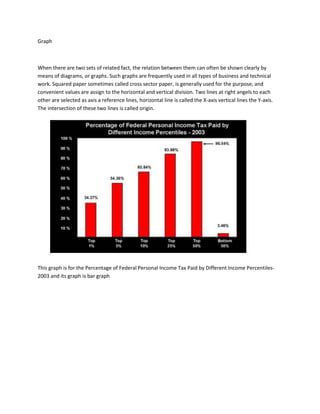
- 1. Graph <br />3048001353820When there are two sets of related fact, the relation between them can often be shown clearly by means of diagrams, or graphs. Such graphs are frequently used in all types of business and technical work. Squared paper sometimes called cross sector paper, is generally used for the purpose, and convenient values are assign to the horizontal and vertical division. Two lines at right angels to each other are selected as axis a reference lines, horizontal line is called the X-axis vertical lines the Y-axis. The intersection of these two lines is called origin. <br />This graph is for the Percentage of Federal Personal Income Tax Paid by Different Income Percentiles-2003 and its graph is bar graph <br />728980346138519050-751205<br />As you can see, the new crit chance is slightly lower across the board, which we wanted. More importantly though, is that the rate at which the crit chance increases based on the amount of recent damage you've done. We like to think of that recent damage total as a rough measure of your performance.In thinking about the change we wanted to make to critical hits, we decided that there was a point on the graph of particular interest to us, and that was the point at which your critical hit chance was as much a result of your performance as it was the base chance. If you look at at (A) on the old line, you'll see that point isn't reached until you've done 550 recent damage, a feat that occurs about as often as our backstab code works correctly. That point is reached at (B) on the new line, around the point where you've done 175 recent damage. This means that if you've just singlehandedly killed an enemy Demoman/Soldier/Pyro/Heavy, your next 20 seconds worth of crit chances are already more a result of that kill than the base chance. As a result, if you're a highly skilled player, you're going to fire significantly more critical hits than those around you. And remember, if you've just killed 2 or 3 enemies, now's the time to push!<br />Circle Graphs<br />Circle graphs can be used to see how much time you spend eating and sleeping or just hanging out with friends. They can be used in math as well. here are some links to more sites on circle graphs.<br />Circle and pie graphs: This site explains how a circle graph works on a very somple basis.<br />Circle graphs, bar graphs, and tables: This site starts with a contents table. You click on whatever graph you want to see and it explains how the graph works.<br />1120775605790How circle graphs work: This site shows how to read and make circle graphs. It also shows how to turn the results of a circle graph into a decimal.<br /> <br /> <br />Overview<br />The Graphing components provide solutions for the incorporation of graphs & charts into web / intranet pages and applications. Versatile components provide the ability for web authors and developers to easily build and publish dynamic interactive graphs & charts. <br />The graphing components can acquire data from a variety of sources including,<br />Databases<br />Files<br />Scripts and server Side processes (eg. PHP, Servlets, JSP, ASP, PERL etc)<br /> <br />lefttop<br />