SlideShare una empresa de Scribd logo
1 de 4
Descargar para leer sin conexión
1
Fracture Prediction Using Low Coverage Seismic Data in Area of Complicated Structures
*Yan Li, Deying Zhong, Haiquan Wang, Jun Li, Mark Mo, Jiaqi Wang, LandOcean Energy Services Co., Ltd
*Mario A. Prince S., Daniel Rojas, Petroleos Del Norte S.A.
Summary
This paper presents an innovative integrated workflow
and methodology which can help to improve the
resolution and accuracy of characterizing a limestone
fractured reservoir based on 3D seismic data with low
fold coverage in complicated structure area, Colombia.
This integrated study used advanced azimuthal seismic
processing technique and leading fracture prediction
technique based on all available data.
A new processing sequence and method was created
and applied to overcome the shortage of seismic data,
which is the prior condition to ensure the accuracy of
fracture prediction in limestone reservoir. The fracture
orientation and intensity can be derived from attribute
variation of different azimuthal seismic data, guided by
seismic forward modeling. Comparing with the existing
well data, the fracture intensity and orientation
prediction are extremely consistent with FMI log. It
indicates that fracture prediction technique based on 3D
P-wave seismic data can get reliable results based on
low coverage seismic data in areas with complicated
structure.
Introduction
The study area is located in the northeast of Colombia,
between middle and east Cordillera Mountain. Because
of the special tectonic background, the strike-slip fault
developed very well and divided the whole study area
into different fault blocks (Fig. 1).
The reservoir is limestone of the Lower Cretaceous with
very low porosity and permeability. The exploration
experience has proved that the fracture development is a
crucial factor to understand storage space, directions of
flow and areas of commercial oil production.
This paper attempts to present an innovative approach
to do azimuthal seismic data division & processing, and
characterize fractured reservoirs based on 3D P-wave
seismic data. The prediction result can describe the
spatial fracture property of target layer in a sense of half
quantity to quantify, which gives us an integrate
understanding of reservoirs. It proved that accurate
fracture prediction result can be got by using
appropriate method of seismic processing to get over
low fold number of seismic data and complicate
structure characteristic.
Core idea of methodology
The theory that fracture development can cause
amplitude variation with offset and azimuth (Shen et al.,
2002) has been universally accepted by now.
It has been proved that thin pores (fractures) have much
greater effects on velocities than rounded pores at the
same porosity and that a very low porosity (less than
0.01 percent) of thin pores could decrease the P- and S-
wave velocities (Kuster and Toksoz, 1974) and
generates seismic anisotropy. Further, Study shows that
seismic waves suffer severe scattering while
propagating through fractured reservoirs which are
Fig.2 Fracture type Reservoir integrate analysis workflow
flow
Data loading and quality control
Seismic data Well data
CMPgather
Azimuthal gather
division and extraction
Interpolation
Azimuthal gather output
PSTM
Post-stack
seismicdata
Azimuthal seismic data
Attribute calculation
Fracture intensity
Fracture orientation
Log data
FMI
S-wave
Rock
physical
forward
modeling
Fig. 1 Structure map of target layer
Well 1
Fracture Prediction Using Low Coverage Seismic Data
2
characterized vertically aligned fractures (Lynn et al.,
1995). That means how to detect azimuthal amplitude
variation with azimuth and relate it with fracture
properties is essential issue of predicting fracture
development.
To identify the effects of fracture properties on the
azimuthal amplitude variation, there are two questions
should be figured out based on special geological
condition of study area:
1) How to get precise azimuthal seismic volumes;
2) How to detect azimuthal amplitude variation and
related it with fracture properties.
Seismic data processing
As we know that the azimuthal seismic volumes are
basement of doing fracture prediction, which can affect
fracture prediction result directly. So, how to process
and use the 3D seismic data extensively is the essential
question to ensure the accuracy of fracture prediction
result.
1. Difficulties
Aimed at CMP gathers of study area, there are two key
difficult points should be paid attention to during
azimuthal trace gathers division and processing:
The offset-azimuth cross plot of the CMP gathers
reveal that the fold numbers are relatively low and
uneven (0~26), which can cause the energy
difference or empty trace of azimuthal seismic data.
The tectonic characteristics of study area are very
complex (Fig.1). How to keep the accurate structure
geometry feature of each different azimuthal
seismic volumes during seismic processing of is
another very important and tough issue.
2. Solutions
In order to overcome these two key problems, a new
seismic processing procedure was credited and applied
(Fig. 2).
The interpolation was applied to the CMP gather
which can make the energy uniform in the whole
area. The energy difference and empty trace
problem can be solved;
Three azimuthal gathers are divided reasonably and
output (Fig.4);
PSTM was applied to each different azimuthal CMP
gathers which can ensure the structure geometry
accuracy and good image;
Stack and output three azimuthal PSTM datasets.
3. Results
1) Azimuthal gather division
According to real condition of CMP gathers in study
area (low fold number, medium offset), the CMP
gathers only can be divided into three different azimuth
gathers (0~65°, 60~120°, 120~180°) in offset range of
150m~2800m (Fig. 4), aiming to unify the energy of
each azimuth gather.
2) PSTM
In order to enhance the image quality of each azimuthal
seismic volumes and keep propriety structure geometry,
an advanced PSTM method named bending ray tracing
Kirchhoff integral migration running on GPU/CPU
Co-Parallel computing system was applied to do PSTM.
Figure 5 illustrates that sections of different azimuths
after PSTM show similar waveforms and geometric
characteristics compared with whole stack result, which
confirms that the method and parameters are applicative
and reasonable to this study area.
Fig. 4 Offset and Azimuth crossplot analysis
Fig.3 The layout analysis result of CMP trace gathers
(Color presents fold number)
Fracture Prediction Using Low Coverage Seismic Data
3
3) Energy uniformity
Energy uniformity is another very important factor to
verify the azimuthal seismic data processing, because
the essential of fracture prediction is just to detect the
energy variation between different azimuthal seismic
data.
The following figures show that the amplitude energy
of each azimuth seismic data is in the same range
(-40~40). There are no empty traces through the whole
study area. The quality of azimuth seismic data is good
enough to do anisotropy detection.
Fracture characterization
According to the core idea of fracture prediction based
on 3D P-wave seismic dataset, the most sensitive
attribute has to be selected optimally on the foundation
of reliable azimuthal seismic data. As to this project, the
relative impedance was chosen as dynamic parameter to
detect fracture development.
In order to describe and understand dynamic
parameter’s variation of different azimuthal seismic
volumes directly and visually, an anisotropy ellipse as a
vector, which can presents fracture orientation and
intensity, can fitted by different values of each azimuth
in same incidence angle (Fig.7).
Figure 8 is 3D map of fracture density and orientation
prediction result for target layer. The direction of little
bars represents fracture orientation, and color represents
fracture intensity. The rose diagram is statistic result of
fracture orientations within a specified area. It
illustrates that there are two main orientations
developed, NE~SW is the primary one and NW~SE is
the second one.
Fig.7- Anisotropy vector calculated by ellipse fitting
(The axis: orientation of anisotropy; the ratio of major and minor
axis: intensity of anisotropy.)
f2
f5
amplitude
Incidence angle (offset)
f1
f3
f4
N
Fi, azimuth
f2
f5
amplitude
Incidence angle (offset)
f1
f3
f4
N
Fi, azimuth
f2
f5
amplitude
Incidenceangle(offset)
f1
f3
f4
N
Fi,azimuth
a) 0˚~65˚ azimuth stack-migration section
b) 60˚~120˚ azimuth stack-migration section
c) 120˚~180˚ azimuth stack-migration section
Fig.6 Seismic sections of different azimuth seismic data
0~65˚ azimuth stack-migration (Inline 169) section
60~120˚ azimuth stack-migration (Inline 169) section
120~180˚ azimuth stack-migration (Inline 169) section
a) b)
c) d)
Fig. 5 Geometric property comparing with different azimuth
seismic data
A) PSTM volume, B) 0~65°azimuth seismic data, C)
60~120°azimuth seismic data, D) 120~180°azimuth seismic data
0~65 °azimuth seismic data
60~120°azimuth seismic data 120~180°azimuth seismic data
Fracture Prediction Using Low Coverage Seismic Data
4
Result verification
Seismic data has wider spatial coverage than the well
data, while well logs have high vertical resolution.
Seismic data can make up the shortcomings of well data,
and well data can be taken as the prior condition to
verify fracture prediction results.
There are only one well has been drilled in study area
and it have FMI in target layer. The comparison result
of orientation from well data and seismic data can
approve that the orientation from pre-stack anisotropy
detection results is extremely similar with FMI data
(Fig. 9), and the fracture orientations derived from
seismic data can reflect the real situation of fracture
development in study area.
Conclusions
This paper attempts to demonstrate a credible method to
predict fractures by using 3D P-wave seismic data with
low coverage seismic data in complicated area. It
proved that through applying appropriate seismic
processing method and procedure, the bad influence on
accuracy of fracture prediction can be decreased as
much as possible, which caused by the shortcoming of
seismic data.
The comparison result between prediction result and
FMI log has definitely proved the accuracy and
credibility of fracture intensity and orientation results. It
not only indicated the application effect of fracture
prediction technique based on 3D P-wave seismic data,
but also proved that through appropriate processing
method, the seismic data with low coverage can be used
to do fracture analysis.
Acknowledgements
The author wishes to thank Mario Prince and Daniel
Rojas of Petroleos del Norte S. A. for their great
support of this project and permission to publish this
article. It is appreciate that Dr. Qin Gangping revising
this article.
Reference
Feng Shen, Xiang Zhu and Nafi Toksaz, effects of
fractures on P-wave NMO Velocity and P-wave
azimuthal amplitude versus offset (AVO) response,
Geophysics, Vol. 67, 711-726.
Ouenes, A., Richardson, S., Weiss, W, 1995, Fractured
reservoir characterization and performance forecasting
using geomechanics and artificial intelligence, SPE
30572 presented at the 1995 SPE Annual Technical
Conference and Exhibition.
Feng Shen, Sierra, J., D.R. Burns and Nafi Toksoz,
2002, Azimuthal offset-depent attributes (AVO and
FVO) applied to fracture detection, Geophysics, Vol. 67,
355-364
Feng Shen, Ru-shan Wu and Jinhuai Gao, 2000,
Scattering of P-S converted waves in fractured
reservoirs, 70th Ann. Internat. Mtg., Soc. Expl.
Geophys, 2365-2368.
Yijie Zhan and Shumin Chen et al., 2010, Application
of P-wave azimuthal anisotropy for fracture detection in
a volcanic reservoir, SEG Denver 2010 Annual Meeting,
283-285.
ChaoYang Zha, Zhirang Zhang and Deying Zhong et al,.
2004, Application of fractured reservoir modeling
technology to sandstone reservoirs in Songliao Basin,
China, EAGE 66th Conference & Exhibition.
b) 3D view of fracture orientation at well location
Fig. 9 Fracture orientation prediction result verification
a) Fracture orientation statistical result comparison
Fig.8 3D map of fracture intensity and orientation for
target formation

Más contenido relacionado

La actualidad más candente

Poster-CIVE-OTC-v1
Poster-CIVE-OTC-v1Poster-CIVE-OTC-v1
Poster-CIVE-OTC-v1ReZa Mousavi
 
Introduction geostatistic for_mineral_resources
Introduction geostatistic for_mineral_resourcesIntroduction geostatistic for_mineral_resources
Introduction geostatistic for_mineral_resourcesAdi Handarbeni
 
Layout Optimization of Microsatellite Components Using Genetic Algorithm
Layout Optimization of Microsatellite Components Using Genetic AlgorithmLayout Optimization of Microsatellite Components Using Genetic Algorithm
Layout Optimization of Microsatellite Components Using Genetic AlgorithmTELKOMNIKA JOURNAL
 
Barber_TU2.T03_hk_mb_casa_fg_hk_FINAL.pptx
Barber_TU2.T03_hk_mb_casa_fg_hk_FINAL.pptxBarber_TU2.T03_hk_mb_casa_fg_hk_FINAL.pptx
Barber_TU2.T03_hk_mb_casa_fg_hk_FINAL.pptxgrssieee
 
Hayashi masw gravity
Hayashi masw gravityHayashi masw gravity
Hayashi masw gravityhugang2003
 
Effect of sub classes on the accuracy of the classified image
Effect of sub classes on the accuracy of the classified imageEffect of sub classes on the accuracy of the classified image
Effect of sub classes on the accuracy of the classified imageiaemedu
 
IRJET-Mapping of Mineral Zones using the Spectral Feature Fitting Method in J...
IRJET-Mapping of Mineral Zones using the Spectral Feature Fitting Method in J...IRJET-Mapping of Mineral Zones using the Spectral Feature Fitting Method in J...
IRJET-Mapping of Mineral Zones using the Spectral Feature Fitting Method in J...IRJET Journal
 
Observations the postcorecollapse_globular_cluster_ngc_6752
Observations the postcorecollapse_globular_cluster_ngc_6752Observations the postcorecollapse_globular_cluster_ngc_6752
Observations the postcorecollapse_globular_cluster_ngc_6752Sérgio Sacani
 
Integrating_lithostatic_compression_into_velocity_models
Integrating_lithostatic_compression_into_velocity_modelsIntegrating_lithostatic_compression_into_velocity_models
Integrating_lithostatic_compression_into_velocity_modelsDennis Ellison
 
Forest Change Detection in incomplete satellite images with deep neural networks
Forest Change Detection in incomplete satellite images with deep neural networksForest Change Detection in incomplete satellite images with deep neural networks
Forest Change Detection in incomplete satellite images with deep neural networksAatif Sohail
 
Accuracy enhancement of srtm and aster dems using weight estimation regressio...
Accuracy enhancement of srtm and aster dems using weight estimation regressio...Accuracy enhancement of srtm and aster dems using weight estimation regressio...
Accuracy enhancement of srtm and aster dems using weight estimation regressio...eSAT Publishing House
 
Bump Mapping Unparametrized Surfaces on the GPU
Bump Mapping Unparametrized Surfaces on the GPUBump Mapping Unparametrized Surfaces on the GPU
Bump Mapping Unparametrized Surfaces on the GPUBrooke Hodgman
 
Geological mapping using satellite images.
Geological mapping using satellite images.Geological mapping using satellite images.
Geological mapping using satellite images.Diego Bedoya Gonzalez
 
Contribution to the investigation of wind characteristics and assessment of w...
Contribution to the investigation of wind characteristics and assessment of w...Contribution to the investigation of wind characteristics and assessment of w...
Contribution to the investigation of wind characteristics and assessment of w...Université de Dschang
 
Cv3210411055
Cv3210411055Cv3210411055
Cv3210411055IJMER
 

La actualidad más candente (20)

Poster-CIVE-OTC-v1
Poster-CIVE-OTC-v1Poster-CIVE-OTC-v1
Poster-CIVE-OTC-v1
 
Introduction geostatistic for_mineral_resources
Introduction geostatistic for_mineral_resourcesIntroduction geostatistic for_mineral_resources
Introduction geostatistic for_mineral_resources
 
Layout Optimization of Microsatellite Components Using Genetic Algorithm
Layout Optimization of Microsatellite Components Using Genetic AlgorithmLayout Optimization of Microsatellite Components Using Genetic Algorithm
Layout Optimization of Microsatellite Components Using Genetic Algorithm
 
Barber_TU2.T03_hk_mb_casa_fg_hk_FINAL.pptx
Barber_TU2.T03_hk_mb_casa_fg_hk_FINAL.pptxBarber_TU2.T03_hk_mb_casa_fg_hk_FINAL.pptx
Barber_TU2.T03_hk_mb_casa_fg_hk_FINAL.pptx
 
Hayashi masw gravity
Hayashi masw gravityHayashi masw gravity
Hayashi masw gravity
 
Effect of sub classes on the accuracy of the classified image
Effect of sub classes on the accuracy of the classified imageEffect of sub classes on the accuracy of the classified image
Effect of sub classes on the accuracy of the classified image
 
IRJET-Mapping of Mineral Zones using the Spectral Feature Fitting Method in J...
IRJET-Mapping of Mineral Zones using the Spectral Feature Fitting Method in J...IRJET-Mapping of Mineral Zones using the Spectral Feature Fitting Method in J...
IRJET-Mapping of Mineral Zones using the Spectral Feature Fitting Method in J...
 
20320130406015 2-3-4
20320130406015 2-3-420320130406015 2-3-4
20320130406015 2-3-4
 
Observations the postcorecollapse_globular_cluster_ngc_6752
Observations the postcorecollapse_globular_cluster_ngc_6752Observations the postcorecollapse_globular_cluster_ngc_6752
Observations the postcorecollapse_globular_cluster_ngc_6752
 
Th P3 09
Th P3 09Th P3 09
Th P3 09
 
Integrating_lithostatic_compression_into_velocity_models
Integrating_lithostatic_compression_into_velocity_modelsIntegrating_lithostatic_compression_into_velocity_models
Integrating_lithostatic_compression_into_velocity_models
 
Forest Change Detection in incomplete satellite images with deep neural networks
Forest Change Detection in incomplete satellite images with deep neural networksForest Change Detection in incomplete satellite images with deep neural networks
Forest Change Detection in incomplete satellite images with deep neural networks
 
Accuracy enhancement of srtm and aster dems using weight estimation regressio...
Accuracy enhancement of srtm and aster dems using weight estimation regressio...Accuracy enhancement of srtm and aster dems using weight estimation regressio...
Accuracy enhancement of srtm and aster dems using weight estimation regressio...
 
Snow tra 3d
Snow tra 3dSnow tra 3d
Snow tra 3d
 
Bump Mapping Unparametrized Surfaces on the GPU
Bump Mapping Unparametrized Surfaces on the GPUBump Mapping Unparametrized Surfaces on the GPU
Bump Mapping Unparametrized Surfaces on the GPU
 
Geological mapping using satellite images.
Geological mapping using satellite images.Geological mapping using satellite images.
Geological mapping using satellite images.
 
Final Beam Paper
Final Beam PaperFinal Beam Paper
Final Beam Paper
 
Contribution to the investigation of wind characteristics and assessment of w...
Contribution to the investigation of wind characteristics and assessment of w...Contribution to the investigation of wind characteristics and assessment of w...
Contribution to the investigation of wind characteristics and assessment of w...
 
Erfani_2016_acp
Erfani_2016_acpErfani_2016_acp
Erfani_2016_acp
 
Cv3210411055
Cv3210411055Cv3210411055
Cv3210411055
 

Similar a Fracture prediction using low coverage seismic data in area of complicated structures li yan

Delineating faults using multi-trace seismic attributes: Example from offshor...
Delineating faults using multi-trace seismic attributes: Example from offshor...Delineating faults using multi-trace seismic attributes: Example from offshor...
Delineating faults using multi-trace seismic attributes: Example from offshor...iosrjce
 
Seismic Modeling ASEG 082001 Andrew Long
Seismic Modeling ASEG 082001 Andrew LongSeismic Modeling ASEG 082001 Andrew Long
Seismic Modeling ASEG 082001 Andrew LongAndrew Long
 
Survey Planning Leading Edge 102004 Andrew Long
Survey Planning Leading Edge 102004 Andrew LongSurvey Planning Leading Edge 102004 Andrew Long
Survey Planning Leading Edge 102004 Andrew LongAndrew Long
 
Evaluation of the Sensitivity of Seismic Inversion Algorithms to Different St...
Evaluation of the Sensitivity of Seismic Inversion Algorithms to Different St...Evaluation of the Sensitivity of Seismic Inversion Algorithms to Different St...
Evaluation of the Sensitivity of Seismic Inversion Algorithms to Different St...IJERA Editor
 
CVS vs. t2 -x 2 velocity analysis
CVS vs. t2 -x 2 velocity analysisCVS vs. t2 -x 2 velocity analysis
CVS vs. t2 -x 2 velocity analysisiosrjce
 
TGS Arcis- Canada Curvature Attributes and Applications Poster
TGS Arcis- Canada Curvature Attributes and Applications PosterTGS Arcis- Canada Curvature Attributes and Applications Poster
TGS Arcis- Canada Curvature Attributes and Applications PosterTGS
 
Seismic Inversion Techniques Choice And Benefits Fb May2011
Seismic Inversion Techniques Choice And Benefits Fb May2011Seismic Inversion Techniques Choice And Benefits Fb May2011
Seismic Inversion Techniques Choice And Benefits Fb May2011Carlos Pinto
 
Seismic interpretation work flow final ppt
Seismic interpretation work flow final pptSeismic interpretation work flow final ppt
Seismic interpretation work flow final pptMuhammadJawwad28
 
inverse theory and inversion of seismic
inverse theory and inversion of seismic inverse theory and inversion of seismic
inverse theory and inversion of seismic Abdullah Abderahman
 
ShowCASE poster_Bowen_11APR2016
ShowCASE poster_Bowen_11APR2016ShowCASE poster_Bowen_11APR2016
ShowCASE poster_Bowen_11APR2016Bowen Dong
 
20110723IGARSS_ZHAO-yang.ppt
20110723IGARSS_ZHAO-yang.ppt20110723IGARSS_ZHAO-yang.ppt
20110723IGARSS_ZHAO-yang.pptgrssieee
 

Similar a Fracture prediction using low coverage seismic data in area of complicated structures li yan (20)

Delineating faults using multi-trace seismic attributes: Example from offshor...
Delineating faults using multi-trace seismic attributes: Example from offshor...Delineating faults using multi-trace seismic attributes: Example from offshor...
Delineating faults using multi-trace seismic attributes: Example from offshor...
 
Seismic Modeling ASEG 082001 Andrew Long
Seismic Modeling ASEG 082001 Andrew LongSeismic Modeling ASEG 082001 Andrew Long
Seismic Modeling ASEG 082001 Andrew Long
 
Survey Planning Leading Edge 102004 Andrew Long
Survey Planning Leading Edge 102004 Andrew LongSurvey Planning Leading Edge 102004 Andrew Long
Survey Planning Leading Edge 102004 Andrew Long
 
Evaluation of the Sensitivity of Seismic Inversion Algorithms to Different St...
Evaluation of the Sensitivity of Seismic Inversion Algorithms to Different St...Evaluation of the Sensitivity of Seismic Inversion Algorithms to Different St...
Evaluation of the Sensitivity of Seismic Inversion Algorithms to Different St...
 
Surface Wave Tomography
Surface Wave TomographySurface Wave Tomography
Surface Wave Tomography
 
TuD20203_Sepat
TuD20203_SepatTuD20203_Sepat
TuD20203_Sepat
 
CVS vs. t2 -x 2 velocity analysis
CVS vs. t2 -x 2 velocity analysisCVS vs. t2 -x 2 velocity analysis
CVS vs. t2 -x 2 velocity analysis
 
tle31050528.1
tle31050528.1tle31050528.1
tle31050528.1
 
TGS Arcis- Canada Curvature Attributes and Applications Poster
TGS Arcis- Canada Curvature Attributes and Applications PosterTGS Arcis- Canada Curvature Attributes and Applications Poster
TGS Arcis- Canada Curvature Attributes and Applications Poster
 
Seismic Inversion Techniques Choice And Benefits Fb May2011
Seismic Inversion Techniques Choice And Benefits Fb May2011Seismic Inversion Techniques Choice And Benefits Fb May2011
Seismic Inversion Techniques Choice And Benefits Fb May2011
 
E05833135
E05833135E05833135
E05833135
 
Warrp sesimic_ aghazde
Warrp sesimic_ aghazdeWarrp sesimic_ aghazde
Warrp sesimic_ aghazde
 
ASEG-PESA_GMO
ASEG-PESA_GMOASEG-PESA_GMO
ASEG-PESA_GMO
 
Seismic interpretation work flow final ppt
Seismic interpretation work flow final pptSeismic interpretation work flow final ppt
Seismic interpretation work flow final ppt
 
Principles of seismic data interpretation m.m.badawy
Principles of seismic data interpretation   m.m.badawyPrinciples of seismic data interpretation   m.m.badawy
Principles of seismic data interpretation m.m.badawy
 
inverse theory and inversion of seismic
inverse theory and inversion of seismic inverse theory and inversion of seismic
inverse theory and inversion of seismic
 
J05915457
J05915457J05915457
J05915457
 
response spectra
response spectraresponse spectra
response spectra
 
ShowCASE poster_Bowen_11APR2016
ShowCASE poster_Bowen_11APR2016ShowCASE poster_Bowen_11APR2016
ShowCASE poster_Bowen_11APR2016
 
20110723IGARSS_ZHAO-yang.ppt
20110723IGARSS_ZHAO-yang.ppt20110723IGARSS_ZHAO-yang.ppt
20110723IGARSS_ZHAO-yang.ppt
 

Último

Transposable elements in prokaryotes.ppt
Transposable elements in prokaryotes.pptTransposable elements in prokaryotes.ppt
Transposable elements in prokaryotes.pptArshadWarsi13
 
User Guide: Capricorn FLX™ Weather Station
User Guide: Capricorn FLX™ Weather StationUser Guide: Capricorn FLX™ Weather Station
User Guide: Capricorn FLX™ Weather StationColumbia Weather Systems
 
User Guide: Magellan MX™ Weather Station
User Guide: Magellan MX™ Weather StationUser Guide: Magellan MX™ Weather Station
User Guide: Magellan MX™ Weather StationColumbia Weather Systems
 
《Queensland毕业文凭-昆士兰大学毕业证成绩单》
《Queensland毕业文凭-昆士兰大学毕业证成绩单》《Queensland毕业文凭-昆士兰大学毕业证成绩单》
《Queensland毕业文凭-昆士兰大学毕业证成绩单》rnrncn29
 
Davis plaque method.pptx recombinant DNA technology
Davis plaque method.pptx recombinant DNA technologyDavis plaque method.pptx recombinant DNA technology
Davis plaque method.pptx recombinant DNA technologycaarthichand2003
 
Base editing, prime editing, Cas13 & RNA editing and organelle base editing
Base editing, prime editing, Cas13 & RNA editing and organelle base editingBase editing, prime editing, Cas13 & RNA editing and organelle base editing
Base editing, prime editing, Cas13 & RNA editing and organelle base editingNetHelix
 
Best Call Girls In Sector 29 Gurgaon❤️8860477959 EscorTs Service In 24/7 Delh...
Best Call Girls In Sector 29 Gurgaon❤️8860477959 EscorTs Service In 24/7 Delh...Best Call Girls In Sector 29 Gurgaon❤️8860477959 EscorTs Service In 24/7 Delh...
Best Call Girls In Sector 29 Gurgaon❤️8860477959 EscorTs Service In 24/7 Delh...lizamodels9
 
Good agricultural practices 3rd year bpharm. herbal drug technology .pptx
Good agricultural practices 3rd year bpharm. herbal drug technology .pptxGood agricultural practices 3rd year bpharm. herbal drug technology .pptx
Good agricultural practices 3rd year bpharm. herbal drug technology .pptxSimeonChristian
 
Pests of safflower_Binomics_Identification_Dr.UPR.pdf
Pests of safflower_Binomics_Identification_Dr.UPR.pdfPests of safflower_Binomics_Identification_Dr.UPR.pdf
Pests of safflower_Binomics_Identification_Dr.UPR.pdfPirithiRaju
 
GenBio2 - Lesson 1 - Introduction to Genetics.pptx
GenBio2 - Lesson 1 - Introduction to Genetics.pptxGenBio2 - Lesson 1 - Introduction to Genetics.pptx
GenBio2 - Lesson 1 - Introduction to Genetics.pptxBerniceCayabyab1
 
Citronella presentation SlideShare mani upadhyay
Citronella presentation SlideShare mani upadhyayCitronella presentation SlideShare mani upadhyay
Citronella presentation SlideShare mani upadhyayupadhyaymani499
 
REVISTA DE BIOLOGIA E CIÊNCIAS DA TERRA ISSN 1519-5228 - Artigo_Bioterra_V24_...
REVISTA DE BIOLOGIA E CIÊNCIAS DA TERRA ISSN 1519-5228 - Artigo_Bioterra_V24_...REVISTA DE BIOLOGIA E CIÊNCIAS DA TERRA ISSN 1519-5228 - Artigo_Bioterra_V24_...
REVISTA DE BIOLOGIA E CIÊNCIAS DA TERRA ISSN 1519-5228 - Artigo_Bioterra_V24_...Universidade Federal de Sergipe - UFS
 
Neurodevelopmental disorders according to the dsm 5 tr
Neurodevelopmental disorders according to the dsm 5 trNeurodevelopmental disorders according to the dsm 5 tr
Neurodevelopmental disorders according to the dsm 5 trssuser06f238
 
Speech, hearing, noise, intelligibility.pptx
Speech, hearing, noise, intelligibility.pptxSpeech, hearing, noise, intelligibility.pptx
Speech, hearing, noise, intelligibility.pptxpriyankatabhane
 
User Guide: Pulsar™ Weather Station (Columbia Weather Systems)
User Guide: Pulsar™ Weather Station (Columbia Weather Systems)User Guide: Pulsar™ Weather Station (Columbia Weather Systems)
User Guide: Pulsar™ Weather Station (Columbia Weather Systems)Columbia Weather Systems
 
Fertilization: Sperm and the egg—collectively called the gametes—fuse togethe...
Fertilization: Sperm and the egg—collectively called the gametes—fuse togethe...Fertilization: Sperm and the egg—collectively called the gametes—fuse togethe...
Fertilization: Sperm and the egg—collectively called the gametes—fuse togethe...D. B. S. College Kanpur
 
The dark energy paradox leads to a new structure of spacetime.pptx
The dark energy paradox leads to a new structure of spacetime.pptxThe dark energy paradox leads to a new structure of spacetime.pptx
The dark energy paradox leads to a new structure of spacetime.pptxEran Akiva Sinbar
 
Call Girls In Nihal Vihar Delhi ❤️8860477959 Looking Escorts In 24/7 Delhi NCR
Call Girls In Nihal Vihar Delhi ❤️8860477959 Looking Escorts In 24/7 Delhi NCRCall Girls In Nihal Vihar Delhi ❤️8860477959 Looking Escorts In 24/7 Delhi NCR
Call Girls In Nihal Vihar Delhi ❤️8860477959 Looking Escorts In 24/7 Delhi NCRlizamodels9
 
(9818099198) Call Girls In Noida Sector 14 (NOIDA ESCORTS)
(9818099198) Call Girls In Noida Sector 14 (NOIDA ESCORTS)(9818099198) Call Girls In Noida Sector 14 (NOIDA ESCORTS)
(9818099198) Call Girls In Noida Sector 14 (NOIDA ESCORTS)riyaescorts54
 
Pests of Bengal gram_Identification_Dr.UPR.pdf
Pests of Bengal gram_Identification_Dr.UPR.pdfPests of Bengal gram_Identification_Dr.UPR.pdf
Pests of Bengal gram_Identification_Dr.UPR.pdfPirithiRaju
 

Último (20)

Transposable elements in prokaryotes.ppt
Transposable elements in prokaryotes.pptTransposable elements in prokaryotes.ppt
Transposable elements in prokaryotes.ppt
 
User Guide: Capricorn FLX™ Weather Station
User Guide: Capricorn FLX™ Weather StationUser Guide: Capricorn FLX™ Weather Station
User Guide: Capricorn FLX™ Weather Station
 
User Guide: Magellan MX™ Weather Station
User Guide: Magellan MX™ Weather StationUser Guide: Magellan MX™ Weather Station
User Guide: Magellan MX™ Weather Station
 
《Queensland毕业文凭-昆士兰大学毕业证成绩单》
《Queensland毕业文凭-昆士兰大学毕业证成绩单》《Queensland毕业文凭-昆士兰大学毕业证成绩单》
《Queensland毕业文凭-昆士兰大学毕业证成绩单》
 
Davis plaque method.pptx recombinant DNA technology
Davis plaque method.pptx recombinant DNA technologyDavis plaque method.pptx recombinant DNA technology
Davis plaque method.pptx recombinant DNA technology
 
Base editing, prime editing, Cas13 & RNA editing and organelle base editing
Base editing, prime editing, Cas13 & RNA editing and organelle base editingBase editing, prime editing, Cas13 & RNA editing and organelle base editing
Base editing, prime editing, Cas13 & RNA editing and organelle base editing
 
Best Call Girls In Sector 29 Gurgaon❤️8860477959 EscorTs Service In 24/7 Delh...
Best Call Girls In Sector 29 Gurgaon❤️8860477959 EscorTs Service In 24/7 Delh...Best Call Girls In Sector 29 Gurgaon❤️8860477959 EscorTs Service In 24/7 Delh...
Best Call Girls In Sector 29 Gurgaon❤️8860477959 EscorTs Service In 24/7 Delh...
 
Good agricultural practices 3rd year bpharm. herbal drug technology .pptx
Good agricultural practices 3rd year bpharm. herbal drug technology .pptxGood agricultural practices 3rd year bpharm. herbal drug technology .pptx
Good agricultural practices 3rd year bpharm. herbal drug technology .pptx
 
Pests of safflower_Binomics_Identification_Dr.UPR.pdf
Pests of safflower_Binomics_Identification_Dr.UPR.pdfPests of safflower_Binomics_Identification_Dr.UPR.pdf
Pests of safflower_Binomics_Identification_Dr.UPR.pdf
 
GenBio2 - Lesson 1 - Introduction to Genetics.pptx
GenBio2 - Lesson 1 - Introduction to Genetics.pptxGenBio2 - Lesson 1 - Introduction to Genetics.pptx
GenBio2 - Lesson 1 - Introduction to Genetics.pptx
 
Citronella presentation SlideShare mani upadhyay
Citronella presentation SlideShare mani upadhyayCitronella presentation SlideShare mani upadhyay
Citronella presentation SlideShare mani upadhyay
 
REVISTA DE BIOLOGIA E CIÊNCIAS DA TERRA ISSN 1519-5228 - Artigo_Bioterra_V24_...
REVISTA DE BIOLOGIA E CIÊNCIAS DA TERRA ISSN 1519-5228 - Artigo_Bioterra_V24_...REVISTA DE BIOLOGIA E CIÊNCIAS DA TERRA ISSN 1519-5228 - Artigo_Bioterra_V24_...
REVISTA DE BIOLOGIA E CIÊNCIAS DA TERRA ISSN 1519-5228 - Artigo_Bioterra_V24_...
 
Neurodevelopmental disorders according to the dsm 5 tr
Neurodevelopmental disorders according to the dsm 5 trNeurodevelopmental disorders according to the dsm 5 tr
Neurodevelopmental disorders according to the dsm 5 tr
 
Speech, hearing, noise, intelligibility.pptx
Speech, hearing, noise, intelligibility.pptxSpeech, hearing, noise, intelligibility.pptx
Speech, hearing, noise, intelligibility.pptx
 
User Guide: Pulsar™ Weather Station (Columbia Weather Systems)
User Guide: Pulsar™ Weather Station (Columbia Weather Systems)User Guide: Pulsar™ Weather Station (Columbia Weather Systems)
User Guide: Pulsar™ Weather Station (Columbia Weather Systems)
 
Fertilization: Sperm and the egg—collectively called the gametes—fuse togethe...
Fertilization: Sperm and the egg—collectively called the gametes—fuse togethe...Fertilization: Sperm and the egg—collectively called the gametes—fuse togethe...
Fertilization: Sperm and the egg—collectively called the gametes—fuse togethe...
 
The dark energy paradox leads to a new structure of spacetime.pptx
The dark energy paradox leads to a new structure of spacetime.pptxThe dark energy paradox leads to a new structure of spacetime.pptx
The dark energy paradox leads to a new structure of spacetime.pptx
 
Call Girls In Nihal Vihar Delhi ❤️8860477959 Looking Escorts In 24/7 Delhi NCR
Call Girls In Nihal Vihar Delhi ❤️8860477959 Looking Escorts In 24/7 Delhi NCRCall Girls In Nihal Vihar Delhi ❤️8860477959 Looking Escorts In 24/7 Delhi NCR
Call Girls In Nihal Vihar Delhi ❤️8860477959 Looking Escorts In 24/7 Delhi NCR
 
(9818099198) Call Girls In Noida Sector 14 (NOIDA ESCORTS)
(9818099198) Call Girls In Noida Sector 14 (NOIDA ESCORTS)(9818099198) Call Girls In Noida Sector 14 (NOIDA ESCORTS)
(9818099198) Call Girls In Noida Sector 14 (NOIDA ESCORTS)
 
Pests of Bengal gram_Identification_Dr.UPR.pdf
Pests of Bengal gram_Identification_Dr.UPR.pdfPests of Bengal gram_Identification_Dr.UPR.pdf
Pests of Bengal gram_Identification_Dr.UPR.pdf
 

Fracture prediction using low coverage seismic data in area of complicated structures li yan

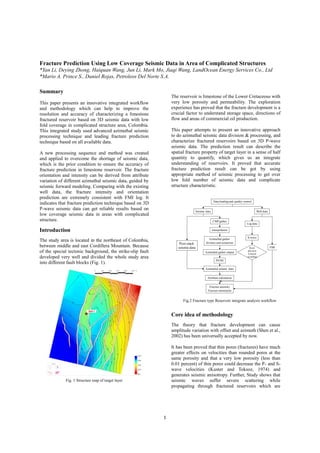
  • 1. 1 Fracture Prediction Using Low Coverage Seismic Data in Area of Complicated Structures *Yan Li, Deying Zhong, Haiquan Wang, Jun Li, Mark Mo, Jiaqi Wang, LandOcean Energy Services Co., Ltd *Mario A. Prince S., Daniel Rojas, Petroleos Del Norte S.A. Summary This paper presents an innovative integrated workflow and methodology which can help to improve the resolution and accuracy of characterizing a limestone fractured reservoir based on 3D seismic data with low fold coverage in complicated structure area, Colombia. This integrated study used advanced azimuthal seismic processing technique and leading fracture prediction technique based on all available data. A new processing sequence and method was created and applied to overcome the shortage of seismic data, which is the prior condition to ensure the accuracy of fracture prediction in limestone reservoir. The fracture orientation and intensity can be derived from attribute variation of different azimuthal seismic data, guided by seismic forward modeling. Comparing with the existing well data, the fracture intensity and orientation prediction are extremely consistent with FMI log. It indicates that fracture prediction technique based on 3D P-wave seismic data can get reliable results based on low coverage seismic data in areas with complicated structure. Introduction The study area is located in the northeast of Colombia, between middle and east Cordillera Mountain. Because of the special tectonic background, the strike-slip fault developed very well and divided the whole study area into different fault blocks (Fig. 1). The reservoir is limestone of the Lower Cretaceous with very low porosity and permeability. The exploration experience has proved that the fracture development is a crucial factor to understand storage space, directions of flow and areas of commercial oil production. This paper attempts to present an innovative approach to do azimuthal seismic data division & processing, and characterize fractured reservoirs based on 3D P-wave seismic data. The prediction result can describe the spatial fracture property of target layer in a sense of half quantity to quantify, which gives us an integrate understanding of reservoirs. It proved that accurate fracture prediction result can be got by using appropriate method of seismic processing to get over low fold number of seismic data and complicate structure characteristic. Core idea of methodology The theory that fracture development can cause amplitude variation with offset and azimuth (Shen et al., 2002) has been universally accepted by now. It has been proved that thin pores (fractures) have much greater effects on velocities than rounded pores at the same porosity and that a very low porosity (less than 0.01 percent) of thin pores could decrease the P- and S- wave velocities (Kuster and Toksoz, 1974) and generates seismic anisotropy. Further, Study shows that seismic waves suffer severe scattering while propagating through fractured reservoirs which are Fig.2 Fracture type Reservoir integrate analysis workflow flow Data loading and quality control Seismic data Well data CMPgather Azimuthal gather division and extraction Interpolation Azimuthal gather output PSTM Post-stack seismicdata Azimuthal seismic data Attribute calculation Fracture intensity Fracture orientation Log data FMI S-wave Rock physical forward modeling Fig. 1 Structure map of target layer Well 1
  • 2. Fracture Prediction Using Low Coverage Seismic Data 2 characterized vertically aligned fractures (Lynn et al., 1995). That means how to detect azimuthal amplitude variation with azimuth and relate it with fracture properties is essential issue of predicting fracture development. To identify the effects of fracture properties on the azimuthal amplitude variation, there are two questions should be figured out based on special geological condition of study area: 1) How to get precise azimuthal seismic volumes; 2) How to detect azimuthal amplitude variation and related it with fracture properties. Seismic data processing As we know that the azimuthal seismic volumes are basement of doing fracture prediction, which can affect fracture prediction result directly. So, how to process and use the 3D seismic data extensively is the essential question to ensure the accuracy of fracture prediction result. 1. Difficulties Aimed at CMP gathers of study area, there are two key difficult points should be paid attention to during azimuthal trace gathers division and processing: The offset-azimuth cross plot of the CMP gathers reveal that the fold numbers are relatively low and uneven (0~26), which can cause the energy difference or empty trace of azimuthal seismic data. The tectonic characteristics of study area are very complex (Fig.1). How to keep the accurate structure geometry feature of each different azimuthal seismic volumes during seismic processing of is another very important and tough issue. 2. Solutions In order to overcome these two key problems, a new seismic processing procedure was credited and applied (Fig. 2). The interpolation was applied to the CMP gather which can make the energy uniform in the whole area. The energy difference and empty trace problem can be solved; Three azimuthal gathers are divided reasonably and output (Fig.4); PSTM was applied to each different azimuthal CMP gathers which can ensure the structure geometry accuracy and good image; Stack and output three azimuthal PSTM datasets. 3. Results 1) Azimuthal gather division According to real condition of CMP gathers in study area (low fold number, medium offset), the CMP gathers only can be divided into three different azimuth gathers (0~65°, 60~120°, 120~180°) in offset range of 150m~2800m (Fig. 4), aiming to unify the energy of each azimuth gather. 2) PSTM In order to enhance the image quality of each azimuthal seismic volumes and keep propriety structure geometry, an advanced PSTM method named bending ray tracing Kirchhoff integral migration running on GPU/CPU Co-Parallel computing system was applied to do PSTM. Figure 5 illustrates that sections of different azimuths after PSTM show similar waveforms and geometric characteristics compared with whole stack result, which confirms that the method and parameters are applicative and reasonable to this study area. Fig. 4 Offset and Azimuth crossplot analysis Fig.3 The layout analysis result of CMP trace gathers (Color presents fold number)
  • 3. Fracture Prediction Using Low Coverage Seismic Data 3 3) Energy uniformity Energy uniformity is another very important factor to verify the azimuthal seismic data processing, because the essential of fracture prediction is just to detect the energy variation between different azimuthal seismic data. The following figures show that the amplitude energy of each azimuth seismic data is in the same range (-40~40). There are no empty traces through the whole study area. The quality of azimuth seismic data is good enough to do anisotropy detection. Fracture characterization According to the core idea of fracture prediction based on 3D P-wave seismic dataset, the most sensitive attribute has to be selected optimally on the foundation of reliable azimuthal seismic data. As to this project, the relative impedance was chosen as dynamic parameter to detect fracture development. In order to describe and understand dynamic parameter’s variation of different azimuthal seismic volumes directly and visually, an anisotropy ellipse as a vector, which can presents fracture orientation and intensity, can fitted by different values of each azimuth in same incidence angle (Fig.7). Figure 8 is 3D map of fracture density and orientation prediction result for target layer. The direction of little bars represents fracture orientation, and color represents fracture intensity. The rose diagram is statistic result of fracture orientations within a specified area. It illustrates that there are two main orientations developed, NE~SW is the primary one and NW~SE is the second one. Fig.7- Anisotropy vector calculated by ellipse fitting (The axis: orientation of anisotropy; the ratio of major and minor axis: intensity of anisotropy.) f2 f5 amplitude Incidence angle (offset) f1 f3 f4 N Fi, azimuth f2 f5 amplitude Incidence angle (offset) f1 f3 f4 N Fi, azimuth f2 f5 amplitude Incidenceangle(offset) f1 f3 f4 N Fi,azimuth a) 0˚~65˚ azimuth stack-migration section b) 60˚~120˚ azimuth stack-migration section c) 120˚~180˚ azimuth stack-migration section Fig.6 Seismic sections of different azimuth seismic data 0~65˚ azimuth stack-migration (Inline 169) section 60~120˚ azimuth stack-migration (Inline 169) section 120~180˚ azimuth stack-migration (Inline 169) section a) b) c) d) Fig. 5 Geometric property comparing with different azimuth seismic data A) PSTM volume, B) 0~65°azimuth seismic data, C) 60~120°azimuth seismic data, D) 120~180°azimuth seismic data 0~65 °azimuth seismic data 60~120°azimuth seismic data 120~180°azimuth seismic data
  • 4. Fracture Prediction Using Low Coverage Seismic Data 4 Result verification Seismic data has wider spatial coverage than the well data, while well logs have high vertical resolution. Seismic data can make up the shortcomings of well data, and well data can be taken as the prior condition to verify fracture prediction results. There are only one well has been drilled in study area and it have FMI in target layer. The comparison result of orientation from well data and seismic data can approve that the orientation from pre-stack anisotropy detection results is extremely similar with FMI data (Fig. 9), and the fracture orientations derived from seismic data can reflect the real situation of fracture development in study area. Conclusions This paper attempts to demonstrate a credible method to predict fractures by using 3D P-wave seismic data with low coverage seismic data in complicated area. It proved that through applying appropriate seismic processing method and procedure, the bad influence on accuracy of fracture prediction can be decreased as much as possible, which caused by the shortcoming of seismic data. The comparison result between prediction result and FMI log has definitely proved the accuracy and credibility of fracture intensity and orientation results. It not only indicated the application effect of fracture prediction technique based on 3D P-wave seismic data, but also proved that through appropriate processing method, the seismic data with low coverage can be used to do fracture analysis. Acknowledgements The author wishes to thank Mario Prince and Daniel Rojas of Petroleos del Norte S. A. for their great support of this project and permission to publish this article. It is appreciate that Dr. Qin Gangping revising this article. Reference Feng Shen, Xiang Zhu and Nafi Toksaz, effects of fractures on P-wave NMO Velocity and P-wave azimuthal amplitude versus offset (AVO) response, Geophysics, Vol. 67, 711-726. Ouenes, A., Richardson, S., Weiss, W, 1995, Fractured reservoir characterization and performance forecasting using geomechanics and artificial intelligence, SPE 30572 presented at the 1995 SPE Annual Technical Conference and Exhibition. Feng Shen, Sierra, J., D.R. Burns and Nafi Toksoz, 2002, Azimuthal offset-depent attributes (AVO and FVO) applied to fracture detection, Geophysics, Vol. 67, 355-364 Feng Shen, Ru-shan Wu and Jinhuai Gao, 2000, Scattering of P-S converted waves in fractured reservoirs, 70th Ann. Internat. Mtg., Soc. Expl. Geophys, 2365-2368. Yijie Zhan and Shumin Chen et al., 2010, Application of P-wave azimuthal anisotropy for fracture detection in a volcanic reservoir, SEG Denver 2010 Annual Meeting, 283-285. ChaoYang Zha, Zhirang Zhang and Deying Zhong et al,. 2004, Application of fractured reservoir modeling technology to sandstone reservoirs in Songliao Basin, China, EAGE 66th Conference & Exhibition. b) 3D view of fracture orientation at well location Fig. 9 Fracture orientation prediction result verification a) Fracture orientation statistical result comparison Fig.8 3D map of fracture intensity and orientation for target formation