Lacture 8 market research
•
1 recomendación•336 vistas

Marketing Research with statistical part.

Recomendados
Más contenido relacionado
Destacado
Destacado (20)
Similar a Lacture 8 market research
Similar a Lacture 8 market research (20)
Más de Marketing Utopia
Más de Marketing Utopia (20)
Último
Último (20)
Lacture 8 market research
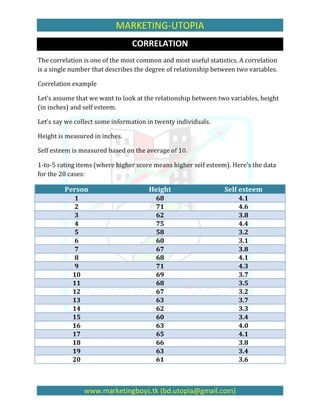
- 1. MARKETING-UTOPIA CORRELATION The correlation is one of the most common and most useful statistics. A correlation is a single number that describes the degree of relationship between two variables. Correlation example Let’s assume that we want to look at the relationship between two variables, height (in inches) and self esteem. Let’s say we collect some information in twenty individuals. Height is measured in inches. Self esteem is measured based on the average of 10. 1-to-5 rating items (where higher score means higher self esteem). Here’s the data for the 20 cases: Person Height Self esteem 1 68 4.1 2 71 4.6 3 62 3.8 4 75 4.4 5 58 3.2 6 60 3.1 7 67 3.8 8 68 4.1 9 71 4.3 10 69 3.7 11 68 3.5 12 67 3.2 13 63 3.7 14 62 3.3 15 60 3.4 16 63 4.0 17 65 4.1 18 66 3.8 19 63 3.4 20 61 3.6 www.marketingboys.tk (bd.utopia@gmail.com)
- 2. MARKETING-UTOPIA And, here is the descriptive statistics: Variable Mean St. Dev. Variance Sum Minimum Maximum Range Height 65.4 4.40574 19.4105 1308 58 75 17 Self Esteem 3.755 0.426090 0.181553 75.1 3.1 4.6 1.5 What does a “positive relationship” mean in this context? It means that, in general, higher scores on one variable tend to be paired with higher scores on the other and that lower scores on one variable tend to be paired with lower scores on the other. Calculating the correlation Now we are ready to compute the correlation value. The formula for the correlation is: r= Where: N = number of pairs of scores = Sum of the products of paired scores = Sum of x scores = Sum of y scores ^2 = sum of squared x scores ^2 = sum of squared y scores We use the symbol are to stand for the correlation. r will always be between -1.0 and +1.0. If the correlation is negative, we have a negative relationship; if it is positive the relationship is positive. Statistical measure of how well a regression line approximates real data points; an r- squired of 1.0 (100%) indicates a perfect fit. Let’s look at the data we need for the formula. Here is the original data with the other necessary columns: www.marketingboys.tk (bd.utopia@gmail.com)
- 3. MARKETING-UTOPIA Person Height (x) Self Esteem (y) x*y x*x y*y 1 68 4.1 278.8 4624 16.81 2 71 4.6 326.6 5041 21.16 3 62 3.8 235.6 3844 14.44 4 75 4.4 330 5625 19.36 5 58 3.2 185.6 3364 10.24 6 60 3.1 186 3600 9.61 7 67 3.8 254.6 4489 14.44 8 68 4.1 278.8 4424 16.81 9 71 4.3 305.3 5041 18.49 10 69 3.7 255.3 4761 13.69 11 68 3.5 238 4624 12.25 12 67 3.2 214.4 4489 10.24 13 63 3.7 233.1 3969 13.69 14 62 3.3 204.6 3844 10.89 15 60 3.4 204 3600 11.56 16 63 4.0 252 3969 16 17 65 4.1 266.5 4225 16.81 18 67 3.8 254.6 4489 14.44 19 63 3.4 214.2 3969 11.56 20 61 3.6 219.6 3721 12.96 Sum = 1308 75.1 4937.6 85912 285.45 N = 20 = 4397.6 = 1308 = 75.1 ^2 = 85912 ^2 = 285.45 Now, when we plug these values into the formula given above, we get the following Again the mathematical formula for computing r is: www.marketingboys.tk (bd.utopia@gmail.com)
- 4. MARKETING-UTOPIA r= r= r= r= r= r= r = .73 So, the correlation for our twenty cases is .73, which is a fairly strong positive relationship. I guess there is a relationship between height and self esteem, at least in this made up data! Types of correlation Positive correlation: If x and y have a strong positive linear correlation, r is close to +1. An r value of exactly +1 indicates a perfect positive fit. Positive values indicate a relationship between x and y variables such that as values for x increase, values for y also increase. www.marketingboys.tk (bd.utopia@gmail.com)