Hispanic Resource Guide 2009 10
•
4 recomendaciones•787 vistas

Ad Club of San Diego Hispanic Resource Guide

Recomendados
Recomendados
Más contenido relacionado
Similar a Hispanic Resource Guide 2009 10
Similar a Hispanic Resource Guide 2009 10 (20)
Más de National University
Más de National University (20)
Hispanic Resource Guide 2009 10
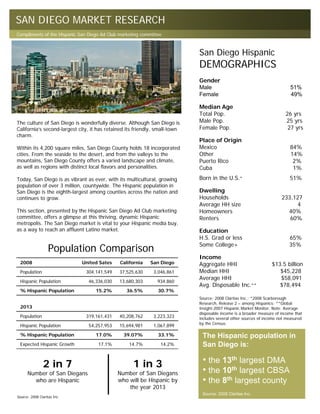
- 1. SAN DIEGO MARKET RESEARCH Compliments of the Hispanic San Diego Ad Club marketing committee San Diego Hispanic DEMOGRAPHICS Gender Male 51% Female 49% Median Age Total Pop. 26 yrs The culture of San Diego is wonderfully diverse. Although San Diego is Male Pop. 25 yrs California’s second-largest city, it has retained its friendly, small-town Female Pop. 27 yrs charm. Place of Origin Within its 4,200 square miles, San Diego County holds 18 incorporated Mexico 84% cities. From the seaside to the desert, and from the valleys to the Other 14% mountains, San Diego County offers a varied landscape and climate, Puerto Rico 2% as well as regions with distinct local flavors and personalities. Cuba 1% Today, San Diego is as vibrant as ever, with its multicultural, growing Born in the U.S.* 51% population of over 3 million, countywide. The Hispanic population in San Diego is the eighth-largest among counties across the nation and Dwelling continues to grow. Households 233,127 Average HH size 4 This section, presented by the Hispanic San Diego Ad Club marketing Homeowners 40% committee, offers a glimpse at this thriving, dynamic Hispanic Renters 60% metropolis. The San Diego market is vital to your Hispanic media buy, as a way to reach an affluent Latino market. Education H.S. Grad or less 65% Some College+ 35% Population Comparison Income 2008 United Sates California San Diego Aggregate HHI $13.5 billion Population 304,141,549 37,525,630 3,046,861 Median HHI $45,228 Average HHI $58,091 Hispanic Population 46,336,030 13,680,303 934,860 Avg. Disposable Inc.** $78,494 % Hispanic Population 15.2% 36.5% 30.7% Source: 2008 Claritas Inc.; *2008 Scarborough Research, Release 2 – among Hispanics; **Global 2013 Insight-2007 Hispanic Market Monitor. Note: Average disposable income is a broader measure of income that Population 319,161,431 40,208,762 3,223,323 includes several other sources of income not measured by the Census. Hispanic Population 54,257,953 15,694,981 1,067,899 % Hispanic Population 17.0% 39.07% 33.1% The Hispanic population in Expected Hispanic Growth 17.1% 14.7% 14.2% San Diego is: 2 in 7 1 in 3 • the 13th largest DMA Number of San Diegans Number of San Diegans • the 10th largest CBSA who are Hispanic who will be Hispanic by • the 8th largest county the year 2013 Source: 2008 Claritas Inc. Source: 2008 Claritas Inc.
- 2. SAN DIEGO MARKET RESEARCH Compliments of the Hispanic San Diego Ad Club marketing committee San Diego’s Hispanic Population Percent-Growth Geography Level = Block Group In 2013 the San Diego DMA is projected to rank 10th among the top 25 markets with a high concentration of Hispanics. San Diego’s Hispanic population percent-growth is expected to be higher than the Los Angeles (13.4%), San Francisco (11.8%) and New York (7.7%) DMAs. Locally, by the year 2013, the Hispanic population in San Diego county is expected to grow by 14.2%, making the Hispanic population in San Diego 33.1% of the total population. The top three areas with the highest expected growth are Eastlake, San Marcos and Chula Vista. Top 10 Zips Highest Expected Hispanic Pop. Growth 2008 to 2013 CITY ZIP Eastlake 91914 San Marcos 92096 Eastlake 91915 Chula Vista 91913 San Marcos 92078 Mission Valley 92108 Carlsbad 92011 Carmel Valley 92130 Rancho Bernardo 92127 SDSU 92182 Source: 2008 Claritas Inc.
- 3. SAN DIEGO MARKET RESEARCH Compliments of the Hispanic San Diego Ad Club marketing committee Employment Status 60% Non-Hispanics 50% Hispanics 49% 51% 40% 30% 37% 20% 26% 23% 10% 15% Occupation Summary 0% Unemployed Part-Time Full-Time (Among employed Hispanic adults in San Diego) Source: Qalitap Release 1, Feb-07 to Jan-08 Service 124,266 Sales and Office 103,092 Construction/Extraction/Maintenance 31% 62,827 Production/Transportation/Material Moving 54,981 44% Professional and Related Occupations 47,702 Percentage of San Percentage of San Management/Business & Financial Ops. 31,101 Diego Hispanics who Diego Hispanics who Military Specific 12,629 are employed in a are employed in a Farming/Fishing/Forestry 6,677 “white collar” position “blue collar” position Source: 2008 Scarborough Research, Release 2 Average Disposable Income Among Hispanics San Diego $78,494 Chicago $77,719 Los Angeles $77,415 Miami-Ft. Lauderdale $75,476 West Palm Beach-Ft. Pierce $74,059 Houston $73,010 Santa Barbara-Santa Maria-San Luis Obispo $72,023 Las Vegas $69,035 Atlanta $68,049 Dallas-Ft. Worth $67,334 New York City $67,230 Source: Global Insight – 2007 Hispanic Market Monitor Note: Average disposable income is a broader measure of income that includes several other sources of income not measured by the Census.
- 4. SAN DIEGO MARKET RESEARCH Compliments of the Hispanic San Diego Ad Club marketing committee During the next five years, the strong double-digit growth of Hispanic consumer spending in major categories is expected to play a key role in San Diego’s overall economic growth. Key Expenditures ($) 2007 2012 % Growth Food and Beverage 3.1 billion 4.4 billion 42% Medical Services 1.8 Billion 2.6 billion 44% Furniture and Household Items 893 million 1.3 billion 46% Clothing and Shoes 938 million 1.2 billion 39% San Diego Hispanic Buying Power Motor Vehicles and Parts 862 million 1.2 billion 39% - Projected Growth in $ Billions - Motor Gasoline and Oil 721 million 687 million 23% 2027 $65.9 Source: Global Insight – 2007 Hispanic Market Monitor 2022 $47.5 2017 $34.2 2012 $25.8 188,420 55% 39,889 2007 $18.3 Number of San Diego Percentage of San Number of San Hispanics who use Diego Hispanics who Diego Hispanics 2002 $12.3 coupons several use coupons for who download times a month groceries coupons online Source: Global Insight – 2007 Hispanic Market Monitor. Note: Average disposable income is a broader measure of income that includes several other sources of Source: 2008 Scarborough Research, Release 2 income not measured by the Census. Items San Diegans Plan to Purchase 25% 25% 22% Hispanic 20% Non-Hispanic 16% 16% 15% 15% 14% 14% 12% 12% 11% 11% 11% 10% 8% 8% 6% 7% 6% 6% 5% 5% 5% 4% 4% 2% 2% 1% 2% 0% DVD Satellite Home Pest Cell phone MP3 Game Digital HDTV Computer Major Mattress Furniture Player System Security Control (self) Player Console Camera Appliance System Service Source: 2008 Scarborough Research, Release 2
- 5. SAN DIEGO MARKET RESEARCH Compliments of the Hispanic San Diego Ad Club marketing committee San Diego Hispanics and the Internet Total % % Non- Hispanic Hispanic Hispanic San Diego DMA Adults Adults Adults Access the internet 358,320 60% 83% Own a computer 277,055 57% 84% Access the internet at home 308,884 52% 77% E-mail 289,785 49% 78% Make online purchases 233,220 39% 65% Pay bills online 168,678 28% 40% Use instant messages 103,690 18% 19% San Diego Hispanics Rank Read or contribute to blogs 40,943 7% 14% (Index Ranking among the top 25 markets) Source: 2008 Scarborough Research, Release 2 #1 • for jogging or running • for shoe shopping in the past 3 months #2 • making international calls for personal Print Radio TV Online reasons in the past month • planning to buy a video game system in the next year • purchasing baby food • taking a foreign vacation trip MEDIA CONSUMPTION Average hours per week Hispanics spend doing the following: #3 • planning to buy furniture in the next year • planning to purchase a new vehicle in the next year • reading a Spanish-language weekly Reading a newspaper Reading magazines Listening to the radio newspapers in the past 6 months • shopping at a toy store in the past year Watching TV Surfing the internet 4% #4 • planning to buy a major appliance in the next year LESS THAN 1 5% HOUR 14% 31% 33% #5 • dinning at a steak house in the past month • planning to buy a computer in the next year 11% #6 10% • owning or leasing a hybrid vehicle 1 TO 2 HOURS 24% • speaking Spanish most in the home 35% (among Hispanics) 24% 29% • planning to buy an HDTV in the next year 3 TO 6 HOURS 31% 31% #7 • purchasing music on the internet (CDs, etc) 17% • subscribing to digital cable 13% • watching novelas 26% • dinning at a sit-down restaurant in the 7 TO 13 HOURS 2% 16% 27% #8 past week 4% • listening to Spanish radio 30% • shopping at a bridal store in the past 3 MORE THAN 13 23% 9% months HOURS #10 1% 1% • purchasing organic foods 0% 5% 10% 15% 20% 25% 30% 35% #11 • accessing the internet Source: 2008 Terra.com Hispanic Syndicated Study, conducted by comScore for Terra Networks USA Source: 2008 Scarborough Research, Release 2
- 6. SAN DIEGO MARKET RESEARCH Compliments of the Hispanic San Diego Ad Club marketing committee Acculturation vs. Assimilation Acculturation is not the same as assimilation. Acculturation is the process of learning a second culture, while preserving or retaining one’s original or “home” culture. Assimilation, alternately, is the process of abandoning one’s original or “home” culture in favor of a new or “host” culture. 46% 29% San Diego’s Acculturation In San Diego, 29% of Hispanics are Bicultural, meaning they have chosen to retain their “home” culture while adopting the “host” U.S. culture. A much greater percent (46%) of San Diego Hispanics have chosen to retain their “home” culture and have either 25% rejected or not yet adopted the “host” U.S. culture. A quarter (25%) of San Diego Hispanics have chosen to abandon their “home” culture and adopt the U.S. culture completely. Hispanic Dominant Bicultural US Dominant Language Comparison Source: 2006 San Diego Hispanic Market Study Conducted by Cheskin for Enlace; 2001 Meneses Research & Associates Language Spoken in the home U.S. California San Diego English 82% 61% 67% Spanish 11% 26% 22% Other Language 7% 13% 11% Source: 2008 Claritas Inc. San Diego Hispanics Language Preference 1% 24% 18% Cultural Distinctions General Market Hispanic Market 18% • Individual – “me” • Collective - “group” 21% • Look for quality of life • Sacrifices for kids • Equality • Hierarchy 19% • Control of destiny • Fatalism • Innovation • Tradition English & Spanish equally Spanish only • Efficient • Personal • Accomplishment • Enlightenment Spanish more than English English only • Assertive • Accommodating English more than Spanish Other language Source: I. Balboa, G. Berman, Cheskin, Cultural Access Group, Dr. Hayes-Bautista, Source: 2008 Scarborough Research, Release 2 Dr. F. Korzenny, and I. Valdés Note: Language personally prefer to speak (among Hispanics)
- 7. TIJUANA MARKET RESEARCH Compliments of the Hispanic San Diego Ad Club marketing committee TIJUANA DEMOGRAPHICS Total Population 2,037,400 Age 19 or younger 44.2% 20 – 34 yrs 31.0% 35 – 54 yrs 17.9% A Market that reaches beyond borders 12 55 or older Median Age 6.9% 25 yrs million The San Diego/Tijuana region is the 3rd largest Hispanic market in Dwelling Households 370,520 the U.S. A metropolis of over 1.6 million people and located only 17 Average HH size 5 miles south of San Diego, Tijuana is Mexico’s fastest-growing city Homeowners 68% along the U.S.-Mexico border. The city of Tijuana is growing at a 6.9% annual rate, much faster than the 1.8% national growth rate Occupation for Mexico. White Collar 54% Blue Collar 36% The San Diego-Tijuana border is the busiest border in the world. Unemployed 7% More than $28 billion in goods moves across the San Diego-Tijuana Other 3% border annually in both directions. It is estimated that Mexicans Source: Instituto Nacional de Estadistica Geografía e Informatica spend $6 billion a year in San Diego County, or more than $1 of (INEGI) 2005; Instituto Nacional de Estadistica Geografia e every $8 in retail sales. Tijuana is considered one of the most Informatica (INEGI) 2002, Projections; 2000 Strategy Research Corporation-Tijuana populations estimated (Tijuana DMA: Tijuana, affluent markets in all of Mexico. Tecate & Rosarito); Hispanic Marketing Research Corporation Tijuana Source: teamnafta.com–2008; USAToday.com – 2008 87% Market Study 1990; 2000 INEGI XI Census (El Instituto Nacional de Estadistica Geografia e Informática) World’s Busiest Border Percentage of Tijuana residents who cross into the U.S. in groups of 2 Border Crossings 47.3 million or more by car Car Passengers 37,046,734 Pedestrians 9,167,496 68% Bus Passengers 1,172,087 Percentage of Tijuana residents who cross into the U.S. by car to Frequency of Visits go shopping Source: Economic Impact of Daily 19% Mexican Visitors 2005 Once a week or more 36% Tijuana Expenditures in the U.S. by Category Once a month or more 25% Several times per year 9% Clothing 46% Food & Groceries 37% Once a year 11% Appliance & Furniture 6% Source: 2007 San Ysidro/Otay Mesa Border Crossing - U.S. Department of Transportation, Research and Innovative Other 6% Technology Administration, Bureau of Transportation Statistics, Border Crossing/Entry Data; based on data from Personal Hygiene 5% U.S. Department of Homeland Security, Customs and Border Protection, OMR database; Economic Impact of Mexican Visitors, December 2005 Source: Economic Impact of Mexican Visitors, December 2005