SlideShare una empresa de Scribd logo
1 de 5
Descargar para leer sin conexión
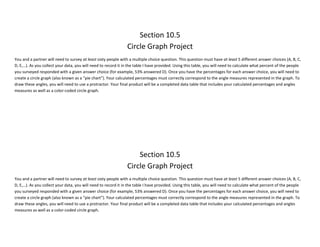
Section 10.5
                                                                Circle Graph Project
You and a partner will need to survey at least sixty people with a multiple choice question. This question must have at least 5 different answer choices (A, B, C,
D, E,…). As you collect your data, you will need to record it in the table I have provided. Using this table, you will need to calculate what percent of the people
you surveyed responded with a given answer choice (for example, 53% answered D). Once you have the percentages for each answer choice, you will need to
create a circle graph (also known as a “pie chart”). Your calculated percentages must correctly correspond to the angle measures represented in the graph. To
draw these angles, you will need to use a protractor. Your final product will be a completed data table that includes your calculated percentages and angles
measures as well as a color-coded circle graph.


                                                                    Section 10.5
                                                                Circle Graph Project
You and a partner will need to survey at least sixty people with a multiple choice question. This question must have at least 5 different answer choices (A, B, C,
D, E,…). As you collect your data, you will need to record it in the table I have provided. Using this table, you will need to calculate what percent of the people
you surveyed responded with a given answer choice (for example, 53% answered D). Once you have the percentages for each answer choice, you will need to
create a circle graph (also known as a “pie chart”). Your calculated percentages must correctly correspond to the angle measures represented in the graph. To
draw these angles, you will need to use a protractor. Your final product will be a completed data table that includes your calculated percentages and angles
measures as well as a color-coded circle graph.
Category                                            Points Possible   Points Earned and Comments
Neatness                                            5
Color coded graph, properly labeled circle graph,
legible number values, angle measures are given
Number of Responses                                 5
At least 5 different answer choices
Correctness of Percent Values in Table              15
You may round to the nearest percent value if       3 pts each
needed. Work is shown. Percent values should
add up to 100.

Correctness of Angle Measures in Table              15
You may round to the nearest degree if needed.      3pts each
Work is shown. Angle measures should add up to
360.
Circle Graph                                        10
Angles are drawn correctly in graph                 2 pts per angle


Category                                            Points Possible   Points Earned and Comments
Neatness                                            5
Color coded graph, properly labeled circle graph,
legible number values, angle measures are given
Number of Responses                                 5
At least 5 different answer choices
Correctness of Percent Values in Table              15
You may round to the nearest percent value if       3 pts each
needed. Work is shown. Percent values should
add up to 100.

Correctness of Angle Measures in Table              15
You may round to the nearest degree if needed.      3pts each
Work is shown. Angle measures should add up to
360.
Circle Graph                          10
Angles are drawn correctly in graph   2 pts per angle
Survey Question:


         Answer Choices   Tally   Number   Percent of Total   Angle Measure
     A


     B


     C


     D


     E


     Total
Ch.10.5 Circle Graph Project

Más contenido relacionado

La actualidad más candente

Week 27 on line chapter 2 plan drawing
Week 27 on line chapter 2 plan drawingWeek 27 on line chapter 2 plan drawing
Week 27 on line chapter 2 plan drawingvikkis
 
How to make a good graph
How to make a good graphHow to make a good graph
How to make a good graphrobtownsend
 
Week 2 drawing the plan moodle
Week 2 drawing the plan moodleWeek 2 drawing the plan moodle
Week 2 drawing the plan moodlevikkis
 
Scale drawings and proportions
Scale drawings and proportionsScale drawings and proportions
Scale drawings and proportionsLea Perez
 
Exponents and powers--Part1
Exponents and powers--Part1Exponents and powers--Part1
Exponents and powers--Part1chandkec
 
Visual Explanations with Graphs
Visual Explanations with GraphsVisual Explanations with Graphs
Visual Explanations with GraphsConnie Malamed
 
Module 5, Lesson 26
Module 5, Lesson 26Module 5, Lesson 26
Module 5, Lesson 26NRWEG3
 
Stem-and-Leaf Plot and Line Plot
Stem-and-Leaf Plot and Line PlotStem-and-Leaf Plot and Line Plot
Stem-and-Leaf Plot and Line Plotsheisirenebkm
 
Ch 1 & 2 Study Guide
Ch 1 & 2 Study GuideCh 1 & 2 Study Guide
Ch 1 & 2 Study GuideJames Dunn
 
Introduction to garden planning and design session 2 slides no safety content...
Introduction to garden planning and design session 2 slides no safety content...Introduction to garden planning and design session 2 slides no safety content...
Introduction to garden planning and design session 2 slides no safety content...vikkis
 
Module 4 lesson 15
Module 4 lesson 15Module 4 lesson 15
Module 4 lesson 15NRWEG3
 
Backward difference
Backward differenceBackward difference
Backward differenceshakihp
 
Intro to Graphing Data Powerpoint-7th and 8th Grade
Intro to Graphing Data Powerpoint-7th and 8th GradeIntro to Graphing Data Powerpoint-7th and 8th Grade
Intro to Graphing Data Powerpoint-7th and 8th GradeBaily OrBust
 
Measurements and sig figs
Measurements and sig figsMeasurements and sig figs
Measurements and sig figsgbsliebs2002
 
1.4 revision week session
1.4 revision week session1.4 revision week session
1.4 revision week sessionTaka Geo
 
Graphing The Weather
Graphing The WeatherGraphing The Weather
Graphing The Weatherguest439f251
 
Unit 4 review irrational numbers
Unit 4 review   irrational numbersUnit 4 review   irrational numbers
Unit 4 review irrational numbersjulienorman80065
 

La actualidad más candente (20)

Week 27 on line chapter 2 plan drawing
Week 27 on line chapter 2 plan drawingWeek 27 on line chapter 2 plan drawing
Week 27 on line chapter 2 plan drawing
 
How to make a good graph
How to make a good graphHow to make a good graph
How to make a good graph
 
Week 2 drawing the plan moodle
Week 2 drawing the plan moodleWeek 2 drawing the plan moodle
Week 2 drawing the plan moodle
 
Scale drawings and proportions
Scale drawings and proportionsScale drawings and proportions
Scale drawings and proportions
 
Exponents and powers--Part1
Exponents and powers--Part1Exponents and powers--Part1
Exponents and powers--Part1
 
Visual Explanations with Graphs
Visual Explanations with GraphsVisual Explanations with Graphs
Visual Explanations with Graphs
 
Excel-bar-graph
Excel-bar-graphExcel-bar-graph
Excel-bar-graph
 
Module 5, Lesson 26
Module 5, Lesson 26Module 5, Lesson 26
Module 5, Lesson 26
 
Scale and scale factor
Scale and scale factorScale and scale factor
Scale and scale factor
 
Stem-and-Leaf Plot and Line Plot
Stem-and-Leaf Plot and Line PlotStem-and-Leaf Plot and Line Plot
Stem-and-Leaf Plot and Line Plot
 
Ch 1 & 2 Study Guide
Ch 1 & 2 Study GuideCh 1 & 2 Study Guide
Ch 1 & 2 Study Guide
 
Introduction to garden planning and design session 2 slides no safety content...
Introduction to garden planning and design session 2 slides no safety content...Introduction to garden planning and design session 2 slides no safety content...
Introduction to garden planning and design session 2 slides no safety content...
 
Module 4 lesson 15
Module 4 lesson 15Module 4 lesson 15
Module 4 lesson 15
 
Backward difference
Backward differenceBackward difference
Backward difference
 
Intro to Graphing Data Powerpoint-7th and 8th Grade
Intro to Graphing Data Powerpoint-7th and 8th GradeIntro to Graphing Data Powerpoint-7th and 8th Grade
Intro to Graphing Data Powerpoint-7th and 8th Grade
 
Measurements and sig figs
Measurements and sig figsMeasurements and sig figs
Measurements and sig figs
 
1.4 revision week session
1.4 revision week session1.4 revision week session
1.4 revision week session
 
Graphing The Weather
Graphing The WeatherGraphing The Weather
Graphing The Weather
 
Unit 4 review irrational numbers
Unit 4 review   irrational numbersUnit 4 review   irrational numbers
Unit 4 review irrational numbers
 
Designing stained glass_lamps
Designing stained glass_lampsDesigning stained glass_lamps
Designing stained glass_lamps
 

Destacado

Katja Melnichuk books portfolio
Katja Melnichuk books portfolioKatja Melnichuk books portfolio
Katja Melnichuk books portfoliokatja_melnichuk
 
Ch.7.5 Proportional Segments in Triangles
Ch.7.5 Proportional Segments in Triangles Ch.7.5 Proportional Segments in Triangles
Ch.7.5 Proportional Segments in Triangles mdicken
 
Ch1.8 Negative Exponents and Scientific Notation.
Ch1.8 Negative Exponents and Scientific Notation.Ch1.8 Negative Exponents and Scientific Notation.
Ch1.8 Negative Exponents and Scientific Notation.mdicken
 
Intermediate Algebra: 10.4 10.6 review
Intermediate Algebra: 10.4 10.6 reviewIntermediate Algebra: 10.4 10.6 review
Intermediate Algebra: 10.4 10.6 reviewmdicken
 
Ch2.7 Data Measures of Central Tendency
Ch2.7 Data Measures of Central TendencyCh2.7 Data Measures of Central Tendency
Ch2.7 Data Measures of Central Tendencymdicken
 
Intermediate Algebra: Ch.9.1 Percents and Probabilities
Intermediate Algebra: Ch.9.1 Percents and ProbabilitiesIntermediate Algebra: Ch.9.1 Percents and Probabilities
Intermediate Algebra: Ch.9.1 Percents and Probabilitiesmdicken
 
Stella presentation
Stella presentationStella presentation
Stella presentationdawnbrooks
 
Unit 1 - Dimensions of Wellness
Unit 1 - Dimensions of WellnessUnit 1 - Dimensions of Wellness
Unit 1 - Dimensions of Wellnessdawnbrooks
 
Myth presentation
Myth presentationMyth presentation
Myth presentationdawnbrooks
 
Ch3.5 Inductive Reasoning
Ch3.5 Inductive ReasoningCh3.5 Inductive Reasoning
Ch3.5 Inductive Reasoningmdicken
 
Ch4.4 Altitudes and Medians
Ch4.4 Altitudes and MediansCh4.4 Altitudes and Medians
Ch4.4 Altitudes and Mediansmdicken
 
Ch 6.1 & 6.2 Slope of Parallel and Perpendicular Lines
Ch 6.1 & 6.2 Slope of Parallel and Perpendicular LinesCh 6.1 & 6.2 Slope of Parallel and Perpendicular Lines
Ch 6.1 & 6.2 Slope of Parallel and Perpendicular Linesmdicken
 
Ch5.5 & 5.6 3D Figures and Surface Areas
Ch5.5 & 5.6  3D Figures and Surface AreasCh5.5 & 5.6  3D Figures and Surface Areas
Ch5.5 & 5.6 3D Figures and Surface Areasmdicken
 
Ch1.3 union and intersection of sets
Ch1.3 union and intersection of setsCh1.3 union and intersection of sets
Ch1.3 union and intersection of setsmdicken
 

Destacado (15)

Katja Melnichuk books portfolio
Katja Melnichuk books portfolioKatja Melnichuk books portfolio
Katja Melnichuk books portfolio
 
Ch.7.5 Proportional Segments in Triangles
Ch.7.5 Proportional Segments in Triangles Ch.7.5 Proportional Segments in Triangles
Ch.7.5 Proportional Segments in Triangles
 
Ch1.8 Negative Exponents and Scientific Notation.
Ch1.8 Negative Exponents and Scientific Notation.Ch1.8 Negative Exponents and Scientific Notation.
Ch1.8 Negative Exponents and Scientific Notation.
 
Intermediate Algebra: 10.4 10.6 review
Intermediate Algebra: 10.4 10.6 reviewIntermediate Algebra: 10.4 10.6 review
Intermediate Algebra: 10.4 10.6 review
 
Ch2.7 Data Measures of Central Tendency
Ch2.7 Data Measures of Central TendencyCh2.7 Data Measures of Central Tendency
Ch2.7 Data Measures of Central Tendency
 
Intermediate Algebra: Ch.9.1 Percents and Probabilities
Intermediate Algebra: Ch.9.1 Percents and ProbabilitiesIntermediate Algebra: Ch.9.1 Percents and Probabilities
Intermediate Algebra: Ch.9.1 Percents and Probabilities
 
Stella presentation
Stella presentationStella presentation
Stella presentation
 
Unit 1 - Dimensions of Wellness
Unit 1 - Dimensions of WellnessUnit 1 - Dimensions of Wellness
Unit 1 - Dimensions of Wellness
 
Myth presentation
Myth presentationMyth presentation
Myth presentation
 
10.6
10.610.6
10.6
 
Ch3.5 Inductive Reasoning
Ch3.5 Inductive ReasoningCh3.5 Inductive Reasoning
Ch3.5 Inductive Reasoning
 
Ch4.4 Altitudes and Medians
Ch4.4 Altitudes and MediansCh4.4 Altitudes and Medians
Ch4.4 Altitudes and Medians
 
Ch 6.1 & 6.2 Slope of Parallel and Perpendicular Lines
Ch 6.1 & 6.2 Slope of Parallel and Perpendicular LinesCh 6.1 & 6.2 Slope of Parallel and Perpendicular Lines
Ch 6.1 & 6.2 Slope of Parallel and Perpendicular Lines
 
Ch5.5 & 5.6 3D Figures and Surface Areas
Ch5.5 & 5.6  3D Figures and Surface AreasCh5.5 & 5.6  3D Figures and Surface Areas
Ch5.5 & 5.6 3D Figures and Surface Areas
 
Ch1.3 union and intersection of sets
Ch1.3 union and intersection of setsCh1.3 union and intersection of sets
Ch1.3 union and intersection of sets
 

Similar a Ch.10.5 Circle Graph Project

Hierarchical graphic organizer
Hierarchical graphic organizerHierarchical graphic organizer
Hierarchical graphic organizerMartinEduSanchez
 
Hierarchical graphic organizer
Hierarchical graphic organizerHierarchical graphic organizer
Hierarchical graphic organizerMartinEduSanchez
 
Coordinate graphing project transformations
Coordinate graphing project  transformationsCoordinate graphing project  transformations
Coordinate graphing project transformationsEducation1st
 
Evaluation and optimization of variables using response surface methodology
Evaluation and optimization of variables using response surface methodologyEvaluation and optimization of variables using response surface methodology
Evaluation and optimization of variables using response surface methodologyMohammed Abdullah Issa
 
Math objective.pptx
Math objective.pptxMath objective.pptx
Math objective.pptxumar107208
 
Quantitative techniques in business
Quantitative techniques in businessQuantitative techniques in business
Quantitative techniques in businesssameer sheikh
 
TID Chapter 5 Introduction To Charts And Graph
TID Chapter 5 Introduction To Charts And GraphTID Chapter 5 Introduction To Charts And Graph
TID Chapter 5 Introduction To Charts And GraphWanBK Leo
 
Cr #7 with answer key
Cr #7 with answer keyCr #7 with answer key
Cr #7 with answer keymlabuski
 
4-types-of-graphs.pptx
4-types-of-graphs.pptx4-types-of-graphs.pptx
4-types-of-graphs.pptxMJGamboa2
 
How to combine interpolation and regression graphs in R
How to combine interpolation and regression graphs in RHow to combine interpolation and regression graphs in R
How to combine interpolation and regression graphs in RDougLoqa
 
PowerPoint & chart
PowerPoint & chartPowerPoint & chart
PowerPoint & chartJAIDEVPAUL
 
Proportion
ProportionProportion
Proportiontvierra
 

Similar a Ch.10.5 Circle Graph Project (20)

Charts
ChartsCharts
Charts
 
Hierarchical graphic organizer
Hierarchical graphic organizerHierarchical graphic organizer
Hierarchical graphic organizer
 
Hierarchical graphic organizer
Hierarchical graphic organizerHierarchical graphic organizer
Hierarchical graphic organizer
 
Coordinate graphing project transformations
Coordinate graphing project  transformationsCoordinate graphing project  transformations
Coordinate graphing project transformations
 
Evaluation and optimization of variables using response surface methodology
Evaluation and optimization of variables using response surface methodologyEvaluation and optimization of variables using response surface methodology
Evaluation and optimization of variables using response surface methodology
 
Maths glossary
Maths glossary Maths glossary
Maths glossary
 
Unit 5
Unit 5Unit 5
Unit 5
 
Math objective.pptx
Math objective.pptxMath objective.pptx
Math objective.pptx
 
Quantitative techniques in business
Quantitative techniques in businessQuantitative techniques in business
Quantitative techniques in business
 
TID Chapter 5 Introduction To Charts And Graph
TID Chapter 5 Introduction To Charts And GraphTID Chapter 5 Introduction To Charts And Graph
TID Chapter 5 Introduction To Charts And Graph
 
Cr #7
Cr #7Cr #7
Cr #7
 
6.1g
6.1g6.1g
6.1g
 
6.1g
6.1g6.1g
6.1g
 
Cr #7 with answer key
Cr #7 with answer keyCr #7 with answer key
Cr #7 with answer key
 
4-types-of-graphs.pptx
4-types-of-graphs.pptx4-types-of-graphs.pptx
4-types-of-graphs.pptx
 
How to combine interpolation and regression graphs in R
How to combine interpolation and regression graphs in RHow to combine interpolation and regression graphs in R
How to combine interpolation and regression graphs in R
 
Z score
Z scoreZ score
Z score
 
PowerPoint & chart
PowerPoint & chartPowerPoint & chart
PowerPoint & chart
 
4 1 ratio
4 1 ratio4 1 ratio
4 1 ratio
 
Proportion
ProportionProportion
Proportion
 

Más de mdicken

Intermediate Algebra: 10.5
Intermediate Algebra: 10.5Intermediate Algebra: 10.5
Intermediate Algebra: 10.5mdicken
 
Intermediate Algebra: 10.4
Intermediate Algebra: 10.4Intermediate Algebra: 10.4
Intermediate Algebra: 10.4mdicken
 
Intermediate Algebra: 10.3
Intermediate Algebra: 10.3Intermediate Algebra: 10.3
Intermediate Algebra: 10.3mdicken
 
Intermediate Algebra: 10.2
Intermediate Algebra: 10.2Intermediate Algebra: 10.2
Intermediate Algebra: 10.2mdicken
 
Intermediate Algebra: 10.1
Intermediate Algebra: 10.1Intermediate Algebra: 10.1
Intermediate Algebra: 10.1mdicken
 
Intermediate Algebra: Ch. 10.1 10.3
Intermediate Algebra: Ch. 10.1 10.3Intermediate Algebra: Ch. 10.1 10.3
Intermediate Algebra: Ch. 10.1 10.3mdicken
 
Intermediate Algebra: Presentation Rubric
Intermediate Algebra: Presentation RubricIntermediate Algebra: Presentation Rubric
Intermediate Algebra: Presentation Rubricmdicken
 
Ch.14.4 Graph Manipulations
Ch.14.4 Graph ManipulationsCh.14.4 Graph Manipulations
Ch.14.4 Graph Manipulationsmdicken
 
Ch.8.8 Profits
Ch.8.8 ProfitsCh.8.8 Profits
Ch.8.8 Profitsmdicken
 
Ch.8.7 Reflections
Ch.8.7 ReflectionsCh.8.7 Reflections
Ch.8.7 Reflectionsmdicken
 
Ch.8.6 Matrix Multiplication
Ch.8.6 Matrix MultiplicationCh.8.6 Matrix Multiplication
Ch.8.6 Matrix Multiplicationmdicken
 
Ch.8.5 Matrix Operations
Ch.8.5 Matrix OperationsCh.8.5 Matrix Operations
Ch.8.5 Matrix Operationsmdicken
 
Ch.14.3 Graphing Functions
Ch.14.3 Graphing FunctionsCh.14.3 Graphing Functions
Ch.14.3 Graphing Functionsmdicken
 
Ch14.2 Book Examples
Ch14.2 Book ExamplesCh14.2 Book Examples
Ch14.2 Book Examplesmdicken
 
Ch.14.1 Trigonometric Functions
Ch.14.1 Trigonometric FunctionsCh.14.1 Trigonometric Functions
Ch.14.1 Trigonometric Functionsmdicken
 
Ch 12 Review Key
Ch 12 Review KeyCh 12 Review Key
Ch 12 Review Keymdicken
 
Ch.12.5 Quadratic Formula
Ch.12.5 Quadratic FormulaCh.12.5 Quadratic Formula
Ch.12.5 Quadratic Formulamdicken
 
Ch.12.1 12.3 Graphing Parabolas
Ch.12.1 12.3 Graphing ParabolasCh.12.1 12.3 Graphing Parabolas
Ch.12.1 12.3 Graphing Parabolasmdicken
 
Ch.11.9 Factoring Trinomials
Ch.11.9 Factoring TrinomialsCh.11.9 Factoring Trinomials
Ch.11.9 Factoring Trinomialsmdicken
 
Ch.11.6 Special Factoring Patterns
Ch.11.6 Special Factoring PatternsCh.11.6 Special Factoring Patterns
Ch.11.6 Special Factoring Patternsmdicken
 

Más de mdicken (20)

Intermediate Algebra: 10.5
Intermediate Algebra: 10.5Intermediate Algebra: 10.5
Intermediate Algebra: 10.5
 
Intermediate Algebra: 10.4
Intermediate Algebra: 10.4Intermediate Algebra: 10.4
Intermediate Algebra: 10.4
 
Intermediate Algebra: 10.3
Intermediate Algebra: 10.3Intermediate Algebra: 10.3
Intermediate Algebra: 10.3
 
Intermediate Algebra: 10.2
Intermediate Algebra: 10.2Intermediate Algebra: 10.2
Intermediate Algebra: 10.2
 
Intermediate Algebra: 10.1
Intermediate Algebra: 10.1Intermediate Algebra: 10.1
Intermediate Algebra: 10.1
 
Intermediate Algebra: Ch. 10.1 10.3
Intermediate Algebra: Ch. 10.1 10.3Intermediate Algebra: Ch. 10.1 10.3
Intermediate Algebra: Ch. 10.1 10.3
 
Intermediate Algebra: Presentation Rubric
Intermediate Algebra: Presentation RubricIntermediate Algebra: Presentation Rubric
Intermediate Algebra: Presentation Rubric
 
Ch.14.4 Graph Manipulations
Ch.14.4 Graph ManipulationsCh.14.4 Graph Manipulations
Ch.14.4 Graph Manipulations
 
Ch.8.8 Profits
Ch.8.8 ProfitsCh.8.8 Profits
Ch.8.8 Profits
 
Ch.8.7 Reflections
Ch.8.7 ReflectionsCh.8.7 Reflections
Ch.8.7 Reflections
 
Ch.8.6 Matrix Multiplication
Ch.8.6 Matrix MultiplicationCh.8.6 Matrix Multiplication
Ch.8.6 Matrix Multiplication
 
Ch.8.5 Matrix Operations
Ch.8.5 Matrix OperationsCh.8.5 Matrix Operations
Ch.8.5 Matrix Operations
 
Ch.14.3 Graphing Functions
Ch.14.3 Graphing FunctionsCh.14.3 Graphing Functions
Ch.14.3 Graphing Functions
 
Ch14.2 Book Examples
Ch14.2 Book ExamplesCh14.2 Book Examples
Ch14.2 Book Examples
 
Ch.14.1 Trigonometric Functions
Ch.14.1 Trigonometric FunctionsCh.14.1 Trigonometric Functions
Ch.14.1 Trigonometric Functions
 
Ch 12 Review Key
Ch 12 Review KeyCh 12 Review Key
Ch 12 Review Key
 
Ch.12.5 Quadratic Formula
Ch.12.5 Quadratic FormulaCh.12.5 Quadratic Formula
Ch.12.5 Quadratic Formula
 
Ch.12.1 12.3 Graphing Parabolas
Ch.12.1 12.3 Graphing ParabolasCh.12.1 12.3 Graphing Parabolas
Ch.12.1 12.3 Graphing Parabolas
 
Ch.11.9 Factoring Trinomials
Ch.11.9 Factoring TrinomialsCh.11.9 Factoring Trinomials
Ch.11.9 Factoring Trinomials
 
Ch.11.6 Special Factoring Patterns
Ch.11.6 Special Factoring PatternsCh.11.6 Special Factoring Patterns
Ch.11.6 Special Factoring Patterns
 

Último

GenCyber Cyber Security Day Presentation
GenCyber Cyber Security Day PresentationGenCyber Cyber Security Day Presentation
GenCyber Cyber Security Day PresentationMichael W. Hawkins
 
🐬 The future of MySQL is Postgres 🐘
🐬  The future of MySQL is Postgres   🐘🐬  The future of MySQL is Postgres   🐘
🐬 The future of MySQL is Postgres 🐘RTylerCroy
 
CNv6 Instructor Chapter 6 Quality of Service
CNv6 Instructor Chapter 6 Quality of ServiceCNv6 Instructor Chapter 6 Quality of Service
CNv6 Instructor Chapter 6 Quality of Servicegiselly40
 
TrustArc Webinar - Stay Ahead of US State Data Privacy Law Developments
TrustArc Webinar - Stay Ahead of US State Data Privacy Law DevelopmentsTrustArc Webinar - Stay Ahead of US State Data Privacy Law Developments
TrustArc Webinar - Stay Ahead of US State Data Privacy Law DevelopmentsTrustArc
 
Finology Group – Insurtech Innovation Award 2024
Finology Group – Insurtech Innovation Award 2024Finology Group – Insurtech Innovation Award 2024
Finology Group – Insurtech Innovation Award 2024The Digital Insurer
 
08448380779 Call Girls In Diplomatic Enclave Women Seeking Men
08448380779 Call Girls In Diplomatic Enclave Women Seeking Men08448380779 Call Girls In Diplomatic Enclave Women Seeking Men
08448380779 Call Girls In Diplomatic Enclave Women Seeking MenDelhi Call girls
 
A Call to Action for Generative AI in 2024
A Call to Action for Generative AI in 2024A Call to Action for Generative AI in 2024
A Call to Action for Generative AI in 2024Results
 
Mastering MySQL Database Architecture: Deep Dive into MySQL Shell and MySQL R...
Mastering MySQL Database Architecture: Deep Dive into MySQL Shell and MySQL R...Mastering MySQL Database Architecture: Deep Dive into MySQL Shell and MySQL R...
Mastering MySQL Database Architecture: Deep Dive into MySQL Shell and MySQL R...Miguel Araújo
 
A Year of the Servo Reboot: Where Are We Now?
A Year of the Servo Reboot: Where Are We Now?A Year of the Servo Reboot: Where Are We Now?
A Year of the Servo Reboot: Where Are We Now?Igalia
 
What Are The Drone Anti-jamming Systems Technology?
What Are The Drone Anti-jamming Systems Technology?What Are The Drone Anti-jamming Systems Technology?
What Are The Drone Anti-jamming Systems Technology?Antenna Manufacturer Coco
 
Boost PC performance: How more available memory can improve productivity
Boost PC performance: How more available memory can improve productivityBoost PC performance: How more available memory can improve productivity
Boost PC performance: How more available memory can improve productivityPrincipled Technologies
 
Breaking the Kubernetes Kill Chain: Host Path Mount
Breaking the Kubernetes Kill Chain: Host Path MountBreaking the Kubernetes Kill Chain: Host Path Mount
Breaking the Kubernetes Kill Chain: Host Path MountPuma Security, LLC
 
Powerful Google developer tools for immediate impact! (2023-24 C)
Powerful Google developer tools for immediate impact! (2023-24 C)Powerful Google developer tools for immediate impact! (2023-24 C)
Powerful Google developer tools for immediate impact! (2023-24 C)wesley chun
 
The Codex of Business Writing Software for Real-World Solutions 2.pptx
The Codex of Business Writing Software for Real-World Solutions 2.pptxThe Codex of Business Writing Software for Real-World Solutions 2.pptx
The Codex of Business Writing Software for Real-World Solutions 2.pptxMalak Abu Hammad
 
2024: Domino Containers - The Next Step. News from the Domino Container commu...
2024: Domino Containers - The Next Step. News from the Domino Container commu...2024: Domino Containers - The Next Step. News from the Domino Container commu...
2024: Domino Containers - The Next Step. News from the Domino Container commu...Martijn de Jong
 
04-2024-HHUG-Sales-and-Marketing-Alignment.pptx
04-2024-HHUG-Sales-and-Marketing-Alignment.pptx04-2024-HHUG-Sales-and-Marketing-Alignment.pptx
04-2024-HHUG-Sales-and-Marketing-Alignment.pptxHampshireHUG
 
08448380779 Call Girls In Greater Kailash - I Women Seeking Men
08448380779 Call Girls In Greater Kailash - I Women Seeking Men08448380779 Call Girls In Greater Kailash - I Women Seeking Men
08448380779 Call Girls In Greater Kailash - I Women Seeking MenDelhi Call girls
 
Apidays Singapore 2024 - Building Digital Trust in a Digital Economy by Veron...
Apidays Singapore 2024 - Building Digital Trust in a Digital Economy by Veron...Apidays Singapore 2024 - Building Digital Trust in a Digital Economy by Veron...
Apidays Singapore 2024 - Building Digital Trust in a Digital Economy by Veron...apidays
 
How to convert PDF to text with Nanonets
How to convert PDF to text with NanonetsHow to convert PDF to text with Nanonets
How to convert PDF to text with Nanonetsnaman860154
 
The 7 Things I Know About Cyber Security After 25 Years | April 2024
The 7 Things I Know About Cyber Security After 25 Years | April 2024The 7 Things I Know About Cyber Security After 25 Years | April 2024
The 7 Things I Know About Cyber Security After 25 Years | April 2024Rafal Los
 

Último (20)

GenCyber Cyber Security Day Presentation
GenCyber Cyber Security Day PresentationGenCyber Cyber Security Day Presentation
GenCyber Cyber Security Day Presentation
 
🐬 The future of MySQL is Postgres 🐘
🐬  The future of MySQL is Postgres   🐘🐬  The future of MySQL is Postgres   🐘
🐬 The future of MySQL is Postgres 🐘
 
CNv6 Instructor Chapter 6 Quality of Service
CNv6 Instructor Chapter 6 Quality of ServiceCNv6 Instructor Chapter 6 Quality of Service
CNv6 Instructor Chapter 6 Quality of Service
 
TrustArc Webinar - Stay Ahead of US State Data Privacy Law Developments
TrustArc Webinar - Stay Ahead of US State Data Privacy Law DevelopmentsTrustArc Webinar - Stay Ahead of US State Data Privacy Law Developments
TrustArc Webinar - Stay Ahead of US State Data Privacy Law Developments
 
Finology Group – Insurtech Innovation Award 2024
Finology Group – Insurtech Innovation Award 2024Finology Group – Insurtech Innovation Award 2024
Finology Group – Insurtech Innovation Award 2024
 
08448380779 Call Girls In Diplomatic Enclave Women Seeking Men
08448380779 Call Girls In Diplomatic Enclave Women Seeking Men08448380779 Call Girls In Diplomatic Enclave Women Seeking Men
08448380779 Call Girls In Diplomatic Enclave Women Seeking Men
 
A Call to Action for Generative AI in 2024
A Call to Action for Generative AI in 2024A Call to Action for Generative AI in 2024
A Call to Action for Generative AI in 2024
 
Mastering MySQL Database Architecture: Deep Dive into MySQL Shell and MySQL R...
Mastering MySQL Database Architecture: Deep Dive into MySQL Shell and MySQL R...Mastering MySQL Database Architecture: Deep Dive into MySQL Shell and MySQL R...
Mastering MySQL Database Architecture: Deep Dive into MySQL Shell and MySQL R...
 
A Year of the Servo Reboot: Where Are We Now?
A Year of the Servo Reboot: Where Are We Now?A Year of the Servo Reboot: Where Are We Now?
A Year of the Servo Reboot: Where Are We Now?
 
What Are The Drone Anti-jamming Systems Technology?
What Are The Drone Anti-jamming Systems Technology?What Are The Drone Anti-jamming Systems Technology?
What Are The Drone Anti-jamming Systems Technology?
 
Boost PC performance: How more available memory can improve productivity
Boost PC performance: How more available memory can improve productivityBoost PC performance: How more available memory can improve productivity
Boost PC performance: How more available memory can improve productivity
 
Breaking the Kubernetes Kill Chain: Host Path Mount
Breaking the Kubernetes Kill Chain: Host Path MountBreaking the Kubernetes Kill Chain: Host Path Mount
Breaking the Kubernetes Kill Chain: Host Path Mount
 
Powerful Google developer tools for immediate impact! (2023-24 C)
Powerful Google developer tools for immediate impact! (2023-24 C)Powerful Google developer tools for immediate impact! (2023-24 C)
Powerful Google developer tools for immediate impact! (2023-24 C)
 
The Codex of Business Writing Software for Real-World Solutions 2.pptx
The Codex of Business Writing Software for Real-World Solutions 2.pptxThe Codex of Business Writing Software for Real-World Solutions 2.pptx
The Codex of Business Writing Software for Real-World Solutions 2.pptx
 
2024: Domino Containers - The Next Step. News from the Domino Container commu...
2024: Domino Containers - The Next Step. News from the Domino Container commu...2024: Domino Containers - The Next Step. News from the Domino Container commu...
2024: Domino Containers - The Next Step. News from the Domino Container commu...
 
04-2024-HHUG-Sales-and-Marketing-Alignment.pptx
04-2024-HHUG-Sales-and-Marketing-Alignment.pptx04-2024-HHUG-Sales-and-Marketing-Alignment.pptx
04-2024-HHUG-Sales-and-Marketing-Alignment.pptx
 
08448380779 Call Girls In Greater Kailash - I Women Seeking Men
08448380779 Call Girls In Greater Kailash - I Women Seeking Men08448380779 Call Girls In Greater Kailash - I Women Seeking Men
08448380779 Call Girls In Greater Kailash - I Women Seeking Men
 
Apidays Singapore 2024 - Building Digital Trust in a Digital Economy by Veron...
Apidays Singapore 2024 - Building Digital Trust in a Digital Economy by Veron...Apidays Singapore 2024 - Building Digital Trust in a Digital Economy by Veron...
Apidays Singapore 2024 - Building Digital Trust in a Digital Economy by Veron...
 
How to convert PDF to text with Nanonets
How to convert PDF to text with NanonetsHow to convert PDF to text with Nanonets
How to convert PDF to text with Nanonets
 
The 7 Things I Know About Cyber Security After 25 Years | April 2024
The 7 Things I Know About Cyber Security After 25 Years | April 2024The 7 Things I Know About Cyber Security After 25 Years | April 2024
The 7 Things I Know About Cyber Security After 25 Years | April 2024
 

Ch.10.5 Circle Graph Project

  • 1. Section 10.5 Circle Graph Project You and a partner will need to survey at least sixty people with a multiple choice question. This question must have at least 5 different answer choices (A, B, C, D, E,…). As you collect your data, you will need to record it in the table I have provided. Using this table, you will need to calculate what percent of the people you surveyed responded with a given answer choice (for example, 53% answered D). Once you have the percentages for each answer choice, you will need to create a circle graph (also known as a “pie chart”). Your calculated percentages must correctly correspond to the angle measures represented in the graph. To draw these angles, you will need to use a protractor. Your final product will be a completed data table that includes your calculated percentages and angles measures as well as a color-coded circle graph. Section 10.5 Circle Graph Project You and a partner will need to survey at least sixty people with a multiple choice question. This question must have at least 5 different answer choices (A, B, C, D, E,…). As you collect your data, you will need to record it in the table I have provided. Using this table, you will need to calculate what percent of the people you surveyed responded with a given answer choice (for example, 53% answered D). Once you have the percentages for each answer choice, you will need to create a circle graph (also known as a “pie chart”). Your calculated percentages must correctly correspond to the angle measures represented in the graph. To draw these angles, you will need to use a protractor. Your final product will be a completed data table that includes your calculated percentages and angles measures as well as a color-coded circle graph.
  • 2. Category Points Possible Points Earned and Comments Neatness 5 Color coded graph, properly labeled circle graph, legible number values, angle measures are given Number of Responses 5 At least 5 different answer choices Correctness of Percent Values in Table 15 You may round to the nearest percent value if 3 pts each needed. Work is shown. Percent values should add up to 100. Correctness of Angle Measures in Table 15 You may round to the nearest degree if needed. 3pts each Work is shown. Angle measures should add up to 360. Circle Graph 10 Angles are drawn correctly in graph 2 pts per angle Category Points Possible Points Earned and Comments Neatness 5 Color coded graph, properly labeled circle graph, legible number values, angle measures are given Number of Responses 5 At least 5 different answer choices Correctness of Percent Values in Table 15 You may round to the nearest percent value if 3 pts each needed. Work is shown. Percent values should add up to 100. Correctness of Angle Measures in Table 15 You may round to the nearest degree if needed. 3pts each Work is shown. Angle measures should add up to 360.
  • 3. Circle Graph 10 Angles are drawn correctly in graph 2 pts per angle
  • 4. Survey Question: Answer Choices Tally Number Percent of Total Angle Measure A B C D E Total