An Information-Theoretic Approach for Clonal Selection Algorithms
Immunological Multiple Sequence Alignments
1. Nucleic Acids Research Advance Access published November 10, 2010
Nucleic Acids Research, 2010, 1–13
doi:10.1093/nar/gkq1052
Protein multiple sequence alignment by hybrid
bio-inspired algorithms
Vincenzo Cutello, Giuseppe Nicosia*, Mario Pavone and Igor Prizzi
Department of Mathematics and Computer Science, University of Catania, Viale A. Doria 6, 95125 Catania, Italy
Received March 10, 2010; Revised September 16, 2010; Accepted October 13, 2010
ABSTRACT INTRODUCTION
This article presents an immune inspired algorithm The most effective method to discover structural or func-
to tackle the Multiple Sequence Alignment (MSA) tional similarities among proteins is to compare multiple
problem. MSA is one of the most important tasks proteins of various ‘phylogenetic’ distances. Multiple
in biological sequence analysis. Although this Sequence Alignment (MSA) of proteins plays a central
Downloaded from nar.oxfordjournals.org by guest on November 13, 2010
role in molecular biology, as it can unravel the constraints
paper focuses on protein alignments, most of the
imposed by structure and function on the evolution
discussion and methodology may also be applied of whole protein families (1). MSA has been used
to DNA alignments. The problem of finding the for building phylogenetic trees, for the identification of
multiple alignment was investigated in the study by conserved motifs, to find diagnostic patterns families,
Bonizzoni and Vedova and Wang and Jiang, and and to predict secondary and tertiary structures of RNA
proved to be a NP-hard (non-deterministic and protein sequences (2).
polynomial-time hard) problem. The presented In order to be able to align a set of biosequences, a
algorithm, called Immunological Multiple Sequence reliable objective function is needed to quantify the per-
Alignment Algorithm (IMSA), incorporates two new formance of an alignment in terms of its biological plausi-
strategies to create the initial population and bility through an analytical or computational function (3).
specific ad hoc mutation operators. It is based on The alignment quality is often the limiting factor in the
analysis of biological sequences. Defining an appropriate
the ‘weighted sum of pairs’ as objective function,
and efficient objective function can remove this limitation,
to evaluate a given candidate alignment. IMSA but this is still an active research field (3,4). A simple ob-
was tested using both classical benchmarks of jective function used for this purpose is the ‘weighted
BALIBASE (versions 1.0, 2.0 and 3.0), and experi- sums-of-pairs’ (SP) with affine gap penalties (5). In this
mental results indicate that it is comparable with approach, each sequence receives a weight, which is pro-
state-of-the-art multiple alignment algorithms, in portional to the amount of independent information it
terms of quality of alignments, weighted Sums-of- contains (6), and the cost of the multiple alignment is
Pairs (SP) and Column Score (CS) values. The main equal to the sum of the costs of all the weighted
novelty of IMSA is its ability to generate more than pairwise substitutions. Since the knowledge about the
a single suboptimal alignment, for every MSA structure of the search space for MSA is not enough to
instance; this behaviour is due to the stochastic guide an effective search towards the best solution, several
‘Evolutionary Algorithms’ (EAs) have been developed to
nature of the algorithm and of the populations
solve such a problem and, in general, computational
evolved during the convergence process. This biology problems (7,8). Evolutionary algorithms are
feature will help the decision maker to assess and applied to problems where exact methods and heuristics
select a biologically relevant multiple sequence are not available, or where the size of the search space
alignment. Finally, the designed algorithm can be precludes an exhaustive search for the optimal solution.
used as a local search procedure to properly In this research work, we tackle MSA instances using a
explore promising alignments of the search space. new Immunological Algorithm (IA), inspired by the
*To whom correspondence should be addressed. Tel: +39 095 738 3030; Fax: +30 095 330094; Email: nicosia@dmi.unict.it
The authors wish it to be known that, in their opinion the second and third authors should be regarded as joint First Authors.
ß The Author(s) 2010. Published by Oxford University Press.
This is an Open Access article distributed under the terms of the Creative Commons Attribution Non-Commercial License (http://creativecommons.org/licenses/
by-nc/2.5), which permits unrestricted non-commercial use, distribution, and reproduction in any medium, provided the original work is properly cited.
2. 2 Nucleic Acids Research, 2010
Clonal Selection Principle (9–11), called Immunological of view; and WSS is the ‘weighted symbol score’,
Multiple Sequence Alignment (IMSA). IMSA incorpor- defined as
ates specific perturbation operators for MSA of amino
^
acid sequences, and the results obtained show that the X
‘
^ ^
WSSðSi ,Sj Þ ¼ Wij Mð^i,k ,^j,k Þ:
s s
designed IA is comparable to the state-of-the-art MSA
k¼1
algorithms. It is important to highlight that IMSA is
able to produce several optimal or suboptimal align- Sequence weights are determined by constructing a guide
ments, comparable to those obtained by other approaches. tree from known sequences.
This is the crucial feature of EAs, in general, and of For multiple protein sequence alignment, the weighted
the algorithm, IMSA, used in this research work in SP with affine gap penalties is a popular objective function
particular. included in many MSA packages. The problem of finding
The article is structured as follows: multiple se- the multiple alignment was investigated in (12) and (13),
quence alignment of proteins section presents a short and proved to be a NP-hard problem. Results presented
description on the features of multiple sequence align- in (13) were proven using a ‘nonmetric scoring matrix’
ment, including also the objective function used in this (zero distance between two identical residues), which
work; state-of-the-art methods for MSA section presents is different from the actual scoring matrices used in mul-
instead a brief review on the best methods for MSA tiple alignments. Moreover, in (12) the authors improved
problem; in IMSA section we describe the proposed the previous investigation by using a fixed metric score
Downloaded from nar.oxfordjournals.org by guest on November 13, 2010
IMSA, focusing on the description of its features and matrix through a reduction from the ‘Minimum Vertex
its operators; results section presents a large set of ex- Cover’, a classical NP complete problem (14).
periments, comparing IMSA with the state-of-the-art al-
gorithms on all three versions of BALIBASE; final
remarks section emphasizes the conclusions on the use STATE-OF-THE-ART METHODS FOR MSA
of IMSA algorithm in multiple sequence alignment Although the most popular method to solve MSA is based
problems. on ‘Dynamic Programming’ (DP) (15), which guarantees a
mathematically optimal alignment, this method is limited
to a small number of short sequences. Such a limitation is
due to the growth of the problem space with the number
MULTIPLE SEQUENCE ALIGNMENTS of sequences and the length of the proteins. To overcome
OF PROTEINS
this problem, several heuristic approaches (16–18) based
One of the most important and popular computational on different strategies have been developed to effectively
sequence analysis problems is to determine whether two, deal with the complexity of the problem (3,19). All current
or more, biological sequences have common subse- methodologies of multiple alignment are heuristic and can
quences. However, two primary issues need to be faced be classified under three main categories: ‘progressive
to check the similarities between two or more sequences: alignments’, ‘exact algorithms’ and ‘iterative alignments’.
the choice of an objective function to assess the biological
alignment quality, and the design of an effective algorithm Progressive alignments
to optimize the given objective function. Progressive alignment is the most commonly used
The alignment quality is often the limiting factor in bio- approach to multiple sequence alignment. This kind of
logical analyses of amino acid sequences; defining a proper methodology works by aligning the closest sequences
objective function is a crucial task. Our research work first, and then the more distant ones are added.
focuses on the key issue of designing an efficient algorithm Although this approach has the advantage of being
to find optimal and suboptimal alignments of protein se- simple and very fast, it does not guarantee any level of
quences. Of course, the technique is also applicable to optimization. Therefore, the main drawback of this
DNA alignments. The most popular objective function approach is that once a sequence has been aligned it
used to measure the biological alignment quality is the cannot be modified, even if it produces possible conflicts
weighted SP with affine gap penalties (5), where each with subsequently added sequences. Alignment programs
sequence receives a weight that is proportional to the based on this approach are MULTALIGN (20), PILEUP
amount of independent information it contains (6) and (21), CLUSTALX (22), CLUSTALW (23), T-COFFEE
the cost of the multiple alignment is equal to the sum of (24). Their strategy is to align sequences in a progressive
the costs of all the weighted pairwise substitutions. manner, by using either a consistency-based or a SP
Formally it is defined as: objective function in order to minimize possible errors.
! In contrast to the previous approach, PIMA (25), which
XX
nÀ1 n X
n is also a progressive alignment method, uses local dynamic
max ^ ^
WSSðSi ,Sj Þ+ ^
AGPSðSi Þ ð1Þ programming to align only the most conserved motifs.
^
S i¼1 j¼i+1 i¼1 In the default setting, it makes use of two align-
ment methods, ‘maximum linkage’ (ML_PIMA) and ‘se-
where n is the number of the sequences; AGPS is quential branching’ (SB_PIMA), to decide the order of
the ‘affine gap penalty function’ that is one of the alignments. Sequence and Secondary-structure Profiles
most appropriate penalty score from a biological point Enhanced Multiple alignment (SPEM) (26) combines a
3. Nucleic Acids Research, 2010 3
sequence-based method with a consistency-based refine- IMSA: IMMUNOLOGICAL MULTIPLE SEQUENCE
ment for pairwise alignment, and is also a progressive al- ALIGNMENT
gorithm for multiple alignment. PROBCONS (27) is a Clonal Selection Algorithms (CSA) are a special class of
practical tool for progressive protein multiple sequence IA, which are inspired by the clonal selection principle
alignment that is based on ‘probabilistic consistency’, (10,11) to produce effective mechanisms for search and
which is a novel scoring function for measuring alignment optimization (40–42). The proposed algorithm, called
quality. It also incorporates an iterative refinement IMSA, is population-based, where each individual of the
process. population is a ‘candidate solution’ belonging to the
fitness landscape of a given MSA instance. This work
Exact algorithms presents an extended and more robust version of IMSA
Exact algorithms were developed to align multiple se- than those proposed in (7,43). The algorithm has been
quences simultaneously (28). They are high-quality heur- tested on a larger test case (BALIBASE versions 1.0, 2.0
istics able to produce alignments near to optimal ones, but and 3.0), and several metrics have been used to assess the
they are limited to handle a small number of sequences. quality both of alignments and of comparisons.
Thus, high memory requirement, high computational IMSA incorporates two different strategies to create the
effort and limitation on the number of sequences limit initial population, as well as new hypermutation oper-
their usage. A new divide and conquer algorithm (29) ators, which are specific operators for solving protein
MSA that insert or remove gaps in the given sequences.
Downloaded from nar.oxfordjournals.org by guest on November 13, 2010
extending their capabilities was developed.
Gap columns, which have been matched, are moved to the
end of the sequence. The remaining elements (i.e. amino
Iterative alignments
acids) and existing gaps are shifted into the freed space.
Iterative alignment methods depend on algorithms able Like the classical IAS, IMSA considers antigens (Ags)
to produce an alignment and to refine it through a series and B cells. An Ag is a given MSA instance, i.e. the
of iterations until no further improvements can be made. protein sequences to align, while B cells are a population,
They are based on the idea that the solution to a given a multi-set, of alignments that have solved (or
problem can be computed by modifying an already approximated) the initial problem (44–46).
existing ‘suboptimal solution’. DIALIGN (30,31), a In tackling the MSA, Ags and B cells are represented by
consistency-based algorithm, attempts to use local infor- a sequence matrix. Let Æ = {A,R,N,D,C,E,Q,G,H,I,
mation in order to guide a global alignment, i.e. to con- L,K,M,F,P,S,T,W,Y,V} be the twenty amino acid
struct multiple alignments based on segment-to-segment alphabet, and let S = {S1,S2, . . . , Sn} be the set of n ! 2
comparisons—such segments are incorporated into a sequences (strings), with respective lengths ‘1,‘2, . . . , ‘n,
multiple alignment by using an iterative procedure. such that Si 2 Æ*. An Ag, hence, is represented by a
PRRP (32) optimizes a progressive global alignment by matrix of n rows and max{‘1,. . .,‘n} columns (see the
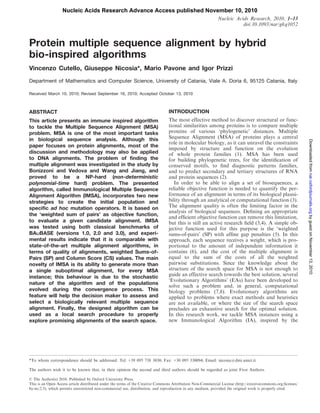
iteratively dividing the sequences into two groups, which upper matrix of Figure 1). Each B cell is represented
are realigned by using a global group-to-group alignment by an (n  ‘) binary matrix (see the middle matrix of
algorithm. HMMT (33) a Hidden Markov Model (HMM) Figure 1), where ‘ ¼ ð3 Â maxf‘1 , . . . ,‘n gÞ, with 3 a fixed
2 2
using simulated annealing and dynamic programming parameter, ‘ is a maximum string length in order to
for correctly sampling suboptimal multiple alignments properly manage a given problem instance. In such a
0
is better able to find global optima than other matrix, an entry sij ¼ 1 indicates that the corresponding
HMM methods. Multiple sequence comparison by amino acid of the sequence Si will be locate in the j-th
0
log-expectation (MUSCLE) (34) is based on similar position; otherwise, if sij ¼ 0, a gap will be placed in the
0
strategies as those used by PRRP. Sequence Alignment j-th position of Si . The overall representation of genotype
by Genetic Algorithm (SAGA) (35) is a genetic algorithm and phenotype is showed in Figure 1.
based on the Consistency Objective Function For
alignmEnt Evaluation COFFEE objective function (36).
Initial population strategies
The approach described in SAGA has received consider-
able interest in the evolutionary computation community. To create the initial population of d candidate alignments,
PRofile ALIgNEment (PRALINE) (37) begins with a we used two different strategies. The first strategy is based
pre-processing of the sequences to align. As of today, it on the use of random ‘offsets’ to shift the initial sequences
also provides a choice of seven different secondary struc- and it is called ‘random_initialization’. Such a model
ture prediction programs that can be used either individu- works by randomly choosing an offset in the range
ally or in combination as a consensus for integrating [0,(‘–‘i)] with uniform distribution, and then by shifting
structural information into the alignment process. the sequence Si offset towards the right side of the row i of
In general, EAS tend to be suitable tools for MSA (8,38) the current B cell.
and can be used to effectively search large solution spaces. Figure 2 shows an example of the scheme used to ini-
However, they spend a lot of time in gradually improving tialize the population by using random ‘offsets’. Plot (b)
potential solutions before reaching a solution that is com- represents how such process works using different ‘offset’
parable to those obtained by deterministic methodologies values, considering the initial multiple sequence alignment
(39). This is due to a random initialization of the candi- shown in plot (a). The second way to initialize the popu-
date alignments. lation is to use the CLUSTALW algorithm (23).
4. 4 Nucleic Acids Research, 2010
However, to increase the diversity of the initial popula- Cloning and hypermutation operators
tion, we have used both strategies together; a percentage The clonal expansion process in IMSA was represented by
of the initial alignments were generated by CLUSTALW, the classical ‘static cloning operator’, which clones each B
while the remaining ones were determined by the cre- cell dup times, thus producing an intermediate population
ation of random offsets. We called this new method P(clo) of Nc = d  dup B cells, where d is the population
‘CLUSTALW-seeding’. All results shown in this article size. The basic mutation processes that are considered
were obtained using 80% of the initial population in pairwise alignment and multiple sequence alignments
generated by CLUSTALW, and the remaining 20% by are as follows: ‘substitutions’ that change sequences of
‘random_initialization’ (i.e. using the random ‘offsets’). amino acids, as well as ‘insertions’ and ‘deletions’, which
We have used ‘CLUSTALW-seeding’ to initialize the respectively, add and remove amino-acids and/or gaps
population of alignments, to avoid that the algorithm (19). In a first version of the algorithm, the classical
could be trapped in local optima during the early phases hypermutation and hypermacromutation operators
of the convergence process. (47–49) were used; the first operator flips a bit, by using
a number of mutations that is inversely proportional to
the fitness function value, whereas hypermacromutation
simply swaps two randomly chosen subsequences.
However, the first experiments produced non-optimal
Downloaded from nar.oxfordjournals.org by guest on November 13, 2010
alignments leading to frequent premature convergence
Protein Sequences:
to a local optimum during the convergence process.
P1: C P T F L R F E G G V P Y V T T K T D T D Therefore, we developed two new hypermutation oper-
P2: L I P I N S T Q S N I G N V S M Y T D T L S Q ators, specifically for multiple sequence alignments
P3: G L E T R V V Q A E R F F D T H S D
that insert or remove gaps in the sequences. Such oper-
ators are the ‘GAP operator’ and the ‘BlockShuffling
P4: M S V E S F L G R S G C I H E S V D D I V D
operator’. Both of them act on the cloned B cells (P(clo))
Candidate Solutions
P5: H T S V D T I S D and generate two new populations, P(gap) and P(block),
Genotype
respectively.
GAP Sequences:
GAP operator. The ‘GAP operator’ is based on two pro-
G1: 1 1 1 1 1 1 1 1 1 1 1 1 1 1 1 1 1 1 1 1 0 0 0 1 cedures: one inserts adjacent sequences of gaps (InsGap)
G2: 1 1 1 1 1 1 1 1 1 1 1 1 1 1 1 1 1 1 1 1 1 1 0 1 while the other one removes them (RemGap). Initially, the
G3: 0 0 0 0 0 1 1 1 1 1 1 1 1 1 1 1 1 1 1 1 1 1 0 1
GAP operator chooses which procedure to apply by using
a random uniform distribution, i.e. it is randomly decided
G4: 0 1 1 1 1 1 1 1 1 1 1 1 1 1 1 1 1 1 1 1 1 1 0 1
whether a number of adjacent gaps is to be inserted into
G5: 0 0 0 0 0 0 0 0 0 0 0 0 0 0 1 1 1 1 1 1 1 1 0 1 the sequences or removed. Then a number k, in the range
[1,h], of (adjacent) gaps is randomly chosen, where h
represents a percentage of the length of the alignments
(‘). Results shown in this article were obtained by
setting ¼ 2% Á ‘:
Phenotype: The INSGAP PROCEDURE can be summarized by the fol-
S1: C P T F L R F E G G V P Y V T T K T D T − − − D lowing steps. First, split the n sequences in z groups;
S2: L I P I N S T Q S N I G N V S M Y T D T L S − Q
from experimental results, z = 2 is the best setting for
the performance of IMSA. Hence, we can rephrase this
Phenotype
S3: − − − − − G L E T R V V Q A E R F F D T H S − D
step as follows: randomly choose a value m 2 [1,n], and
S4: − M S V E S F L G R S G C I H E S V D D I V − D split the n sequences into two groups, respectively, from se-
S5: − − − − − − − − − − − − − − H T S V D T I S − D quence 1 to m, and from (m+1) to n. Second, randomly
choose two integer values x and y, in such a way that k
Figure 1. How the genotype and the phenotype are represented in
IMSA.
adjacent gaps are inserted beginning from column x for
the first group, and from column y for the second one.
(a) (b)
VFGKTLGAGVVRQAKNTEK offset: 4 −−−−VFGKT LGAGVVRQAKN TEK−−−−−
IFGRTLGAGVVRQKILQ offset: 2 −−IFGRT LGAGVVRQK I LQ− −−−−−−−−
VKEDIGVGVCKRCIHKKCATIDK offset: 4 −−−−VKE DI GVGVCKRC I HKKCATIDK−
PKEILGRGVVRRCIHKCPTA offset: 5 −−−−− PK EI LGRGVVRRC IHKCPTA−−−
Figure 2. Initialize the population by ‘offsets’.
5. Nucleic Acids Research, 2010 5
Third, choose a random shift direction D for the subse- (2) BlockSplitHor divides the blocks into two parts,
quence, either left or right. Finally, insert the k adjacent upper and lower, and shifts only one part, chosen
gaps in the respective positions for each sequence, and randomly;
then shift the subsequence to the D direction. During (3) BlockSplitVer randomly chooses a column in the
the shifting phase, it is possible to miss n ! 0 bits with block, divides the block into two sides (left and
value 1 (it is similar to the left and right shift operators right) and shifts only one side, randomly chosen as
in the C programming language family); in this case, well.
INSGAP will select n bits with value 0, different from the
k gaps inserted, and they will be flipped to 1, thereby Figure 4 summarizes the three operators: the upper
rebuilding the correct sequence. plot shows the BlockMove operator; the middle plot
The REMGAP PROCEDURE simply removes k adjacent depicts how BlockSplitHor works, by choosing the 4th
gaps and moves the subsequences towards a randomly row to divide the block into two parts; and the lower
chosen direction either left or right. Figure 3 shows how plot shows the BlockSplitVer operator performing a
the ‘GAP operator’ works. In particular, it shows the right shift.
INSGAP [plot (a) of Figure 3] and REMGAP [plot (b) After the two hypermutation operators are used, IMSA
of Figure 3] procedures. They, respectively have the pur- moves the only-gap columns (columns made of gaps only)
pose to insert and remove adjacent gaps into the proposed to the right end side of the matrix, with the STRIP_
alignment. In plot (a), an example of the INSGAP pro- GAPS(P(*)) function. This function is always applied
Downloaded from nar.oxfordjournals.org by guest on November 13, 2010
cedure is shown using k = 3, m = 2 and the right shift before the fitness function is evaluated. Figure 5 shows
direction. an example of how STRIP_GAPS(P(*)) function works.
BlockShuffling operator. The BLOCKSHUFFLING OPERATOR
is based on the block definition, and it moves aligned
blocks to the left or to the right; a block is selected
in each alignment starting from a random point in a
sequence. IMSA includes three different approaches:
(1) BlockMove moves whole blocks, either to the left or
to the right;
Figure 4. The BlockShuffling operator has the purpose to shift blocks
of amino acids or gaps. The upper plot shows the BlockMove operator;
Figure 3. The GAP operator has the purpose to insert, by the InsGap the middle plot depicts how BlockSplitHor works, by choosing the 4th
procedure (a), or to remove, by the ‘RemGap’ procedure (b), adjacent row to divide the block into two parts; the lower plot shows the
gaps into the proposed alignment. BlockSplitVer operator performing a right shift.
−KYV FG−− −T ETAV−−L I − −− −− KYVFG −T ETAVL I − −−−−−−−−−
−LG− − − −− SQARK−−− LLK−Q−− LG− − − SQARK− LLKQ−−−−−−−−
B cell
−YEC I H −−C− ATAV−−K− L−Q−− YEC I HC− ATAVK− LQ−−−−−−−−
−−Y EHK −− −P TAVK−−SF S −− −− −Y EHK −P TAVKSF S −−−−−−−−−
before Strip_Gaps after Strip_Gaps
Figure 5. The Strip_Gaps operator moves only-gap columns to the right end side of the matrix.
6. 6 Nucleic Acids Research, 2010
Table 1. Pseudo-code of IMSA RESULTS
To evaluate the biological alignment quality produced by
IMSA, we have used the classical benchmark BALIBASE
versions 1.0, 2.0 and 3.0. Benchmark Alignment
dataBASE (BALIBASE) is a database that has been de-
veloped to evaluate and to compare multiple alignment
programs containing high-quality (manually refined)
multiple sequence alignments. BALIBASE version 1.0
(50) contains 141 reference alignments, and is divided
into five hierarchical reference sets, containing 12 repre-
sentative alignments. For each alignment the ‘core blocks’
are defined; they are the regions that can be reliably
aligned and represent 58% of residues in the alignments.
The remaining 42% are in ambiguous regions which
cannot be reliably aligned. Reference 1 contains align-
ments of equidistant sequences with similar length; refer-
ence 2 contains alignments of a family (closely related
Downloaded from nar.oxfordjournals.org by guest on November 13, 2010
sequences with 25% identity) and three orphan se-
quences with 20% identity; reference 3 consists of up to
four families with 25% identity between any two se-
quences from different families; and references 4 and 5
contain sequences with large N/C-terminal extensions or
Aging and (k + j)-selection operators internal insertions. For an extensive explanation of all ref-
erences please refer to (4). The second version, BALIBASE
The aging operator eliminates the old B cells in the popu- v.2.0 (51), includes all alignments present in the first
lations P(t), P(gap) and P(block), with the goal to maintain version, where all alignments have been verified
high diversity in order to avoid premature convergence. and ‘hand-constructed’ from the literature (http://
The number of generations that a B cell can remain bips.u-strasbg.fr/fr/Products/Databases/BAliBASE2/).
into the populations is determined by parameter tB; Moreover, test alignments are scored with respect to
when a B cell reaches tB+1 generations, it is erased BALIBASE core blocks, regions for which reliable align-
from the current population, even if it is a good candidate ments are known to exist (27). Finally, the third version of
solution (Static-Aging). The only exception is made for the
BALIBASE (52) contains 218 alignments, and it is
best B cell present in the current population; we call this
organized in the same way as the version 2.0, but with a
scheme Elitist-Static-Aging.
larger sequence collections that contain more outlier se-
A new population P(t+1) of d B cells is obtained
quences (http://www-bio3d-igbmc.u-strasbg.fr/balibase/).
by selecting the best survivors from the aging operator,
using the (m+)-selection operator (with m = d and One interesting and favourable feature of IMSA is its
= 2Nc). The selection operator reduces an offspring B ability to produce several optimal or suboptimal align-
cell population of size ! to a new parent population ments. In this way, IMSA gives to biologists more tools
of size m; it guarantees monotonicity in the evolution to better study and understand the protein sequences.
dynamics. Figure 6 shows two different alignments produced by
Table 1 (see Section IMSA: Immunological Multiple IMSA for the BALIBASE instances on Reference 1: 1ad2,
Sequence Alignment) shows the pseudo-code of the in the left plot, and 1aym3, in the right one. The left plot in
Figure 6 shows two different alignments with the same SP
IMSA algorithm, where the function Evaluate(P)
and CS scores, while in the right plot two alignments are
computes the SP objective function [see Equation (1) in
shown with different SP and CS scores. CS represents the
Section] of each B cell in the population P [i.e. the Column Score, which is defined as the number of correctly
proposed alignment quality, using Equation (1)]. For aligned columns on the generated alignments, divided by
our research purpose the used objective function was the the total number of aligned columns in the core blocks of
‘weighted’ SP with affine gap penalties (5). The functions the reference alignment. In both plots, the different align-
COMPUTE_WEIGHTS() and NORMALIZE_WEIGHTS(), respect- ment subsequences are highlighted in grey.
ively, compute and normalize the weights of the sequences The left plot in Figure 7 shows two different alignments
by using a rooted tree, which is used for the evaluation of produced by IMSA for the 1hfh instance of Reference 1,
the objective function. with different SP and CS score values, while the right plot
Finally, with Tmax we indicate the maximum number of shows three alignments with the same SP and CS score for
fitness function evaluations that we have used as termin- the 2mhr instance of Reference 1. We highlight the differ-
ation criterion of the optimization process. The variable ence between the alignments in grey.
Fitness Function Evaluations (FFE) computes the number Finally, Figures 8 and 9 show different alignments
of the objective function evaluations, after immunological produced by IMSA on instances of Reference 3 (1uky)
operators are applied. and Reference 5 (1qpg).
7. Nucleic Acids Research, 2010 7
Downloaded from nar.oxfordjournals.org by guest on November 13, 2010
Figure 6. Optimal and suboptimal alignments produced by IMSA for Figure 7. Optimal and suboptimal alignments produced by IMSA for
the 1ad2 (left) and 1aym3 (right) instances of Reference 1 (V2). The SP 1hfh (left) and 2mhr (right) instances of Reference 1 (V2 and V3,
and CS scores show the difference between the two alignments (it is respectively). The left plot shows two different alignments for the
highlighted in grey). 1hfh instance with different SP and CS score values, while the right
plot shows three different optimal alignments for the 2mhr instance.
The differences between the alignments are highlighted in grey.
8. 8 Nucleic Acids Research, 2010
Downloaded from nar.oxfordjournals.org by guest on November 13, 2010
Figure 8. Optimal and suboptimal alignments produced by IMSA for Figure 9. Optimal and suboptimal alignments for the 1qpg instance
the 1uky instance for Reference 3 (medium). We show the SP and CS of Reference 5.
scores. The difference between the two alignments is highlighted in
grey.
9. Nucleic Acids Research, 2010 9
These figures highlight the capability of IMSA to The values obtained help to raise the overall score,
produce optimal and suboptimal alignments. Thanks to which is higher compared with the results published by
this ability, more tools are available to the biologists the Bioinformatics platform of Strasbourg (http://bips.u-
to better understand and study the proteins evolution strasbg.fr/en/presentation.php). In Table 3, we show the
process. ability of IMSA to improve and to refine the best initial
The results shown in all experiments were obtained alignment produced by CLUSTALW-seeding on the
by using the following experimental protocol: population BALIBASE v.1.0 benchmark. In all references, IMSA
size d = 10, cloning parameter dup = 1, age parameter improves the initial alignments, producing an overall
tB = 33, maximum number of objective function evalu- average SP score 10.5 times better than the initial ones.
ations Tmax = 2 Â 105 and 50 independent runs. The par- By this feature, IMSA yields an effective refinement
ameter values have been selected inspecting the literature methodology.
on the clonal selection algorithms (45,49,53). Moreover, In Table 4, we show the average SP and CS values
we used the following substitution matrices: obtained by the tools on every group of instances belong-
ing to the BALIBASE v.2.0 database. The table also rep-
. BLOSUM45 for Ref1v1 and Ref 3, with resents the accuracies of the produced alignments. The
GOP ¼ 14, GEP ¼ 2; values used in Table 4 are drawn from data reported in
. BLOSUM62 for Ref1v2, Ref 2, Ref 4 and Ref 5, with (26). IMSA obtains comparable values of SP score on
GOP ¼ 11, GEP ¼ 1; Reference 1, Reference 2 and Reference 5—despite the
Downloaded from nar.oxfordjournals.org by guest on November 13, 2010
. BLOSUM80 for Ref1v3, with GOP ¼ 10, GEP ¼ 1: fact that the value obtained on Reference 3 is the fourth
Table 2 shows the average SP score obtained by best value. This table also shows that future efforts should
the described alignment tools on every instance set of focus on improving the CS metric. The last column of the
BALIBASE v.1.0. As it can be seen in this table, IMSA Table 4 (see Results Section) indicates the average number
performs well on the Reference 2 and Reference 3 sets. of the improved alignments (NIA), with respect to the
initial population produced by CLUSTALW-seeding,
which was described in Section.
To further evaluate the real performance of the
Table 2. SP values given by several methods on the BALIBASE v.1.0
proposed IMSA, Table 5 reports how many best align-
benchmark (http://bips.u-strasbg.fr/fr/Products/Databases/BAliBASE/)
for multiple sequence alignment
ments are produced by IMSA, with respect to
CLUSTALW-seeding. We present the average SP and
Aligner Ref. 1 Ref. 2 Ref. 3 Ref. 4 Ref. 5 Overall CS values obtained on each reference belonging to
(82) (23) (12) (12) (12) (141) the BALIBASE v.2.0 database. Even in this version of
DIALIGN (30) 77.7 38.4 28.8 85.2 83.6 62.7
CLUSTALX (22) 85.3 58.3 40.8 36.0 70.6 58.2
PILEUP8 (21) 82.2 42.8 33.3 59.1 63.8 56.2 Table 3. Performance of IMSA with respect to the initial population
ML_PIMA (25) 80.1 37.1 34.0 70.4 57.2 55.7 P(t = 0) produced by CLUSTALW-seeding, on BALIBASE v.1.0
PRRP (34) 86.6 54.0 48.7 13.4 70.0 54.5 benchmark
SAGA (35) 70.3 58.6 46.2 28.8 64.1 53.6
SB_PIMA (25) 81.1 37.9 24.4 72.6 50.7 53.3 Aligner Ref. 1 Ref. 2 Ref. 3 Ref. 4 Ref. 5 Overall
MULTALIGN (20) 82.3 51.6 27.6 29.2 62.7 50.6 (82) (23) (12) (12) (12) (141)
IMSA 80.7 88.6 77.4 70.2 82.0 (79.7±5.6)
(78.47,80.92) CLUSTALW-seeding 77.1 63.1 63.7 65.7 78.4 69.2
IMSA 80.7 88.6 77.4 70.2 82.0 79.7
For IMSA we report mean and standard deviation (m±s), and confi- Improvement +3.6 +25.5 +13.7 +4.5 +3.6 +10.5
dence interval, about 95% of the data are within 1.96 SD of the mean.
Best results are in boldface. Best results are in boldface.
Table 4. Alignment accuracies given by several methods on the BALIBASE v.2.0 benchmark (http://bips.u-strasbg.fr/fr/Products/Databases/
BAliBASE2/) for multiple sequence alignment (26)
Aligner Ref. 1 (82) Ref. 2 (23) Ref. 3 (12) Ref. 4 (12) Ref. 5 (12) Overall (141) NIA
SP CS SP CS SP CS SP CS SP CS SP CS
SPEM (26) 90.8 83.9 93.4 57.3 81.4 56.9 97.4 90.8 97.4 92.3 91.5 78.6 1
MUSCLE (34) 90.3 84.7 64.4 60.9 82.2 61.9 91.8 74.8 98.1 92.1 91.0 78.7 1
PROBCONS (27) 90.0 83.9 94.0 62.6 82.3 63.1 90.9 73.6 98.1 91.7 90.8 78.4 1
T-COFFEE (24) 86.8 80.0 93.9 58.5 76.7 54.8 92.1 76.8 94.6 86.1 88.2 74.6 1
PRALINE (37) 90.4 83.9 94.0 61.0 76.4 55.8 79.9 53.9 81.8 68.6 88.2 73.9 1
CLUSTALW (23) 85.8 78.3 93.3 59.3 72.3 48.1 83.4 62.3 85.8 63.4 85.7 70.0 1
IMSA 83.4 65.3 92.1 41.3 78.6 36.2 73.0 31.9 83.6 56.9 (82.1±9.2) (46.3±6.9) 52
(79.55,84.64) (44.38,48.21)
BALIBASE v.2.0 (51) includes all alignments present in the first version, where all alignments have been verified and ‘hand-constructed’ from the
literature. Test alignments are scored with respect to BALIBASE core blocks, regions for which reliable alignments are known to exist (27).
For IMSA, we report mean and standard deviation (m±s), and confidence interval, about 95% of the data are within 1.96 SD of the mean.
Best results are in boldface.
10. 10 Nucleic Acids Research, 2010
BALIBASE, IMSA produces better alignments than the In Table 8 is shown the comparison among IMSA and
initial ones, thus again showing its refinement ability. some of the most popular alignment algorithms, as
For sake of completeness, we tested IMSA with two PROBCONS (27), PCMA (54), MUSCLE (34), CLUSTALW
immunological aligners, ClonAlign and AIS. Tables 6 (23) and COBALT (55). These experiments have been
and 7 show the comparisons. In both cases, IMSA out- done on BALIBASE version 3.0 (52), which containing
performs ClonAlign and AIS. 218 alignments, and it is organized in the same way as
the version 2.0, but with larger sequence collections that
contain more outlier sequences. Tables 8 shows ‘quality
assessment score (Q-score)’, that is an average over all
Table 5. Performance of IMSA with respect to the initial population datasets in the benchmark, and the relative running time.
P(t = 0) produced by CLUSTALW-seeding, on BALIBASE v.2.0 bench-
Looking the results with respect the Q-score column is
mark BALIBASE v.2.0 (51) includes all alignments present in the
first version, where all alignments have been verified and
possible to see as IMSA is comparable with all alignment
‘hand-constructed’ from the literature (27) algorithms, showing the third best performance, behind
only to PROBCONS and PCMA algorithms, although it
Aligner CLUSTALW- IMSA Improvement seems to be slower from a running time point of view.
seeding In fact, as shown in the last column of the same table,
SP CS SP CS SP CS IMSA presents a larger running time with respect to the
other algorithms, except PROBCONS whose running time is
Downloaded from nar.oxfordjournals.org by guest on November 13, 2010
Ref. 1 (82) 77.1 64.9 83.4 65.3 +6.3 +0.4 the highest.
Ref. 2 (23) 85.5 40.7 92.1 41.3 +6.6 +0.6 Tables 9 and 10 show, respectively, the average SP and
Ref. 3 (12) 68.3 34.9 78.6 36.2 +10.3 +1.3
Ref. 4 (12) 64.1 29.9 73.0 31.9 +8.9 +2.0
Total-Column (TC) scores, obtained on BALIBASE 3.0
Ref. 5 (12) 73.8 51.4 83.6 56.9 +9.8 +5.5 data set. For this kind of comparison, as done in (56),
Overall (141) 73.7 44.3 82.1 46.3 +8.4 +2 we labelled the five categories of the BALIBASE bench-
mark as RV1*, RV20, . . . , RV50, where the first class is
Best results are in boldface.
further divided into two subcategories (RV11 and RV12).
Also on this kind of comparisons is possible to see as
IMSA provides comparable alignments in term of quality,
as determined via the used score metrics.
Table 6. IMSA versus AIS (57), each entry reports the SP value
Instance Sequences BW (58) AIS (58) IMSA
1aboA 5 0.622 0.646 0.759
451c 5 0.321 0.538 0.773 Table 8. IMSA versus COBALT (55), PROBCONS (27), PCMA (54),
9rnt 5 0.783 0.804 0.954 MUSCLE (34) and CLUSTALW (23)
kinase 5 0.308 0.399 0.644
2cba 5 0.653 0.761 0.754 Aligner Q-score Running time
1ppn 5 0.605 0.623 0.987
2myr 4 0.236 0.385 0.285 PROBCONS (27) 86.41 32 h 11 min
1eft 4 0.728 0.739 0.880 PCMA (54) 85.75 5 h 39 min
1taq 5 0.747 0.817 0.946 IMSA 84.68 30 h 58 min
1ubi 17 0.267 0.393 0.897 COBALT (55) 84.44 4 h 38 min
kinase 18 0.186 0.270 0.905 MUSCLE (34) 82.35 1 h 18 min
1idy 27 0.295 0.346 0.854 CLUSTALW (23) 75.37 1 h 21 min
Average 0.479 0.560 0.810
The comparison was done using BALIBASE 3.0 (53) as benchmark.
Best results are in boldface. Best results are in boldface.
Table 7. IMSA versus ClonAlign (58), each entry reports the pair of values (SP, CS)
Instance ClonAlign (59) Clustal (59) Muscle (59) T-Coffee (59) IMSA
1aab (1.000, 1.000) (0.940, 0.881) (1.000, 1.000) (1.000, 1.000) (1.000, 1.000)
1aho (1.000, 1.000) (0.920, 0.857) (1.000, 1.000) (1.000, 1.000) (1.000, 1.000)
2trx (0.707, 0.500) (0.707, 0.500) (0.644, 0.386) (0.752, 0.591) (0.996, 0.614)
1tgxa (0.849, 0.833) (0.914, 0.933) (0.785, 0.700) (0.753, 0.667) (0.991, 0.921)
1wit (1.000, 1.000) (0.873, 0.683) (1.000, 1.000) (0.980, 0.951) (0.898, 0.871)
1ar5a (0.977, 0.957) (0.986, 0.976) (0.995, 0.994) (0.982, 0.970) (1.000, 0.968)
gal4 (0.666, 0.459) (0.698, 0.541) (0.746, 0.430) (0.683, 0.422) (0.584, 0.506)
glg (0.907, 0.845) (0.956, 0.908) (0.986, 0.982) (0.987, 0.986) (0.880, 0.830)
1amk (0.993, 0.982) (0.996, 0.991) (0.996, 0.991) (0.996, 0.991) (1.000, 1.000)
1gdoa1 (0.779, 0.679) (0.908, 0.835) (0.862, 0.732) (0.934, 0.884) (0.882, 0.763)
451c (0.707, 0.469) (0.649, 0.429) (0.622, 0.367) (0.717, 0.469) (0.773, 0.619)
Average (0.871, 0.793) (0.868, 0.752) (0.876, 0.780) (0.889, 0.812) (0.909, 0.826)
Best results are in boldface.
11. Nucleic Acids Research, 2010 11
Table 9. Average SP score for IMSA and several alignment generate the initial population (CLUSTALW-seeding),
algorithms, on BALIBASE 3.0 data-set and two specific ad-hoc mutation operators. To measure
Aligner RV11 RV12 RV20 RV30 RV40 RV50
the alignment quality produced by IMSA, we have used
the classical benchmark BALIBASE versions 1.0, 2.0 and
MUSCLE (fast) (34) 0.4904 0.8303 0.8359 0.7076 0.6904 0.6823 3.0. A favourable feature of IMSA is the ability of
MAFFT (fast) (59) 0.4801 0.8161 0.8404 0.7345 0.7187 0.7089 generating more than a single suboptimal alignment, for
MAFFT v6 0.4790 0.8066 0.8096 0.6801 0.6610 0.6985 every MSA instance. This behaviour is due to the stochas-
(parttree, n = 50) (59)
MAFFT (59) 0.4914 0.8258 0.8459 0.7437 0.7347 0.7253
tic nature of the algorithm and of the populations evolved
GRAMALIGN (56) 0.5089 0.8328 0.8270 0.6855 0.7239 0.6903 during the convergence process. This feature will help
KALIGN (60) 0.5029 0.8504 0.8410 0.7389 0.7259 0.7299 the decision maker to assess and select the biologically
CLUSTALW (fast) (23) 0.4748 0.8367 0.8258 0.6843 0.6705 0.6715 relevant multiple sequence alignment. The alignment
MUSCLE (34) 0.5578 0.8583 0.8548 0.7492 0.7623 0.7384 process is not affected by the presence of distant se-
CLUSTALW (23) 0.4908 0.8197 0.8219 0.6841 0.6950 0.6698
PSALIGN (61) 0.5924 0.8804 0.8720 0.7554 0.7937 0.7739 quences, and this can be considered another advantage
T-COFFEE (24) 0.5181 0.8650 0.8660 0.7588 0.7452 0.7715 of IMSA. Another important feature of the designed
IMSA 0.5638 0.8660 0.8690 0.7565 0.7534 0.7628 algorithm is that IMSA can be used by other aligners as
a local search procedure to properly explore promising
Best results are in boldface.
candidate solutions or regions of the search space.
Experimental results on BALIBASE v.1.0 show that
Downloaded from nar.oxfordjournals.org by guest on November 13, 2010
IMSA is superior to PRRP, CLUSTALX, SAGA,
Table 10. Average Total-Column (TC) score for IMSA and several DIALIGN, PIMA, MULTIALIGN and PILEUP8;
alignment algorithms, on BALIBASE 3.0 data set while on BALIBASE v.2.0 the algorithm shows interesting
Aligner RV11 RV12 RV20 RV30 RV40 RV50
results in terms of SP score with respect to established and
leading methods, e.g. CLUSTALW, T-COFFEE, MUSCLE,
MUSCLE (fast) (34) 0.2421 0.6349 0.2599 0.2457 0.2614 0.2719 PRALINE, PROBCONS and SPEM. Although the scoring
MAFFT (fast) (59) 0.2354 0.6209 0.3094 0.2910 0.3108 0.3087 function used by IMSA produces high SP values and
MAFFT v6 0.2461 0.6320 0.2978 0.2987 0.3104 0.3435 low CS scores, future work will focus on the improvement
(parttree, n = 50) (59)
MAFFT (59) 0.2532 0.6256 0.3168 0.3158 0.3073 0.3303 of the CS score values using the T-Coffee scoring function.
GRAMALIGN (56) 0.2993 0.6701 0.2917 0.2503 0.3292 0.3006 Using the same benchmark (BALIBASE v.2.0) IMSA was
KALIGN (60) 0.2538 0.6749 0.2765 0.2955 0.3253 0.3223 also compared with two immunological aligners. From
CLUSTALW (fast) (23) 0.2317 0.6651 0.2680 0.2513 0.2808 0.2752 these comparisons, IMSA shows best performances, and
MUSCLE (34) 0.3217 0.6961 0.3077 0.3087 0.3484 0.3397
CLUSTALW (23) 0.2395 0.6417 0.2602 0.2478 0.3024 0.2658
hence best alignments, than both ClonAlign and AIS.
PSALIGN (61) 0.3503 0.7384 0.3517 0.2992 0.3951 0.3816 For completeness, IMSA has been compared with
T-COFFEE (24) 0.2716 0.6986 0.3257 0.3637 0.3659 0.3974 the state-of-the-art alignment algorithms also on the
IMSA 0.3397 0.7119 0.3335 0.3245 0.3899 0.3823 BALIBASE v.3.0 benchmark. Also in this new testbed,
IMSA shows good alignments, which are comparable
Best results are in boldface.
with the state-of-the-art methods, as MUSCLE (FAST),
MAFFT (FAST), MAFFT v6 (PARTTREE, n = 50),
Table 11. Running time necessary to align all data set of MAFFT, GRAMALIGN, KALIGN, CLUSTALW (FAST),
BALIBASE 3.0 MUSCLE, CLUSTALW, PSALIGN, and T-COFFEE.
Aligner Running time (s)
MUSCLE (fast) (34) 200 ACKNOWLEDGEMENTS
MAFFT (59) 376 The anonymous reviewers provided feedback that meas-
GRAMALIGN (56) 453
KALIGN (60) 886 urably improved the manuscript.
MUSCLE (34) 4086
CLUSTALW (23) 5813
PSALIGN (61) 101 403 FUNDING
IMSA 110 073
T-COFFEE (24) 252 384 Funding for open access charge: EU projects.
Conflict of interest statement. None declared.
Finally, in Table 11 are presented the running times
necessary to align all data set for all alignment algorithms REFERENCES
shown in Tables 9 and 10.
1. Eidhammer,I., Jonassen,I. and Taylor,W.R. (2004) Protein
Bioinformatics. Wiley, Chichester, West Sussex, UK.
2. Durbin,R., Eddy,S., Krogh,A. and Mitchison,G. (2004) Biological
Sequence Analysis. Cambridge University Press, Cambridge, UK.
FINAL REMARKS 3. Notredame,C. (2007) Recent evolutions of multiple sequence
alignment algorithms. PLoS Comput. Biol., 3, 1405–1408.
We have designed a Clonal Selection Algorithm, called 4. Thompson,J.D., Plewniak,F., Ripp,R., Thierry,J.C. and Poch,O.
IMSA, to address the Multiple Sequence Alignment (2001) Towards a reliable objective function for multiple sequence
problem. This algorithm includes a new method to alignments. J. Mol. Biol., 301, 937–951.
12. 12 Nucleic Acids Research, 2010
5. Altschul,S.F. and Lipman,D.J. (1989) Trees stars and multiple 26. Zhou,H. and Zhou,Y. (2005) SPEM: improving multiple sequence
biological sequence alignment. SIAM J. Appl. Math., 49, alignment with sequence profiles and predicted secondary
197–209. structures. Bioinformatics, 21, 3615–3621.
6. Altschul,S.F., Carroll,R.J. and Lipman,D.J. (1989) Weights for 27. Do,C.B., Mahabhashyam,M.S.P., Brudno,M. and Batzoglou,S.
data related by a tree. J. Mol. Biol., 207, 647–653. (2005) ProbCons: probabilistic consistency-based multiple
7. Cutello,V., Nicosia,G., Pavone,M. and Prizzi,I. (2007) Proteomic sequence alignment. Genome Res., 15, 330–340.
multiple sequence alignments: refinement using an immunological 28. Carrillo,H. and Lipman,D.J. (1988) The multiple sequence
local search. Applied and Industrial Mathematics in Italy, series on alignment problem in biology. SIAM J. Appl. Math., 48,
Advanced in Mathematics for Applied Sciences, World Scientific, 1073–1082.
Vol. 75, pp. 291–302. 29. Stoye,J., Moulton,V. and Dress,A.W. (1997) DCA: an efficient
8. Lones,M.A. and Tyrrell,A.M. (2007) Regulatory motif discovery implementation of the divide-and conquer approach to
using a population clustering evolutionary algorithm. IEEE/ACM simultaneous multiple sequence alignment. Bioinformatics, 13,
Transactions on Computational Biology and Bioinformatics, Vol. 4, 625–626.
pp. 403–414. 30. Morgenstern,B., Frech,K., Dress,A. and Werner,T. (1998)
9. Bevilacqua,V., Menolascina,F., Alves,R.T., Tommasi,S., DIALIGN: finding local similarities by multiple sequence
Mastronardi,G., Delgado,A., Paradiso,M.R., Nicosia,G. and alignment. Bioinformatics, 14, 290–294.
Freitas,A.A. (2008) Artificial immune systems in Bioinformatics. 31. Morgenstern,B., Frech,K., Dress,A. and Werner,T. DIALIGN 2:
In Smolinski,T.G., Milanova,M.G. and Hassanien,A. (eds), improvement of the segment-to-segment approach to multiple
Computational Intelligence in Biomedicine and Bioinformatics: sequence alignment. Bioinformatics, 15, 211–218.
Current Trends and Applications. Springer, New York, NY, USA, 32. Gotoh,O. (1994) Further improvement in methods of
pp. 305–330. group-to-group sequence alignment with generalized profile
10. Cutello,V., Nicosia,G. and Pavone,M. (2007) An immune operations. Bioinformatics., 10, 379–387.
Downloaded from nar.oxfordjournals.org by guest on November 13, 2010
algorithm with stochastic aging and kullback entropy 33. Eddy,S.R. (1995) Multiple alignment using hidden Markov
for the chromatic number problem. J. Combi. Optimi., 14, 9–33. models. 3rd International Conference on Intelligent Systems for
11. Cutello,V., Nicosia,G., Pavone,M. and Timmis,J. (2007) An Molecular Biology, Vol. 3, pp. 114–120.
immune algorithm for protein structure prediction on lattice 34. Edgar,R.C. (2004) MUSCLE: multiple sequence alignment with
models. IEEE Trans. Evol. Comput., 11, 101–117. high accuracy and high throughput. Nucleic Acids Res., 32,
12. Bonizzoni,P. and Vedova,G.D. (2001) The complexity of multiple 1792–1797.
sequence alignment with SP-score that is a metric. Theor. 35. Notredame,C. and Higgins,D.G. (1996) SAGA: sequence
Comput. Sci., 259, 63–79. alignment by genetic algorithm. Nucleic Acids Res., 24,
13. Wang,L. and Jiang,T. (1994) On the complexity of multiple 1515–1539.
sequence alignment. J. Comput. Biol., 1, 337–348. 36. Notredame,C. (1998) COFFEE: an objective function for multiple
14. Garey,M.R. and Johnson,D.S. (1979) Computers and sequence alignments. Bioinformatics, 14, 407–422.
Intractability: A Guide to the Theory of NP-Completeness. 37. Simossis,V.A. and Heringa,J. (2005) PRALINE: a multiple
Freeman, New York. sequence alignment toolbox that integrates homology-extended
15. Gupta,S.K., Kececioglu,J.D. and Schaffer,A. (1995) Improving and secondary structure information. Nucleic Acids Res., 33,
the practical space and time efficiency of the shortest-paths 289–294.
approach to sum-of-pairs multiple sequence alignment. 38. Shyu,C., Sheneman,L. and Foster,J.A. (2004) Multiple sequence
J. Comput. Biol., 459–472. alignment with evolutionary computation. Genetic Prog.
16. Joo,K., Lee,J., Kim,I., Lee,S.-J. and Lee,J. (2008) Multiple Evol. Mach., 5, 121–144.
sequence alignment by conformational space annealing. 39. Nguyen,H.D., Yoshihara,I., Yamamori,K. and Yasunaga,M.
Biophys. J., 95, 4813–4819. (2002) Aligning multiple protein sequences by parallel hybrid
17. Lu,Y. and Sze,S.-H. (2008) Multiple sequence alignment based genetic algorithm. Genome Inform., 13, 123–132.
on profile alignment of intermediate sequences. J. Comput. Biol., 40. Cutello,V. and Nicosia,G. (2006) A clonal selection algorithm for
15, 767–777. coloring, hitting set and satisfiability problems. International
18. Rausch,T., Emde,A.-K., Weese,D., Doring,A., Notredame,C. and
¨ Workshop on Natural and Artificial Immune Systems (NAIS),
Reinert,K. (2008) Segment-based multiple sequence alignment. Vol. 3931 of LNCS, Springer, pp. 324–337.
Bioinformatics, 24, i187–i192. 41. Cutello,V., Narzisi,G., Nicosia,G. and Pavone,M. (2006) An
19. Loytynoja,A. and Goldman,N. (2008) A model of evolution
¨ immunological algorithm for global numerical optimization.
and structure for multiple sequence alignment. Philos. Tran. 7th International Conference on Artificial Evolution (EA),
R. Soc. Lond. B, Biol. Sci., 363, 3913–3919. Vol. 3871 of LNCS, Springer, pp. 284–295.
20. Corpet,F. (1988) Multiple sequence alignment with hierarchical 42. Cutello,V., Lee,D., Leone,S., Nicosia,G. and Pavone,M. (2006)
clustering. Nucleic Acids Res., 16, 10881–10890. Clonal selection algorithm with dynamic population size for
21. Devereux,J., Haeberli,P. and Smithies,O. (1984) A comprehensive bimodal search spaces. 2nd International Conference on Natural
set of sequence analysis programs for the VAX. Nucleic Acids Computaion (ICNC), Vol. 4221 of LNCS, Springer, pp. 949–958.
Res., 387–395. 43. Cutello,V., Lee,D., Nicosia,G., Pavone,M. and Prizzi,I. (2006)
22. Thompson,J.D., Gibson,T.J., Plewniak,F., Jeanmougin,F. and Aligning multiple protein sequences by hybrid clonal selection
Higgins,D.G. (1997) The ClustalX windows interface: flexible algorithm with insert-remove-gaps and blockshuffling operators.
strategies for multiple sequence alignment aided by quality 5th International Conference on Artificial Immune Systems
analysis tools. Nucleic Acids Res., 24, 4876–4882. (ICARIS), Vol. 4163 of LNCS, Springer, pp. 13–28.
23. Thompson,J.D., Higgins,D.G. and Gibson,T.J. (1994) CLUSTAL 44. Cutello,V., Nicosia,G. and Pavone,M. (2003) A hybrid immune
W: improving the sensitivity of progressive multiple sequence algorithm with information gain for the graph coloring problem.
alignment through sequence weighting, position-specific gap Genetic and Evolutionary Computaion COnference (GECCO),
penalties and weight matrix choice. Nucleic Acids Res., 22, Vol. 2723 of LNCS, Springer, pp. 171–182.
4673–4680. 45. Cutello,V., Narzisi,G., Nicosia,G. and Pavone,M. (2005) Clonal
24. Notredame,C., Higgins,D.G. and Heringa,J. (2000) T-Coffee: a selection algorithms: a comparative case study using effective
novel method for fast and accurate Multiple Sequence Alignment. mutation potentials. 4th International Conference on Artificial
J. Mol. Biol., 302, 205–217. Immune Systems (ICARIS), Vol. 4163 of LNCS, Springer, pp.
25. Smith,R.F. and Smith,T.F. (1992) Pattern-induced multi-sequence 13–28.
alignment (PIMA) algorithm employing secondary structure- 46. Cutello,V., Morelli,G., Nicosia,G. and Pavone,M. (2005) Immune
dependent gap penalties for use in comparative protein modelling. algorithms with aging operators for the string folding problem
Protein Eng., 5, 35–41. and the protein folding problem. 5th European Conference on
13. Nucleic Acids Research, 2010 13
Comput.ion in Combinatorial Optimization (EvoCOP), Vol. 3448 Knowledge-Based and Intelligent Information and Engineering
of LNCS, Springer, pp. 80–90. Systems - KES 2007, Vietri sul Mare, Italy. Springer, Vol. 4694
47. Cutello,V., Nicosia,G. and Pavone,M. (2004) Exploring the of LNCS, pp. 804–811.
capability of immune algorithms: a characterization of 54. Pei,J., Sadreyev,R. and Grishin,N.V. (2003) PCMA: fast and
hypermutation operators. 3rd International Conference on Artificial accurate multiple sequence alignment based on profile consistency.
Immune Systems (ICARIS), Vol. 3239, of LNCS, Springer, pp. Bioinformatics, 19, 427–428.
263–276 (2004). 55. Papadopoulos,J.S. and Agarwala,R. (2007) COBALT:
48. Cutello,V., Nicosia,G. and Pavone,M. An immune algorithm with constraint-based alignment tool for multiple protein sequences.
hyper-macromutations for the dill’s 2d hydrophobic–hydrophilic Bioinformatics, 23, 1073–1079.
model. Cong. Evol. Comput., 1, 1074–1080. 56. Russell,D.J., Out,H.H. and Sayood,K. (2008) Grammar-based
49. Cutello,V., Nicosia,G., Pavone,M. and Narzisi,G. (2006) Real distance in progressive multiple sequence alignment.
coded clonal selection algorithm for unconstrained global BMC Bioinformatics, 9.
numerical optimization using a hybrid inversely proportional 57. Ge,H., Zhong,W., Du,W., Qian,F. and Wang,L. (2007) A hybrid
hypermutation operator. 21st Annual ACM Symposium on Applied algorithm based on artificial immune system and hidden markov
Computing (SAC), Vol. 2, ACM, 950–954. model for multiple sequence alignment. International Conference
50. Thompson,J.D., Plewniak,F. and Poch,O. (1999) BALIBASE: on Intelligent Systems and Knowledge Engineering (ISKE 2007).
a benchmark alignment database for the evaluation of multiple Atlantis Press.
alignment programs. Bioinformatics, 15, 87–88. 58. Layeb,A. and Deneche,A.H. (2007) Multiple sequence alignment
51. Bahr,A., Thompson,J.D., Thierry,J.C. and Poch,O. (2001) by immune artificial system. ACS/IEEE International Conference
BALIBASE (Benchmark Alignment dataBASE): enhancements for on Computer Systems and Applications, pp. 336–342.
repeats, transmembrane sequences and circular permutations. 59. Katoh,K., Misawa,K., Kuma,K. and Miyata,T. (2002) MAFFT:
Nucleic Acids Res., 29, 232–326. a novel method for rapid multiple sequence alignment based on
Downloaded from nar.oxfordjournals.org by guest on November 13, 2010
52. Thompson,J.D., Koehl,P., Ripp,R. and Poch,O. (2005) fast fourier trasform. Nucleic Acids Res., 30, 3059–3066.
BALIBASE 3.0: latest developments of the multiple sequence 60. Lassmann,T. and Sonnhammer,E. (2005) Kalign – an accurate
alignment benchmark. Proteins Struct. Funct. Bioinformatics, 61, and fast multiple sequence alignment algorithm. BMC
127–136. Bioinformatics., 6.
53. Castrogiovanni,M., Nicosia,G. and Rascuna,R. (2007) 61. Sze,S., Lu,Y. and Yang,Q. (2006) a polynomial time solvable
Experimental analysis of the aging operator for static and formulation of multiple sequence alignment. J. Comput. Biol., 13,
dynamic optimisation problems. 11th International Confernce on 309–319.