Más contenido relacionado
Similar a Games marketreport free_030510 (20)
Más de Marketingfacts (20)
Games marketreport free_030510
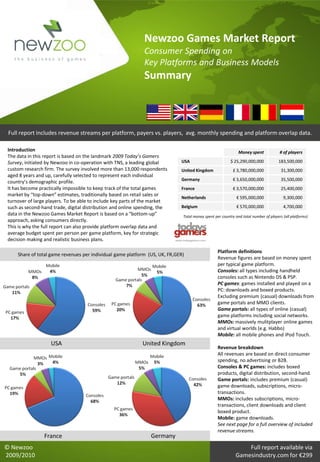
- 1. Newzoo Games Market Report
Consumer Spending on
Key Platforms and Business Models
Summary
Full report includes revenue streams per platform, payers vs. players, avg. monthly spending and platform overlap data.
Introduction Money spent # of players
The data in this report is based on the landmark 2009 Today’s Gamers
Survey, initiated by Newzoo in co-operation with TNS, a leading global USA $ 25,290,000,000 183,500,000
custom research firm. The survey involved more than 13,000 respondents United Kingdom £ 3,780,000,000 31,300,000
aged 8 years and up, carefully selected to represent each individual
Germany € 3,650,000,000 35,500,000
country’s demographic profile.
It has become practically impossible to keep track of the total games France € 3,570,000,000 25,400,000
market by “top-down” estimates, traditionally based on retail sales or
Netherlands € 595,000,000 9,300,000
turnover of large players. To be able to include key parts of the market
such as second-hand trade, digital distribution and online spending, the Belgium € 570,000,000 4,700,000
data in the Newzoo Games Market Report is based on a “bottom-up” Total money spent per country and total number of players (all platforms)
approach, asking consumers directly.
This is why the full report can also provide platform overlap data and
average budget spent per person per game platform, key for strategic
decision making and realistic business plans. www.todaysgamers.com
Platform definitions
Share of total game revenues per individual game platform (US, UK, FR,GER)
Revenue figures are based on money spent
per typical game platform.
Consoles: all types including handheld
consoles such as Nintendo DS & PSP.
PC games: games installed and played on a
PC: downloads and boxed products.
Excluding premium (casual) downloads from
game portals and MMO clients.
Game portals: all types of online (casual)
game platforms including social networks.
MMOs: massively mulitplayer online games
and virtual worlds (e.g. Habbo)
Mobile: all mobile phones and iPod Touch.
USA United Kingdom
Revenue breakdown
All revenues are based on direct consumer
spending, no advertising or B2B.
Consoles & PC games: includes boxed
products, digital distribution, second-hand.
Game portals: includes premium (casual)
game downloads, subscriptions, micro-
transactions.
MMOs: includes subscriptions, micro-
transactions, client downloads and client
boxed product.
Mobile: game downloads.
See next page for a full overview of included
revenue streams.
France Germany
© Newzoo Full report available via
2009/2010 Gamesindustry.com for €299
- 2. Newzoo Games Market Report
Consumer Spending on
Key Platforms and Business Models
Summary
Revenues per platform
In all countries console games Consoles PC games Game portals Mobile devices MMOs
(including a large second-hand USA $ 15,140,000,000 $ 4,150,000,000 $ 2,780,000,000 $ 1,100,000,000 $ 2,120,000,000
market) take up more than half
of the total money spent, except UK £ 2,390,000,000 £ 740,000,000 £ 270,000,000 £ 190,000,000 £ 190,000,000
for Germany where PC games GER € 1,540,000,000 € 1,320,000,000 € 430,000,000 € 180,000,000 € 180,000,000
are traditionally very popular.
The UK is a relatively strong FR € 2,430,000,000 € 690,000,000 € 190,000,000 € 100,000,000 € 160,000,000
market for mobile games. NL € 315,000,000 € 170,000,000 € 55,000,000 € 10,000,000 € 45,000,000
Germany and the US have a
clearly lead when it comes to BE € 310,000,000 € 150,000,000 € 60,000,000 € 10,000,000 € 40,000,000
spending money on (casual) Total money spent per platform per country (in local currency).
game websites.
In the full Newzoo Games Market Report, revenue data is split up into the following business models / revenue streams:
Consoles PC games Game portals MMOs Mobile devices
■ Physical shop ■ Physical shop ■ Subscriptions ■ Monthly subscriptions ■ Revenues are all
■ Online shop ■ Online shop ■ Premium downloads ■ Annual subscriptions game download
■ Second-hand trade ■ Second-hand trade ■ Virtual currency ■ Virtual currency revenues and not
■ Digital distribution ■ Digital distribution ■ Direct micro-transactions ■ Direct micro-transactions split up.
■ Skill gaming / Play for prizes ■ Client download / box
Overlap with: Platform overlap
Platform Consoles Portals PC games MMOs Mobile With the rise of new game platforms and genres,
consumers no longer stick to one single platform or
Consoles 39% full report full report full report
type of game. The table shows that 39% of US
Portals full report full report 35% full report console gamers also plays on online (casual) game
portals and 42% of MMO gamers also uses their
PC games 72% full report full report full report
mobile device as game platform. As more games are
MMOs full report full report full report 42% launched across multiple platforms the cross-
platform data in the full Newzoo Games Market
Mobile full report full report 64% full report
Report sheds light on which combinations are most
Cross-platform game behaviour of US gamers (example from full report). popular.
Players versus payers
Money spent # of players # of payers €/month Depending on the combination of country and
platform 20 to 80 percent never pays to play games.
Consoles € 1,540,000,000 19,900,000 13,710,000 € 9.40
The full report shows the number of payers per
PC games € 1,320,000,000 24,800,000 full report full report platform and the average budget spent per month.
Portals € 430,000,000 14,400,000 full report full report
Author
MMOs € 180,000,000 5,900,000 full report full report
Peter Warman, CEO, Newzoo BV
Mobile € 180,000,000 7,300,000 full report full report peter@newzoo.com
+31 (0)20 6635816
Money spent in Germany, # of players, payers and avg. spent/month (example from full report).
www.gamesindustry.com
© Newzoo Full report available via
2009/2010 Gamesindustry.com for €299