SlideShare una empresa de Scribd logo
1 de 8
Comprehensive Ratio Analysis
    Financial Ratio Analysis
    A useful framework for ratio analysis is that developed by the Dupont company. Dupont used this to control their subsidiary companies
    Their framework followed the principle that the source of the % Return on Equity ( Shareholders Funds ) came from three elements:

            PROFITABILITY                             EFFICIENCY                                                      LEVERAGE
       (Net Profit as a % of Sales)             (Sales Divided by Assets)                              ( The English Term for this is GEARING)
                                                                                                           (Borowings as a % of Net Assets)
                                                  Called Asset Turnover             If Shareholders cannot finance assets from their
                                                                                    own Funds they can Borrow at fixed interest rates
                                                                                    and acquire more assets. If the returns they obtain
                                                                                    on these assets are greater than the interest cost
                                                                                    any margin over the interest costs flow directly
                                                                                    to Shareholders.

    The Dupont General Formula is:         RETURN on EQUITY is equal to                              Profitability X Efficiency / ( 1 - Leverage % )
         Or Return on Equity =                (Net Profit / Sales) X (Sales / Net
                                        Assets) / (Equity / Net Assets )

    Profitability Ratios
    The usual method for analysing Profitability is with a "Common Size Income Statement". In this statement each line of the Income Statement
    (Profit and Loss Account) is expressed as a percentage of Sales. In this way any source of improvement or deterioration in Profitability can be
    identified. Another form of analysis of the Common Size Income statement which can be used is called "Horizontal Analysis". In this type of
    analysis the % growth of each line on the profit and loss account from one year to the next is calculated, again to identify the source of any problem.

    The most frequently calculated PROFITABILITY RATIOS are:
                 RATIO                      CALCULATION METHOD                                                           NOTES
    Gross Profit Ratio (Gross Profit           Gross Profit / Sales                 Sales can be called Sales Turnover, Sales Income, Sales Revenue, Gross
    Margin)                                                                         Revenue
                                                                                    Gross Profit is Sales minus Cost of Sales. Cost of Sales can be called many
                                                                                    different things, but the best way to identify it is that it will be situated in the
                                                                                    rows between Sales and Gross Profit on the Profit and Loss Account.

    Operating Profit Margin                      Operating Profit / Sales           Alternative terms for Operating Profit are "Profit before Interest and Taxation"
                                                                                    or "Earnings before Interest & Taxation". It is usually the Sub-total row on the
                                                                                    Profit and Loss Account befor the Row entitled Interest.


1                                                                                                                                                         Maroof Hussain Sabri
Comprehensive Ratio Analysis
    Financial Ratio Analysis
    Profitability Ratios (Continued)
    The most frequently calculated PROFITABILITY RATIOS are:
                  RATIO                      CALCULATION METHOD                                                      NOTES
    Profit Before Tax Margin            Profit Before Interest & Tax / Sales   Sales can be called Sales Turnover, Sales Income, Sales Revenue, Gross
                                                                               Revenue
                                                                               Profit before interest & tax can also be called "Earnings before Interest & Tax".
                                                                               It is the row on the Profit and loss Account before the row entitled Taxation.

    Net Profit Margin                            Net Profit / Sales            Alternative terms for Net Profit are "Profit after Taxation", "Earnings after Tax"
                                                                               or "Net Income" . It is usually the last row on the Profit and Loss Account
                                                                               before the Row/s entitled Dividends.


2                                                                                                                                                 Maroof Hussain Sabri
Comprehensive Ratio Analysis
    Financial Ratio Analysis
    Efficiency Ratios

    Efficiency ratios deal with the efficiency with which Management has used the assets employed in the business.
    Various Asset Turnover ratios can be calculated and any improvement or deterioration in performance can be identified
    Commonly Calculated Efficiency Ratios are:

                 RATIO                        CALCULATION METHOD                                                      NOTES
    Total Asset Turnover                        Sales / Net Assets               Sales can be called Sales Turnover, Sales Income, Sales Revenue, Gross
                                                                                 Revenue
                                        Expressed as a number of times eg 2.5    Net Assets = Fixed Assets + Net Current Assets (Net Current Assets = Current
                                                        times                    Assets - Current Liabilities)
                                                                                 Current Assets = Stocks ( Inventories ) + Debtors (Receivables) + Cash
                                                                                 Current Liabilities = Creditors (Payables) + Overdraft
    Fixed Asset Turnover                        Sales / Fixed Assets
                                        Expressed as a number of times eg 2.5
                                                        times
    Stock (Inventory) Turnover                 Cost of Sales / Stocks            Cost of Sales can be called many different things, but the best way to identify
                                                                                 it is that it will be situated in the rows between Sales and Gross Profit on the
                                                                                 Profit and Loss Account.
                                        Expressed as a number of times eg 2.5
                                                        times
                                        Can be expressed as a number of Days This is done by dividing the number of Times Stock is turned over into 365

    Debtors (Receivables) Turnover                Sales / Debtors
                                        Expressed as a number of times eg 2.5
                                                        times
                                        Can be expressed as a number of Days This is done by dividing the number of Times Stock is turned over into 365

    Creditors (Payables) Turnover         Total Annual Credit Purchases /     This is not usually disclosed in Published Accounts
                                                     Creditors
                                        Expressed as a number of times eg 2.5
                                                        times
                                        Can be expressed as a number of Days


3                                                                                                                                                 Maroof Hussain Sabri
Comprehensive Ratio Analysis

    Financial Ratio Analysis
    Combining Profitability and Efficiency Ratios
    Profitability and Efficiency Ratios can be combined together to calculate
                    RATIO                        CALCULATION METHOD                                                     NOTES
    Return on Net Assets                          Net Profit / Net Assets          Net Assets = Fixed Assets + Net Current Assets (Net Current Assets = Current
                                                                                   Assets - Current Liabilities)
                                                                                   Current Assets = Stocks ( Inventories ) + Debtors (Receivables) + Cash
                                                                                   Current Liabilities = Creditors (Payables) + Overdraft
    Return on Capital Employed                Operating Profit / Net Assets        Alternative terms for Operating Profit are "Profit before Interest and Taxation"
                                                                                   or "Earnings before Interest & Taxation". It is usually the Sub-total row on the
                                                                                   Profit and Loss Account befor the Row entitled Interest.
                                                                                   Net Assets = Capital Employed
                                                                                   Capital Employed is the total amount invested in a business by Owners who
                                                                                   have claims on Equity             ( Share Capital + Retained Profits) and
                                                                                   Providers of Loans who have claims on the business for the amounts of their
                                                                                   loans and who receive interest.

    Neither of these ratios is theoretically perfect. Return on net assets is calculated after deduction of interest and Operating Profits are subject to
    Taxation after interest has been deducted. Operating profit flows to three destinations: THE GOVERNMENT ( Taxes on Profits); LENDERS
    (Interest) and SHAREHOLDERS (Dividends plus Retained Profits). Net Profit only flows to SHAREHOLDERS though a part of the NET ASSETS are
    Financed by LENDERS.

    Therefore a further Ratio has been suggested as being the true measure for a combination of Profitability and Efficiency Ratios

               RATIO                            CALCULATION METHOD                                                   NOTES
         NOPAT : NET ASSETS             (Operating Profit minus Taxes) / Net       NOPAT is Net Operating Profit After Taxes
                                        Assets

    NOPAT only flows to two destinations: LENDERS and SHAREHOLDERS who have financed NET ASSETS through LOANS and EQUITY


4                                                                                                                                                   Maroof Hussain Sabri
Comprehensive Ratio Analysis
    Financial Ratio Analysis
    Leverage or Gearing Ratios
    If Shareholders cannot finance assets from their own Funds they can Borrow at fixed interest rates and acquire more assets. If the returns they
    obtain on these assets are greater than the interest cost, any margin over the interest costs flow directly to Shareholders.

                 RATIO                        CALCULATION METHOD                                                NOTES
    Debt to Equity Ratio                Long Term Debt / Equity Shareholders Equity Shareholders Funds is comprised of Share Capital plus retained Profits
                                                     Funds %
    Debt to Net Assets Ratio                Long Term Debt / Net Assets      Net Assets = Fixed Assets + Net Current Assets (Net Current Assets = Current
                                                                             Assets - Current Liabilities)
                                                                             Net Assets = Capital Employed
                                                                             Capital Employed is the total amount invested in a business by Owners who
                                                                             have claims on Equity           ( Share Capital + Retained Profits) and
                                                                             Providers of Loans who have claims on the business for the amounts of their
                                                                             loans and who receive interest.
                RATIO                         CALCULATION METHOD                                                NOTES
    Return on Equity                             Net Profit / Equity         Equity Shareholders Funds is comprised of Share Capital plus retained Profits

    Also Known as
    Return on Shareholders Funds

    REMEMBER
    RETURN on EQUITY is equal to           Profitability X Efficiency / ( 1 -
                                                    Leverage % )
         Or Return on Equity =               (Net Profit / Sales) X (Sales / Net
                                       Assets) / (Equity / Net Assets )

    Liquidity Ratios
    These are of use to those who have lent money to the company or are supplying goods on credit to the company.
    They are a measure of how easily current assets can be turned into cash to pay lenders or suppliers
                  RATIO                       CALCULATION METHOD                                                      NOTES
    Current Ratio                        Current Assets / Current Liabilities Current Assets = Stocks ( Inventories ) + Debtors (Receivables) + Cash
                                                                                 Current Liabilities = Creditors (Payables) + Overdraft
    Quick Ratio or Acid Test Ratio      (Cash + Debtors) / Current Liabilities Debtors should be able to be converted into cash quickly to pay current
                                                                                 liabilities


5                                                                                                                                                 Maroof Hussain Sabri
Comprehensive Ratio Analysis

    Financial Ratio Analysis
    Ratios and Other Statistical Data which can be used by POTENTIAL INVESTORS in a Company

    Before an investment in a company is considered a thorough analysis of the data pertaining to the company should be undertaken. Financial
    Analysts refer to this as Fundamental Analysis. It comprises of a calculation of the ratios outlined above as well as additional calculations
    outlined below. The investors may be Providers of Loans, for which they will receive returns in the form of interest payments.
    Or these investors may wish to purchase Ordinary Shares in the Company. In this case returns they receive will be in the form of
    Capital Gains from increases in the share price plus Income from Dividends.
    Additional Ratios for Lenders
            RATIO / STATISTIC                  CALCULATION METHOD                                                       NOTES
    Interest Cover                            Operating Profit / Interest          The higher this ratio the more likely it is that a company will be able to meet its
                                                                                   interest payments in the event of a deterioration in its trading situation

                                         Usually expressed as a Number of Times The level of interest cover also determines the Interest Costs a company will
                                         (US Terminology Times Interest Earned) pay for loans. Lower levels of Interest Cover mean that the Company is more
                                                                                risky to lend to, so if it is more risky the lenders will require higher returns.


    Additional Ratios for Investors in Ordinary Shares
           RATIO / STATISTIC                  CALCULATION METHOD                                                   NOTES
    Current Share Price                          Market Quotation               Prices are quoted in the "Serious Press" and on Bloomberg.co.uk or
                                                                                http://www.finance.yahoo.co.uk
    Earnings per Share                   Net Profit / Number of shares in issue Will be quoted on Bloomberg & Yahoo Finance. Also shown prominently in
                                                                                Companies' Published Accounts
    Price / Earnings Ratio                Curent Share Price / Earnings Per     Price Earnings (PE) Ratios are quoted in the serious press and on Bloomberg
                                                         Share                  & Yahoo Finance. PE Ratios tend to be similar for companies in a particular
                                                                                Industrial sector. Companies with higher PE ratios tend to be in favour with
                                                                                investment fund managers who control large investment funds for pensions,
                                                                                Insurance companies and Investment trusts. A low price earnings ratio may
                                                                                also indicate that the Company is undervalued, and an investment in its
                                                                                shares may yield possible capital gains.
    Dividend per share                  Annual Reported Dividend per Share           Will be quoted on Bloomberg & Yahoo Finance. Also shown prominently in
                                                                                     Companies' Published Accounts
    Dividend Cover                      Net Profit after tax / Dividends or          Gives some indication of certainty of dividend, but note that companies can
                                        Earnings per share / Dividend per            still pay dividends when they are making losses
                                        share
    Dividend Yield %                      Dividend per Share / Current Share         Will be quoted on Bloomberg & Yahoo Finance. Also shown prominently in
                                                           Price                     Companies' Published Accounts


6                                                                                                                                                     Maroof Hussain Sabri
Comprehensive Ratio Analysis

    Financial Ratio Analysis
    Ratios and Other Statistical Data which can be used by POTENTIAL INVESTORS in a Company
    Additional Ratios for Investors in Ordinary Shares
           RATIO / STATISTIC                   CALCULATION METHOD                                                    NOTES
    Market Capitalisation                 Current Share Price Multiplied by      Market Capitalisations for companies are quoted in the "Serious Press" and
                                              Number of shares in issue          on Bloomberg.co.uk or http://www.finance.yahoo.co.uk
    Total Shareholder Return           The increase in value of an investment    Data for this calculation can be obtained from Yahoo Finance, share price
                                       in a company's ordinary shares over a     history.
                                        period of years (Usually 3 or 5 Years)
                                           assuming that all dividends are
                                       reinvested in the company at the share
                                        price on the date when dividends are
                                                       received
    Book to Market Ratio                    Market Capitalisation / Equity       The book to market ratio is important, since studies have shown that
                                                Shareholders Funds               Companies with low book to market ratios provide greater long term returns
                                                                                 than those with higher Book to Market Ratios in the same industrial sector
    Price Earnings Relative                                                      A measure of the relationship between the Price Earnings Ratio for a
                                                                                 Company and the P.E. Ratio for the Market as a whole. Published in
                                                                                 Bloomberg and Yahoo Finance.
    Dividend Yield Relative                                                      A measure of the relationship between the Dividend Yield for a Company and
                                                                                 the Dividend Yield for the Market as a whole. Published in Bloomberg and
                                                                                 Yahoo Finance.
    Retentions Percentage                   Retained Profit / Net Profit
    Sustainable Growth Rate            Retentions Percentage Multiplied by       The theory is that companies retain profits to invest and in doing so should
                                           Return on Equity (Return on           obtain at least the same level of Return on Equity for the profits retained for a
                                              Shareholders Funds)                year as it gets on what it has invested previously.
    BETA                                 Published on Yahoo Finance &            BETA is a statistical measure which indicates how individual share prices
                                                 Bloomberg.com                   move up and down as the market as a whole moves up and down. Company
                                                                                 shares with a BETA of 1 move up and down exactly as the Market Moves up
                                                                                 and down. Company shares with a BETA of less than 1 move up less than the
                                                                                 market when the market is going up and move down less than the market
                                                                                 when the market is going down. These are known as DEFENSIVE SHARES.
                                                                                 Company shares with a BETA of more than 1 rise more than the market when
                                                                                 the market is rising and move down more than the Market when the market is
                                                                                 falling. These are known as AGGRESSIVE or SEASONAL Shares


7                                                                                                                                                  Maroof Hussain Sabri
Comprehensive Ratio Analysis
    Financial Ratio Analysis
    Share Valuation Methods
    Investment fund managers are looking for two things when they decide to make investments. Firstly they are looking for income from dividends and
    secondly they are looking for potential share price growth. They assess potential share price growth by calculating an INTRINSIC VALUE for a
    share. One of the most frequently used methods is to calculate the required return for a share using the CAPITAL ASSET PRICING MODEL.
    The Capital Asset Pricing Model (CAPM) is a financial theory which states that the required return for a share should be equal to a RISK FREE RATE
    plus BETA multiplied by the MARKET RISK PREMIUM. The MARKET RISK PREMIUM is the difference between the MARKET RATE OF RETURN
    and THE RISK FREE RATE. The RISK FREE RATE is generally assumed to be the rate of return on short term government bonds such as Treasury
    Bills. At 1.1.2005 this rate is approximately 5% per annum. Over a period of years the MARKET RATE OF RETURN has been 10% per Annum, thus
    THE MARKET RISK PREMIUM is 5% (10% - 5%).
    For a share with a BETA of 1.5, the required rate of return would this be 5% + 1.5 (10% - 5%) = 12.5%.

    The REQUIRED RATE OF RETURN is then plugged into a formula for calculating the INTRINSIC VALUE of a share, which is based on the
    assumption that CURRENT DIVIDENDS will grow at a percentage GROWTH RATE determined by SUSTAINABLE GROWTH. This is known as THE
    DIVIDEND DISCOUNT MODEL. The formula for this model is :
    INTRINSIC SHARE VALUE = (CURRENT DIVIDEND) Multiplied by (1 + Growth Rate) / (REQUIRED RATE OF RETURN - GROWTH RATE)
    Thus if a share had a dividend of 20p per share, a Growth Rate of 5% pa and a Required Rate of Return of 12.5% the Intrinsic Value would be:
            20 X 1.05 / (12.5% - 5%) =                    280p
    The INTRINSIC VALUE is then compared with the Current Share Price. If the INTRINSIC VALUE is substantially greater than the Current Share price
    BUY, if it is substantially less then SELL.

    Financial Ratio Analysis
    A word of warning
    Financial ratio analysis is useful in highlighting potential problems with a company, but it cannot provide all the answers for an Investment Decision.
    Before investing a full analysis of the Economy, Market and Company's competitive position should be also examined.


8                                                                                                                                                    Maroof Hussain Sabri

Más contenido relacionado

La actualidad más candente

Dividend theories
Dividend theoriesDividend theories
Dividend theories
ice456
 
PPT Earnings Per Share IAS 33
PPT Earnings Per Share IAS 33PPT Earnings Per Share IAS 33
PPT Earnings Per Share IAS 33
Shim Jung
 

La actualidad más candente (20)

Dividend theories
Dividend theoriesDividend theories
Dividend theories
 
09 The Investment Environment - Part 1
09 The Investment Environment - Part 109 The Investment Environment - Part 1
09 The Investment Environment - Part 1
 
1b.leverage decision
1b.leverage decision1b.leverage decision
1b.leverage decision
 
Stocks - Corporate Action
Stocks - Corporate ActionStocks - Corporate Action
Stocks - Corporate Action
 
International accounting standard (ias)
International accounting standard (ias)International accounting standard (ias)
International accounting standard (ias)
 
Own or Lease.ppt
Own or Lease.pptOwn or Lease.ppt
Own or Lease.ppt
 
As 16
As 16As 16
As 16
 
Dividend Policy (complete explain)
Dividend Policy (complete explain)Dividend Policy (complete explain)
Dividend Policy (complete explain)
 
Investment Securities. alternatives & attributes
Investment Securities. alternatives & attributesInvestment Securities. alternatives & attributes
Investment Securities. alternatives & attributes
 
Stock Valuation Analysis PowerPoint Presentation Slides
Stock Valuation Analysis PowerPoint Presentation SlidesStock Valuation Analysis PowerPoint Presentation Slides
Stock Valuation Analysis PowerPoint Presentation Slides
 
Valuation of shares
Valuation of sharesValuation of shares
Valuation of shares
 
Pre and post merger p e ratios
Pre and post merger p e ratiosPre and post merger p e ratios
Pre and post merger p e ratios
 
Capital Structure Decisions-B.V.Raghunandan
Capital Structure Decisions-B.V.RaghunandanCapital Structure Decisions-B.V.Raghunandan
Capital Structure Decisions-B.V.Raghunandan
 
DuPont Analysis
DuPont AnalysisDuPont Analysis
DuPont Analysis
 
As 2
As 2As 2
As 2
 
Security Analysis and Portfolio Management - Investment-and_Risk
Security Analysis and Portfolio Management -  Investment-and_RiskSecurity Analysis and Portfolio Management -  Investment-and_Risk
Security Analysis and Portfolio Management - Investment-and_Risk
 
PPT Earnings Per Share IAS 33
PPT Earnings Per Share IAS 33PPT Earnings Per Share IAS 33
PPT Earnings Per Share IAS 33
 
CVP analysis :Concept, Objective, Assumption
CVP analysis :Concept, Objective, AssumptionCVP analysis :Concept, Objective, Assumption
CVP analysis :Concept, Objective, Assumption
 
As 10
As 10As 10
As 10
 
Exchange ratio and synergy
Exchange ratio and synergyExchange ratio and synergy
Exchange ratio and synergy
 

Destacado

Dupont Slides Sanford Bernstein final 5 27-14
Dupont Slides Sanford Bernstein final 5 27-14Dupont Slides Sanford Bernstein final 5 27-14
Dupont Slides Sanford Bernstein final 5 27-14
DupontInv
 
Comprehensive Analysis of Primerica
Comprehensive Analysis of PrimericaComprehensive Analysis of Primerica
Comprehensive Analysis of Primerica
Aaron Showers
 
Ratio analysis question
Ratio analysis questionRatio analysis question
Ratio analysis question
Girish Sawhney
 
Diageo Financial Analysis 2011-2014
Diageo Financial Analysis 2011-2014Diageo Financial Analysis 2011-2014
Diageo Financial Analysis 2011-2014
Michael Calo
 
A du-pont analysis of automobile companies
A du-pont analysis of automobile companiesA du-pont analysis of automobile companies
A du-pont analysis of automobile companies
priya1826dangi
 
STRATEGIC FINANCIAL REVIEW OF DIGI.COM BHD
STRATEGIC FINANCIAL REVIEW OF DIGI.COM BHDSTRATEGIC FINANCIAL REVIEW OF DIGI.COM BHD
STRATEGIC FINANCIAL REVIEW OF DIGI.COM BHD
Shanmuga Pillaiyan
 

Destacado (20)

Financial Ratio Analysis Tutorial Exercise 1 Answers
Financial Ratio Analysis Tutorial Exercise 1 AnswersFinancial Ratio Analysis Tutorial Exercise 1 Answers
Financial Ratio Analysis Tutorial Exercise 1 Answers
 
Dupont Slides Sanford Bernstein final 5 27-14
Dupont Slides Sanford Bernstein final 5 27-14Dupont Slides Sanford Bernstein final 5 27-14
Dupont Slides Sanford Bernstein final 5 27-14
 
Comprehensive Analysis of Primerica
Comprehensive Analysis of PrimericaComprehensive Analysis of Primerica
Comprehensive Analysis of Primerica
 
Ratio analysis question
Ratio analysis questionRatio analysis question
Ratio analysis question
 
ABB Low Voltage (LV) Bushings for Pad Mounted Distribution Transformers 600V
ABB Low Voltage (LV) Bushings for Pad Mounted Distribution Transformers 600VABB Low Voltage (LV) Bushings for Pad Mounted Distribution Transformers 600V
ABB Low Voltage (LV) Bushings for Pad Mounted Distribution Transformers 600V
 
Dupont analysis of private sector banks: ICICI and HDFC Bank
Dupont analysis of private sector banks: ICICI and HDFC BankDupont analysis of private sector banks: ICICI and HDFC Bank
Dupont analysis of private sector banks: ICICI and HDFC Bank
 
Ratio Analysis of Raymond
Ratio Analysis of RaymondRatio Analysis of Raymond
Ratio Analysis of Raymond
 
Diageo Financial Analysis 2011-2014
Diageo Financial Analysis 2011-2014Diageo Financial Analysis 2011-2014
Diageo Financial Analysis 2011-2014
 
Bba 2204 fin mgt week 3 financial ratios
Bba 2204 fin mgt week 3 financial ratiosBba 2204 fin mgt week 3 financial ratios
Bba 2204 fin mgt week 3 financial ratios
 
Du Pont Analysis
Du Pont AnalysisDu Pont Analysis
Du Pont Analysis
 
Du pont analysis
Du pont analysisDu pont analysis
Du pont analysis
 
A du-pont analysis of automobile companies
A du-pont analysis of automobile companiesA du-pont analysis of automobile companies
A du-pont analysis of automobile companies
 
Coca-Cola Corporate Valuation
Coca-Cola Corporate ValuationCoca-Cola Corporate Valuation
Coca-Cola Corporate Valuation
 
AirAsia Financial
AirAsia FinancialAirAsia Financial
AirAsia Financial
 
Punjab National Bank Ratio Analysis and company Analysis
Punjab National Bank Ratio Analysis and company AnalysisPunjab National Bank Ratio Analysis and company Analysis
Punjab National Bank Ratio Analysis and company Analysis
 
Du pont analysis
Du pont analysisDu pont analysis
Du pont analysis
 
STRATEGIC FINANCIAL REVIEW OF DIGI.COM BHD
STRATEGIC FINANCIAL REVIEW OF DIGI.COM BHDSTRATEGIC FINANCIAL REVIEW OF DIGI.COM BHD
STRATEGIC FINANCIAL REVIEW OF DIGI.COM BHD
 
Management accounting report
Management accounting reportManagement accounting report
Management accounting report
 
Du Pont Presentation
Du Pont PresentationDu Pont Presentation
Du Pont Presentation
 
Balance Sheet and Ratio Analysis of a Listed Company
Balance Sheet and Ratio Analysis of a Listed CompanyBalance Sheet and Ratio Analysis of a Listed Company
Balance Sheet and Ratio Analysis of a Listed Company
 

Similar a Comprehensive Ratio Analysis

Ratio analysis techniques
Ratio analysis techniquesRatio analysis techniques
Ratio analysis techniques
dhruv1898
 
Ratios and formulas in customer financial analysis
Ratios and formulas in customer financial analysisRatios and formulas in customer financial analysis
Ratios and formulas in customer financial analysis
University Of Central Punjab
 
Ratios and formulas in customer financial analysis
Ratios and formulas in customer financial analysisRatios and formulas in customer financial analysis
Ratios and formulas in customer financial analysis
Najib Baig
 
Sandy financial analysis
Sandy financial analysisSandy financial analysis
Sandy financial analysis
piyush.u.t
 
A primer on financial statements
A primer on financial statementsA primer on financial statements
A primer on financial statements
Alok Routray
 
Financial Analysis of Oswal Woollen Mills Ltd.
Financial Analysis of  Oswal Woollen Mills Ltd.Financial Analysis of  Oswal Woollen Mills Ltd.
Financial Analysis of Oswal Woollen Mills Ltd.
ishbagga
 
Session3 notes
Session3 notesSession3 notes
Session3 notes
Ragi Nour
 
Why is “Profit” a problematic target Please consider in your answer.pdf
Why is “Profit” a problematic target Please consider in your answer.pdfWhy is “Profit” a problematic target Please consider in your answer.pdf
Why is “Profit” a problematic target Please consider in your answer.pdf
fashioncollection2
 
Prepare a witten financial analysis. .This should include calculation.pdf
Prepare a witten financial analysis. .This should include calculation.pdfPrepare a witten financial analysis. .This should include calculation.pdf
Prepare a witten financial analysis. .This should include calculation.pdf
arrowit1
 
Ratio AnalysisFinancial ratios can be used to examine various as.docx
Ratio AnalysisFinancial ratios can be used to examine various as.docxRatio AnalysisFinancial ratios can be used to examine various as.docx
Ratio AnalysisFinancial ratios can be used to examine various as.docx
catheryncouper
 

Similar a Comprehensive Ratio Analysis (20)

Ratio analysis techniques
Ratio analysis techniquesRatio analysis techniques
Ratio analysis techniques
 
Ratios and formulas in customer financial analysis
Ratios and formulas in customer financial analysisRatios and formulas in customer financial analysis
Ratios and formulas in customer financial analysis
 
Ratios and formulas in customer financial analysis
Ratios and formulas in customer financial analysisRatios and formulas in customer financial analysis
Ratios and formulas in customer financial analysis
 
Financial ratio report
Financial ratio reportFinancial ratio report
Financial ratio report
 
Leverage
LeverageLeverage
Leverage
 
Sandy financial analysis
Sandy financial analysisSandy financial analysis
Sandy financial analysis
 
Key financial ratios
Key financial ratiosKey financial ratios
Key financial ratios
 
Ratio analysis
Ratio analysisRatio analysis
Ratio analysis
 
Imp ratios & there usage
Imp ratios & there usageImp ratios & there usage
Imp ratios & there usage
 
Ratio analysis
Ratio analysisRatio analysis
Ratio analysis
 
A primer on financial statements
A primer on financial statementsA primer on financial statements
A primer on financial statements
 
Financial Analysis of Oswal Woollen Mills Ltd.
Financial Analysis of  Oswal Woollen Mills Ltd.Financial Analysis of  Oswal Woollen Mills Ltd.
Financial Analysis of Oswal Woollen Mills Ltd.
 
Finance basics ppt @ bec doms mba finance
Finance basics ppt @ bec doms mba financeFinance basics ppt @ bec doms mba finance
Finance basics ppt @ bec doms mba finance
 
Financial ratios Part 1
Financial ratios Part 1Financial ratios Part 1
Financial ratios Part 1
 
Session3 notes
Session3 notesSession3 notes
Session3 notes
 
20 Most important financial ratios
20 Most important financial ratios20 Most important financial ratios
20 Most important financial ratios
 
Why is “Profit” a problematic target Please consider in your answer.pdf
Why is “Profit” a problematic target Please consider in your answer.pdfWhy is “Profit” a problematic target Please consider in your answer.pdf
Why is “Profit” a problematic target Please consider in your answer.pdf
 
LEVERAGES & DIVIDEND POLICY.pptx
LEVERAGES & DIVIDEND POLICY.pptxLEVERAGES & DIVIDEND POLICY.pptx
LEVERAGES & DIVIDEND POLICY.pptx
 
Prepare a witten financial analysis. .This should include calculation.pdf
Prepare a witten financial analysis. .This should include calculation.pdfPrepare a witten financial analysis. .This should include calculation.pdf
Prepare a witten financial analysis. .This should include calculation.pdf
 
Ratio AnalysisFinancial ratios can be used to examine various as.docx
Ratio AnalysisFinancial ratios can be used to examine various as.docxRatio AnalysisFinancial ratios can be used to examine various as.docx
Ratio AnalysisFinancial ratios can be used to examine various as.docx
 

Más de Maroof Hussain Sabri

Más de Maroof Hussain Sabri (19)

Business combinations & Consolidations
Business combinations & Consolidations Business combinations & Consolidations
Business combinations & Consolidations
 
Financial Derivatives
Financial  DerivativesFinancial  Derivatives
Financial Derivatives
 
London Interbank Offered Rate By Maroof Hussain
London  Interbank  Offered  Rate By  Maroof  HussainLondon  Interbank  Offered  Rate By  Maroof  Hussain
London Interbank Offered Rate By Maroof Hussain
 
1929 Wall Street Crash
1929  Wall Street Crash1929  Wall Street Crash
1929 Wall Street Crash
 
Investment Appraisals
Investment AppraisalsInvestment Appraisals
Investment Appraisals
 
Elasticity Concepts
Elasticity  ConceptsElasticity  Concepts
Elasticity Concepts
 
Financial Management Investment Appraisal
Financial  Management    Investment  AppraisalFinancial  Management    Investment  Appraisal
Financial Management Investment Appraisal
 
Term Structure Of Interest Rate
Term  Structure Of  Interest  RateTerm  Structure Of  Interest  Rate
Term Structure Of Interest Rate
 
Equity Financing
Equity  FinancingEquity  Financing
Equity Financing
 
14 Points Of Deming
14 Points Of Deming14 Points Of Deming
14 Points Of Deming
 
7 Habbits Of Highly Effective People
7 Habbits Of Highly Effective People7 Habbits Of Highly Effective People
7 Habbits Of Highly Effective People
 
Management Of Cash
Management Of  CashManagement Of  Cash
Management Of Cash
 
Financial Ratios
Financial  RatiosFinancial  Ratios
Financial Ratios
 
Working Capital & WOrking Capital Cycle
Working Capital & WOrking Capital CycleWorking Capital & WOrking Capital Cycle
Working Capital & WOrking Capital Cycle
 
Sources Of Finance
Sources Of  FinanceSources Of  Finance
Sources Of Finance
 
Stock Exchange
Stock  ExchangeStock  Exchange
Stock Exchange
 
E O Q
E O QE O Q
E O Q
 
Working Capital Management
Working  Capital  ManagementWorking  Capital  Management
Working Capital Management
 
Corporate Governance
Corporate GovernanceCorporate Governance
Corporate Governance
 

Último

Call Girls Navi Mumbai Just Call 9907093804 Top Class Call Girl Service Avail...
Call Girls Navi Mumbai Just Call 9907093804 Top Class Call Girl Service Avail...Call Girls Navi Mumbai Just Call 9907093804 Top Class Call Girl Service Avail...
Call Girls Navi Mumbai Just Call 9907093804 Top Class Call Girl Service Avail...
Dipal Arora
 
Call Girls Kengeri Satellite Town Just Call 👗 7737669865 👗 Top Class Call Gir...
Call Girls Kengeri Satellite Town Just Call 👗 7737669865 👗 Top Class Call Gir...Call Girls Kengeri Satellite Town Just Call 👗 7737669865 👗 Top Class Call Gir...
Call Girls Kengeri Satellite Town Just Call 👗 7737669865 👗 Top Class Call Gir...
amitlee9823
 
FULL ENJOY Call Girls In Mahipalpur Delhi Contact Us 8377877756
FULL ENJOY Call Girls In Mahipalpur Delhi Contact Us 8377877756FULL ENJOY Call Girls In Mahipalpur Delhi Contact Us 8377877756
FULL ENJOY Call Girls In Mahipalpur Delhi Contact Us 8377877756
dollysharma2066
 

Último (20)

Monthly Social Media Update April 2024 pptx.pptx
Monthly Social Media Update April 2024 pptx.pptxMonthly Social Media Update April 2024 pptx.pptx
Monthly Social Media Update April 2024 pptx.pptx
 
Uneak White's Personal Brand Exploration Presentation
Uneak White's Personal Brand Exploration PresentationUneak White's Personal Brand Exploration Presentation
Uneak White's Personal Brand Exploration Presentation
 
The Path to Product Excellence: Avoiding Common Pitfalls and Enhancing Commun...
The Path to Product Excellence: Avoiding Common Pitfalls and Enhancing Commun...The Path to Product Excellence: Avoiding Common Pitfalls and Enhancing Commun...
The Path to Product Excellence: Avoiding Common Pitfalls and Enhancing Commun...
 
Call Girls Navi Mumbai Just Call 9907093804 Top Class Call Girl Service Avail...
Call Girls Navi Mumbai Just Call 9907093804 Top Class Call Girl Service Avail...Call Girls Navi Mumbai Just Call 9907093804 Top Class Call Girl Service Avail...
Call Girls Navi Mumbai Just Call 9907093804 Top Class Call Girl Service Avail...
 
It will be International Nurses' Day on 12 May
It will be International Nurses' Day on 12 MayIt will be International Nurses' Day on 12 May
It will be International Nurses' Day on 12 May
 
RSA Conference Exhibitor List 2024 - Exhibitors Data
RSA Conference Exhibitor List 2024 - Exhibitors DataRSA Conference Exhibitor List 2024 - Exhibitors Data
RSA Conference Exhibitor List 2024 - Exhibitors Data
 
Value Proposition canvas- Customer needs and pains
Value Proposition canvas- Customer needs and painsValue Proposition canvas- Customer needs and pains
Value Proposition canvas- Customer needs and pains
 
Call Girls In Panjim North Goa 9971646499 Genuine Service
Call Girls In Panjim North Goa 9971646499 Genuine ServiceCall Girls In Panjim North Goa 9971646499 Genuine Service
Call Girls In Panjim North Goa 9971646499 Genuine Service
 
Call Girls Kengeri Satellite Town Just Call 👗 7737669865 👗 Top Class Call Gir...
Call Girls Kengeri Satellite Town Just Call 👗 7737669865 👗 Top Class Call Gir...Call Girls Kengeri Satellite Town Just Call 👗 7737669865 👗 Top Class Call Gir...
Call Girls Kengeri Satellite Town Just Call 👗 7737669865 👗 Top Class Call Gir...
 
Falcon Invoice Discounting platform in india
Falcon Invoice Discounting platform in indiaFalcon Invoice Discounting platform in india
Falcon Invoice Discounting platform in india
 
Pharma Works Profile of Karan Communications
Pharma Works Profile of Karan CommunicationsPharma Works Profile of Karan Communications
Pharma Works Profile of Karan Communications
 
Business Model Canvas (BMC)- A new venture concept
Business Model Canvas (BMC)-  A new venture conceptBusiness Model Canvas (BMC)-  A new venture concept
Business Model Canvas (BMC)- A new venture concept
 
MONA 98765-12871 CALL GIRLS IN LUDHIANA LUDHIANA CALL GIRL
MONA 98765-12871 CALL GIRLS IN LUDHIANA LUDHIANA CALL GIRLMONA 98765-12871 CALL GIRLS IN LUDHIANA LUDHIANA CALL GIRL
MONA 98765-12871 CALL GIRLS IN LUDHIANA LUDHIANA CALL GIRL
 
Call Girls Service In Old Town Dubai ((0551707352)) Old Town Dubai Call Girl ...
Call Girls Service In Old Town Dubai ((0551707352)) Old Town Dubai Call Girl ...Call Girls Service In Old Town Dubai ((0551707352)) Old Town Dubai Call Girl ...
Call Girls Service In Old Town Dubai ((0551707352)) Old Town Dubai Call Girl ...
 
FULL ENJOY Call Girls In Mahipalpur Delhi Contact Us 8377877756
FULL ENJOY Call Girls In Mahipalpur Delhi Contact Us 8377877756FULL ENJOY Call Girls In Mahipalpur Delhi Contact Us 8377877756
FULL ENJOY Call Girls In Mahipalpur Delhi Contact Us 8377877756
 
Katrina Personal Brand Project and portfolio 1
Katrina Personal Brand Project and portfolio 1Katrina Personal Brand Project and portfolio 1
Katrina Personal Brand Project and portfolio 1
 
How to Get Started in Social Media for Art League City
How to Get Started in Social Media for Art League CityHow to Get Started in Social Media for Art League City
How to Get Started in Social Media for Art League City
 
Forklift Operations: Safety through Cartoons
Forklift Operations: Safety through CartoonsForklift Operations: Safety through Cartoons
Forklift Operations: Safety through Cartoons
 
Enhancing and Restoring Safety & Quality Cultures - Dave Litwiller - May 2024...
Enhancing and Restoring Safety & Quality Cultures - Dave Litwiller - May 2024...Enhancing and Restoring Safety & Quality Cultures - Dave Litwiller - May 2024...
Enhancing and Restoring Safety & Quality Cultures - Dave Litwiller - May 2024...
 
Dr. Admir Softic_ presentation_Green Club_ENG.pdf
Dr. Admir Softic_ presentation_Green Club_ENG.pdfDr. Admir Softic_ presentation_Green Club_ENG.pdf
Dr. Admir Softic_ presentation_Green Club_ENG.pdf
 

Comprehensive Ratio Analysis

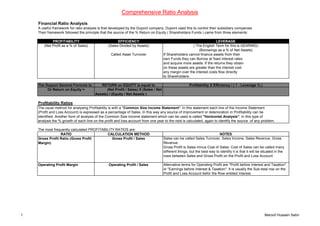
  • 1. Comprehensive Ratio Analysis Financial Ratio Analysis A useful framework for ratio analysis is that developed by the Dupont company. Dupont used this to control their subsidiary companies Their framework followed the principle that the source of the % Return on Equity ( Shareholders Funds ) came from three elements: PROFITABILITY EFFICIENCY LEVERAGE (Net Profit as a % of Sales) (Sales Divided by Assets) ( The English Term for this is GEARING) (Borowings as a % of Net Assets) Called Asset Turnover If Shareholders cannot finance assets from their own Funds they can Borrow at fixed interest rates and acquire more assets. If the returns they obtain on these assets are greater than the interest cost any margin over the interest costs flow directly to Shareholders. The Dupont General Formula is: RETURN on EQUITY is equal to Profitability X Efficiency / ( 1 - Leverage % ) Or Return on Equity = (Net Profit / Sales) X (Sales / Net Assets) / (Equity / Net Assets ) Profitability Ratios The usual method for analysing Profitability is with a "Common Size Income Statement". In this statement each line of the Income Statement (Profit and Loss Account) is expressed as a percentage of Sales. In this way any source of improvement or deterioration in Profitability can be identified. Another form of analysis of the Common Size Income statement which can be used is called "Horizontal Analysis". In this type of analysis the % growth of each line on the profit and loss account from one year to the next is calculated, again to identify the source of any problem. The most frequently calculated PROFITABILITY RATIOS are: RATIO CALCULATION METHOD NOTES Gross Profit Ratio (Gross Profit Gross Profit / Sales Sales can be called Sales Turnover, Sales Income, Sales Revenue, Gross Margin) Revenue Gross Profit is Sales minus Cost of Sales. Cost of Sales can be called many different things, but the best way to identify it is that it will be situated in the rows between Sales and Gross Profit on the Profit and Loss Account. Operating Profit Margin Operating Profit / Sales Alternative terms for Operating Profit are "Profit before Interest and Taxation" or "Earnings before Interest & Taxation". It is usually the Sub-total row on the Profit and Loss Account befor the Row entitled Interest. 1 Maroof Hussain Sabri
  • 2. Comprehensive Ratio Analysis Financial Ratio Analysis Profitability Ratios (Continued) The most frequently calculated PROFITABILITY RATIOS are: RATIO CALCULATION METHOD NOTES Profit Before Tax Margin Profit Before Interest & Tax / Sales Sales can be called Sales Turnover, Sales Income, Sales Revenue, Gross Revenue Profit before interest & tax can also be called "Earnings before Interest & Tax". It is the row on the Profit and loss Account before the row entitled Taxation. Net Profit Margin Net Profit / Sales Alternative terms for Net Profit are "Profit after Taxation", "Earnings after Tax" or "Net Income" . It is usually the last row on the Profit and Loss Account before the Row/s entitled Dividends. 2 Maroof Hussain Sabri
  • 3. Comprehensive Ratio Analysis Financial Ratio Analysis Efficiency Ratios Efficiency ratios deal with the efficiency with which Management has used the assets employed in the business. Various Asset Turnover ratios can be calculated and any improvement or deterioration in performance can be identified Commonly Calculated Efficiency Ratios are: RATIO CALCULATION METHOD NOTES Total Asset Turnover Sales / Net Assets Sales can be called Sales Turnover, Sales Income, Sales Revenue, Gross Revenue Expressed as a number of times eg 2.5 Net Assets = Fixed Assets + Net Current Assets (Net Current Assets = Current times Assets - Current Liabilities) Current Assets = Stocks ( Inventories ) + Debtors (Receivables) + Cash Current Liabilities = Creditors (Payables) + Overdraft Fixed Asset Turnover Sales / Fixed Assets Expressed as a number of times eg 2.5 times Stock (Inventory) Turnover Cost of Sales / Stocks Cost of Sales can be called many different things, but the best way to identify it is that it will be situated in the rows between Sales and Gross Profit on the Profit and Loss Account. Expressed as a number of times eg 2.5 times Can be expressed as a number of Days This is done by dividing the number of Times Stock is turned over into 365 Debtors (Receivables) Turnover Sales / Debtors Expressed as a number of times eg 2.5 times Can be expressed as a number of Days This is done by dividing the number of Times Stock is turned over into 365 Creditors (Payables) Turnover Total Annual Credit Purchases / This is not usually disclosed in Published Accounts Creditors Expressed as a number of times eg 2.5 times Can be expressed as a number of Days 3 Maroof Hussain Sabri
  • 4. Comprehensive Ratio Analysis Financial Ratio Analysis Combining Profitability and Efficiency Ratios Profitability and Efficiency Ratios can be combined together to calculate RATIO CALCULATION METHOD NOTES Return on Net Assets Net Profit / Net Assets Net Assets = Fixed Assets + Net Current Assets (Net Current Assets = Current Assets - Current Liabilities) Current Assets = Stocks ( Inventories ) + Debtors (Receivables) + Cash Current Liabilities = Creditors (Payables) + Overdraft Return on Capital Employed Operating Profit / Net Assets Alternative terms for Operating Profit are "Profit before Interest and Taxation" or "Earnings before Interest & Taxation". It is usually the Sub-total row on the Profit and Loss Account befor the Row entitled Interest. Net Assets = Capital Employed Capital Employed is the total amount invested in a business by Owners who have claims on Equity ( Share Capital + Retained Profits) and Providers of Loans who have claims on the business for the amounts of their loans and who receive interest. Neither of these ratios is theoretically perfect. Return on net assets is calculated after deduction of interest and Operating Profits are subject to Taxation after interest has been deducted. Operating profit flows to three destinations: THE GOVERNMENT ( Taxes on Profits); LENDERS (Interest) and SHAREHOLDERS (Dividends plus Retained Profits). Net Profit only flows to SHAREHOLDERS though a part of the NET ASSETS are Financed by LENDERS. Therefore a further Ratio has been suggested as being the true measure for a combination of Profitability and Efficiency Ratios RATIO CALCULATION METHOD NOTES NOPAT : NET ASSETS (Operating Profit minus Taxes) / Net NOPAT is Net Operating Profit After Taxes Assets NOPAT only flows to two destinations: LENDERS and SHAREHOLDERS who have financed NET ASSETS through LOANS and EQUITY 4 Maroof Hussain Sabri
  • 5. Comprehensive Ratio Analysis Financial Ratio Analysis Leverage or Gearing Ratios If Shareholders cannot finance assets from their own Funds they can Borrow at fixed interest rates and acquire more assets. If the returns they obtain on these assets are greater than the interest cost, any margin over the interest costs flow directly to Shareholders. RATIO CALCULATION METHOD NOTES Debt to Equity Ratio Long Term Debt / Equity Shareholders Equity Shareholders Funds is comprised of Share Capital plus retained Profits Funds % Debt to Net Assets Ratio Long Term Debt / Net Assets Net Assets = Fixed Assets + Net Current Assets (Net Current Assets = Current Assets - Current Liabilities) Net Assets = Capital Employed Capital Employed is the total amount invested in a business by Owners who have claims on Equity ( Share Capital + Retained Profits) and Providers of Loans who have claims on the business for the amounts of their loans and who receive interest. RATIO CALCULATION METHOD NOTES Return on Equity Net Profit / Equity Equity Shareholders Funds is comprised of Share Capital plus retained Profits Also Known as Return on Shareholders Funds REMEMBER RETURN on EQUITY is equal to Profitability X Efficiency / ( 1 - Leverage % ) Or Return on Equity = (Net Profit / Sales) X (Sales / Net Assets) / (Equity / Net Assets ) Liquidity Ratios These are of use to those who have lent money to the company or are supplying goods on credit to the company. They are a measure of how easily current assets can be turned into cash to pay lenders or suppliers RATIO CALCULATION METHOD NOTES Current Ratio Current Assets / Current Liabilities Current Assets = Stocks ( Inventories ) + Debtors (Receivables) + Cash Current Liabilities = Creditors (Payables) + Overdraft Quick Ratio or Acid Test Ratio (Cash + Debtors) / Current Liabilities Debtors should be able to be converted into cash quickly to pay current liabilities 5 Maroof Hussain Sabri
  • 6. Comprehensive Ratio Analysis Financial Ratio Analysis Ratios and Other Statistical Data which can be used by POTENTIAL INVESTORS in a Company Before an investment in a company is considered a thorough analysis of the data pertaining to the company should be undertaken. Financial Analysts refer to this as Fundamental Analysis. It comprises of a calculation of the ratios outlined above as well as additional calculations outlined below. The investors may be Providers of Loans, for which they will receive returns in the form of interest payments. Or these investors may wish to purchase Ordinary Shares in the Company. In this case returns they receive will be in the form of Capital Gains from increases in the share price plus Income from Dividends. Additional Ratios for Lenders RATIO / STATISTIC CALCULATION METHOD NOTES Interest Cover Operating Profit / Interest The higher this ratio the more likely it is that a company will be able to meet its interest payments in the event of a deterioration in its trading situation Usually expressed as a Number of Times The level of interest cover also determines the Interest Costs a company will (US Terminology Times Interest Earned) pay for loans. Lower levels of Interest Cover mean that the Company is more risky to lend to, so if it is more risky the lenders will require higher returns. Additional Ratios for Investors in Ordinary Shares RATIO / STATISTIC CALCULATION METHOD NOTES Current Share Price Market Quotation Prices are quoted in the "Serious Press" and on Bloomberg.co.uk or http://www.finance.yahoo.co.uk Earnings per Share Net Profit / Number of shares in issue Will be quoted on Bloomberg & Yahoo Finance. Also shown prominently in Companies' Published Accounts Price / Earnings Ratio Curent Share Price / Earnings Per Price Earnings (PE) Ratios are quoted in the serious press and on Bloomberg Share & Yahoo Finance. PE Ratios tend to be similar for companies in a particular Industrial sector. Companies with higher PE ratios tend to be in favour with investment fund managers who control large investment funds for pensions, Insurance companies and Investment trusts. A low price earnings ratio may also indicate that the Company is undervalued, and an investment in its shares may yield possible capital gains. Dividend per share Annual Reported Dividend per Share Will be quoted on Bloomberg & Yahoo Finance. Also shown prominently in Companies' Published Accounts Dividend Cover Net Profit after tax / Dividends or Gives some indication of certainty of dividend, but note that companies can Earnings per share / Dividend per still pay dividends when they are making losses share Dividend Yield % Dividend per Share / Current Share Will be quoted on Bloomberg & Yahoo Finance. Also shown prominently in Price Companies' Published Accounts 6 Maroof Hussain Sabri
  • 7. Comprehensive Ratio Analysis Financial Ratio Analysis Ratios and Other Statistical Data which can be used by POTENTIAL INVESTORS in a Company Additional Ratios for Investors in Ordinary Shares RATIO / STATISTIC CALCULATION METHOD NOTES Market Capitalisation Current Share Price Multiplied by Market Capitalisations for companies are quoted in the "Serious Press" and Number of shares in issue on Bloomberg.co.uk or http://www.finance.yahoo.co.uk Total Shareholder Return The increase in value of an investment Data for this calculation can be obtained from Yahoo Finance, share price in a company's ordinary shares over a history. period of years (Usually 3 or 5 Years) assuming that all dividends are reinvested in the company at the share price on the date when dividends are received Book to Market Ratio Market Capitalisation / Equity The book to market ratio is important, since studies have shown that Shareholders Funds Companies with low book to market ratios provide greater long term returns than those with higher Book to Market Ratios in the same industrial sector Price Earnings Relative A measure of the relationship between the Price Earnings Ratio for a Company and the P.E. Ratio for the Market as a whole. Published in Bloomberg and Yahoo Finance. Dividend Yield Relative A measure of the relationship between the Dividend Yield for a Company and the Dividend Yield for the Market as a whole. Published in Bloomberg and Yahoo Finance. Retentions Percentage Retained Profit / Net Profit Sustainable Growth Rate Retentions Percentage Multiplied by The theory is that companies retain profits to invest and in doing so should Return on Equity (Return on obtain at least the same level of Return on Equity for the profits retained for a Shareholders Funds) year as it gets on what it has invested previously. BETA Published on Yahoo Finance & BETA is a statistical measure which indicates how individual share prices Bloomberg.com move up and down as the market as a whole moves up and down. Company shares with a BETA of 1 move up and down exactly as the Market Moves up and down. Company shares with a BETA of less than 1 move up less than the market when the market is going up and move down less than the market when the market is going down. These are known as DEFENSIVE SHARES. Company shares with a BETA of more than 1 rise more than the market when the market is rising and move down more than the Market when the market is falling. These are known as AGGRESSIVE or SEASONAL Shares 7 Maroof Hussain Sabri
  • 8. Comprehensive Ratio Analysis Financial Ratio Analysis Share Valuation Methods Investment fund managers are looking for two things when they decide to make investments. Firstly they are looking for income from dividends and secondly they are looking for potential share price growth. They assess potential share price growth by calculating an INTRINSIC VALUE for a share. One of the most frequently used methods is to calculate the required return for a share using the CAPITAL ASSET PRICING MODEL. The Capital Asset Pricing Model (CAPM) is a financial theory which states that the required return for a share should be equal to a RISK FREE RATE plus BETA multiplied by the MARKET RISK PREMIUM. The MARKET RISK PREMIUM is the difference between the MARKET RATE OF RETURN and THE RISK FREE RATE. The RISK FREE RATE is generally assumed to be the rate of return on short term government bonds such as Treasury Bills. At 1.1.2005 this rate is approximately 5% per annum. Over a period of years the MARKET RATE OF RETURN has been 10% per Annum, thus THE MARKET RISK PREMIUM is 5% (10% - 5%). For a share with a BETA of 1.5, the required rate of return would this be 5% + 1.5 (10% - 5%) = 12.5%. The REQUIRED RATE OF RETURN is then plugged into a formula for calculating the INTRINSIC VALUE of a share, which is based on the assumption that CURRENT DIVIDENDS will grow at a percentage GROWTH RATE determined by SUSTAINABLE GROWTH. This is known as THE DIVIDEND DISCOUNT MODEL. The formula for this model is : INTRINSIC SHARE VALUE = (CURRENT DIVIDEND) Multiplied by (1 + Growth Rate) / (REQUIRED RATE OF RETURN - GROWTH RATE) Thus if a share had a dividend of 20p per share, a Growth Rate of 5% pa and a Required Rate of Return of 12.5% the Intrinsic Value would be: 20 X 1.05 / (12.5% - 5%) = 280p The INTRINSIC VALUE is then compared with the Current Share Price. If the INTRINSIC VALUE is substantially greater than the Current Share price BUY, if it is substantially less then SELL. Financial Ratio Analysis A word of warning Financial ratio analysis is useful in highlighting potential problems with a company, but it cannot provide all the answers for an Investment Decision. Before investing a full analysis of the Economy, Market and Company's competitive position should be also examined. 8 Maroof Hussain Sabri