
Recomendados
Más contenido relacionado
La actualidad más candente
La actualidad más candente (20)
Similar a Wayne crews ten thousand commandments - 10 kc - 2010
Similar a Wayne crews ten thousand commandments - 10 kc - 2010 (20)
Último
Último (20)
Wayne crews ten thousand commandments - 10 kc - 2010
- 1. Ten Thousand Commandments An Annual Snapshot of the Federal Regulatory State by Clyde Wayne Crews Jr. Competitive Enterprise Institute
- 2. Ten Thousand Commandments An Annual Snapshot of the Federal Regulatory State 2010 Edition by Clyde Wayne Crews Jr. Executive Summary President Barack Obama’s federal budget for Regulation: A Hidden Tax fiscal year (FY) 2011 proposes $3.83 tril- lion in discretionary, entitlement, and inter- Those costs fully convey the federal govern- est spending.1 In the previous fiscal year, the ment’s on-budget scope, and they are so- president had proposed $3.552 trillion. For reference, George W. Bush had proposed bering enough. Yet the government’s reach The government’s the first-ever $3 trillion U.S. budget. In fact, extends well beyond the taxes that Washing- President Bush was also the first to propose a ton collects and the deficit spending and bor- reach extends well rowing now surging. Federal environmental, $2 trillion federal budget—in 2002, a scant eight years ago.2 safety and health, and economic regulations beyond the taxes cost hundreds of billions of dollars every year over and above the costs of the official federal that Washington Meanwhile, the Congressional Budget Office (CBO) projects FY 2010 spending will end outlays that now dominate the policy agenda. collects and the up at $3.524 trillion.3 The result: thanks to the bailout and “stimulus” frenzy, a projected Firms generally pass along to consumers the deficit spending FY 2010 deficit of a previously unthinkable costs of some taxes. Likewise, some regula- $1.349 trillion, down slightly from 2009.4 tory compliance costs that businesses face and borrowing will find their way into consumer prices. To be sure, many other countries’ govern- Precise regulatory costs can never be fully now surging. ments consume more of their national known, because, unlike taxes, they are un- output than the U.S. government does.5 budgeted and often indirect. But scattered However, in absolute terms, the U.S. gov- government and private data exist on scores ernment is the largest government on planet of regulations and on the agencies that issue Earth, whether one looks at revenues or ex- them, as well as on regulatory costs and ben- penditures.6 efits. Some of that information can be com- Crews: Ten Thousand Commandments 2010 1
- 3. piled to make the regulatory state somewhat Center at George Mason University in more comprehensible. That is one purpose Arlington, Virginia, jointly estimate that of the annual Ten Thousand Commandments agencies spent $54.3 billion to adminis- report, highlights of which appear next. ter and police the regulatory enterprise. Adding the $1.187 trillion in off-budget • A very rough extrapolation from an compliance costs brings the total regula- evaluation of the federal regulatory tory burden to $1.24 trillion. enterprise by economist Mark Crain esti- • The 2009 Federal Register dropped mates that annual regulatory compliance significantly from its all-time high of costs hit $1.187 trillion in 2009. 79,435 pages in 2008. It fell nearly 14 • Given 2009’s actual government spend- percent to 68,598. ing of $3.518 trillion, the regulatory • Federal Register pages devoted specifi- “hidden tax” stood at 34 percent of the cally to final rules fell by 21 percent, level of federal spending itself. (Because from a record 26,320 in 2008 to 20,782 of the recent federal spending surge, this in 2009. proportion is lower than the near–40 • In 2009, agencies issued 3,503 final percent level of recent years.) rules, an 8.5-percent drop from 3,830 • The dramatic reality that regulations rules in 2008. and deficits now each exceed $1 trillion • The annual outflow of roughly 4,000 a year is an unsettling new development final rules has meant that nearly 60,000 for America. In 2008, regulatory costs rules have been issued since 1995. were more than double that year’s $459 • Although regulatory agencies issued billion budget deficit. Now, the 2009 3,503 final rules in 2009, Congress deficit spending surge has catapulted the passed and the president signed into law deficit well above the costs of regulation a comparatively few 125 bills. Consider- ($1.414 trillion compared to $1.187 tril- able lawmaking power is delegated to lion, respectively). unelected bureaucrats at agencies. • The game has changed, with respect to • According to the 2009 Unified Agenda, government spending versus govern- which lists federal regulatory actions at ment regulation. Although the spending various stages of implementation, 59 and deficit levels eclipse federal regula- federal departments, agencies, and com- tory costs now, unchecked government missions have 4,043 regulations in play spending can translate, in later years, at various stages of implementation. into greater regulation as well. • Of the 4,043 regulations now in the • Regulatory costs are equivalent to 63 pipeline, 184 are “economically signifi- percent of all 2007 corporate pretax cant” rules wielding at least $100 million profits of $1.89 trillion. in economic impact. Assuming those • Regulatory costs dwarf corporate income rulemakings are primarily regulatory taxes of $147 billion. rather than deregulatory, that number • Regulatory costs exceed estimated 2009 implies roughly $18 billion yearly in individual income taxes of $953 billion future off-budget regulatory effects. by 25 percent. • “Economically significant” rules in- • Regulatory costs of $1.187 trillion creased by 2 percent between 2008 and absorb 8.3 percent of the U.S. gross 2009 (following 13- and 14-percent domestic product (GDP), estimated at increases in the prior two years). High $14.253 trillion in 2009. federal budgetary spending now likely • Combining regulatory costs with federal implies higher future regulatory costs as FY 2009 outlays of $3.518 trillion im- well. plies that the federal government’s share • The five most active rule-producing of the economy now reaches 33 percent. agencies—the departments of the Trea- • The Weidenbaum Center at Washington sury, Agriculture, Commerce, and the University in St. Louis and the Mercatus Interior, along with the Environmental 2 Crews: Ten Thousand Commandments 2010
- 4. Protection Agency—account for 1,763 the other. If regulatory costs remain largely rules, or 44 percent of all rules in the hidden from public view, regulating will be- Unified Agenda pipeline. come increasingly attractive compared with • Of the 4,043 regulations now in the increasingly unpopular taxing and spending. works, 758 affect small business. Disclosure and Accountability Liberate to Stimulate? Like federal spending, each agency’s stream The short-lived string of budgetary sur- of regulations and their costs should be pluses enjoyed from 1998 to 2001 (the first tracked and monitored each year. Cost-ben- since 1969) seems like ancient history—even efit analysis of rules is the usual approach The short-lived inconceivable—in today’s spending culture. suggested for policing regulation. A problem Indeed, CBO projects no surpluses whatso- with cost-benefit analysis, however, is that string of budgetary ever over the coming decade, merely deficits it largely amounts to agency self-policing. of hundreds of billions each year (the “low- Agencies that perform “audits” of their own surpluses enjoyed est,” of $475 billion, in 2014).7 However, if rules would rarely admit that a rule’s benefits regaining and maintaining an honest surplus do not justify the costs involved. At the least, from 1998 to ever again become political priorities, policy makers must control regulatory costs as well. some third-party review is needed, and cost- benefit analysis at the agency level is already 2001 seems The dramatic fact of regulations and defi- controversial. like ancient cits now each exceeding $1 trillion a year is an unsettling new development for America. Another approach is to leapfrog the cost- history—even The deficit is already widely—and appropri- benefit debate and go back to the source of ately—criticized by the media, citizens, and delegation to the agencies. Congress should inconceivable—in policy makers, but reducing the scope of the answer for the compliance costs (and ben- regulatory state and fostering a “deregula- efits) of federal regulations. Requiring ex- today’s spending tory stimulus” should occupy policy mak- pedited votes on economically significant ers as well. When it comes to stimulating a or controversial agency rules before they culture. limping economy, reducing both deficits and become binding on the population would regulations is critical. reestablish congressional accountability and would help fulfill the principle of “no regula- Without better regulatory oversight and tion without representation.” monitoring—without an effort to “liberate to stimulate”—the urgency of deficit reduc- Disclosing regulatory costs remains impor- tion invites lawmakers to opt for off-budget tant even if Congress approves rules. Open- regulations on the private sector rather than ness about regulatory facts and figures is adding to already unchecked deficit spend- critical, just as disclosure of program costs is ing. Taxation and regulation can substitute critical in the federal budget. Simple federal for each other. A new government pro- regulatory “report cards,” similar to the pre- gram—for example, job training—would sentation in Ten Thousand Commandments, require either increasing government spend- could be officially issued each year to distill ing on the one hand, or imposing new rules information to the public and policy makers and regulations requiring such training on about the scope of the regulatory state. Crews: Ten Thousand Commandments 2010 3
- 5. Overview: Toward Ending “Regulation without Representation” The federal government funds new programs government can require the private sector either by raising taxes or by borrowing money (and state and local governments) to pay for —with a promise to repay, with interest, from federal initiatives through compliance costs. future tax collections. However controver- Congress sial government spending programs may be, Because disclosure of, and accountability can escape taxpayers can examine costs in the federal budget. Congress’s spending accountability, for, regulatory costs are both spotty, policy makers can afford to be cavalier about im- accountability though imperfect, is a necessary condition for posing regulatory costs relative to under- government’s accountability to voters. taking ordinary but more publicly visible by blaming the government spending. Where regulatory The government can also “fund” programs compliance costs prove burdensome, Con- agency that issued or achieve its objectives by regulating the gress can escape accountability by blaming private sector, thereby advancing federal the agency that issued the unpopular rule. the unpopular rule. government initiatives or goals without us- Because regulatory costs are not budgeted ing tax dollars. Rather than pay directly and and because they lack the formal public dis- book expenses for new initiatives, the federal closure that accompanies federal spending, Table 1. The Regulatory State: A 2010 Overview Year-End 1-Year 5-Year Change 10-Year Change 2009 Change (2005-2009) (2000-2009) Total regulatory costs $1.187 trillion n/a n/a n/a Agency enforcement budgets $54.3 billion 13.00% 20.0% 71.0% Federal Register pages 68,598 –13.64% –7.1% –7.6% Federal Register pages devoted to final rules 20,782 –21.00% –9.8% –15.1% Federal Register final rules 3,503 8.50% –11.1% –18.8% Total rules in Agenda 4,043 1.00% –0.5% -14.0% “Economically significant” rules in the pipeline 184 2.20% 34.3% 16.4% Rules affecting small business 758 0.70% –3.8% –28.0% Rules affecting state governments 514 0.20% –1.7% –24.3% Rules affecting local governments 328 5.10% –5.2% –22.0% FCC Breakdown Total number of FCC rules in Agenda 145 1.4% 1.4% 5.8% FCC rules affecting small business 10 3.8% –2.6% 4.8% Note: n/a = not applicable. 4 Crews: Ten Thousand Commandments 2010
- 6. regulatory initiatives can allow federal direc- 2. An analysis of trends in the numbers of tion of private-sector resources with com- regulations issued by agencies on the paratively little public fuss—thus rendering basis of information provided in the regulation a form of off-budget taxation. Federal Register and in “The Regulatory Table 1 provides some perspective on the Plan and the Unified Agenda of Federal regulatory “tax” by presenting summary data Regulatory and Deregulatory Actions.” for selected topics described in Ten Thou- sand Commandments. Trends over the past 3. Recommendations for reform that em- few years are provided where information is phasize ending “regulation without rep- available. resentation.” This section offers steps to improve regulatory cost disclosure and Ten Thousand Commandments for 2010 con- to increase congressional accountability. tains four basic sections: It contrasts those steps with the agency- driven cost-benefit analysis emphasized 1. An overview of the costs and scope of in typical reform proposals. the regulatory state, such as its esti- mated size compared with the federal 4. An appendix containing historical budget and the gross national product tables of regulatory trends over the past (GNP). several years. Crews: Ten Thousand Commandments 2010 5
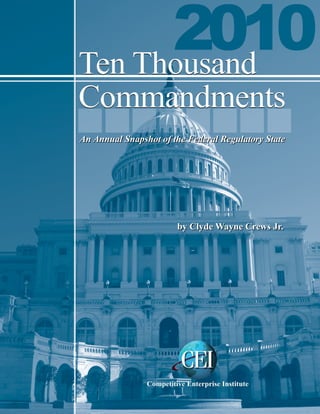
- 7. The Regulatory State and Its Cost The 2009 Draft Report to Congress from the trend in regulatory costs that prevailed be- Office of Management and Budget (OMB) tween 2000 and 2004 yields a very rough on regulatory costs and benefits pegs the estimate of $1.187 trillion for 2009.11 Figure cumulative costs of 99 selected major regu- 1 breaks down the regulatory cost estimate lations during 1998–2008 at between $51 by categories: economic, environmental, tax billion and $60 billion. Meanwhile, the esti- compliance, and workplace. Economic costs, mated range for benefits was between $126 the largest category at $630 billion, include billion and $663 billion.8 the noted price-and-entry controls on busi- ness and losses from economic transfers.12 OMB’s cost-benefit breakdown incorpo- But the current tabulation does not include rates only benefits and costs that agencies recent regulatory interventions related to the or OMB have expressed in quantitative and various stimulus and bailout programs and monetary terms, thus omitting many catego- other developments since 2004. And given ries and cost levels of rules altogether. Cost- that indirect costs—such as the effects of Per-employee benefit analyses are also sensitive to basic lost innovation or productivity—are not in- assumptions about how regulations translate cluded in Crain’s analysis, this figure can fur- regulatory costs into benefits. ther understate the total regulatory burden.13 for firms of fewer Regulatory benefits are beyond the scope Examination of Cost than 20 workers Assessments of the Crain analysis, although those ben- efits would be recognized as offsetting some can be more costs.14 The Crain report also notes the ex- For an overall cost assessment of the en- tent to which regulatory costs impose higher than 40 percent tire regulatory enterprise, W. Mark Crain of burdens on small firms, for which per-em- Lafayette College prepared a comprehensive ployee regulatory costs are higher. Table 2 greater than for estimate for 2005 for the Small Business Ad- shows, for 2004, how per-employee regula- ministration.9 This report assessed economic larger firms. regulatory costs (for example, price-and-en- tory costs for firms of fewer than 20 workers can be more than 40 percent greater than for try restrictions and “transfer” costs, such as larger firms (more than $7,600 for smaller price supports, which shift money from one firms versus $5,300 for larger ones).15 pocket to another); workplace costs; envi- ronmental regulatory costs; and paperwork Regulation Catching up with costs (for example, tax compliance). Crain estimated regulatory costs of $1.113 tril- Government Spending lion for 2004. (His calculations updated an October 2001 report by Crain and Thomas After nearly three decades of deficit spend- Hopkins that noted regulatory costs of $843 ing, the federal government temporarily bal- billion.10) anced the budget from FY 1998 through FY 2001. (The total surplus was $128 billion Adjusting Crain’s 2005 annual regulatory in FY 2001.16)Those days are history. In FY cost estimate by extrapolating the growth 2009, a deficit of $1.414 trillion was posted 6 Crews: Ten Thousand Commandments 2010
- 8. Figure 1. 2009 Federal Regulatory Costs, $1.187 Trillion Tax Compliance $208 billion Environmental $236 billion Workplace $113 billion Economic $630 billion Source: Rough extrapolation from W. Mark Crain, “The Impact of Regulatory Costs on Small Firms,” report prepared for the Small Business Administration, Office of Advocacy, Contract No. SBHQ-03-M-0522, September 2005, http://www.sba.gov/advo/research/rs264tot.pdf. Table 2. Per-Employee Regulatory Costs Higher for Small Firms (2004) Size of Firm Regulatory Costs per Employee Large > 500 employees $5,282 Medium 20-499 employees $5,411 Small < 20 employees $7,647 Source: W. Mark Crain, “The Impact of Regulatory Costs on Small Firms,” report prepared for the Small Business Administration, Office of Advocacy, Contract No. SBHQ-03-M-0522, September 2005, p. 5, http:// www.sba.gov/advo/research/rs264tot.pdf. on $3.518 trillion in outlays with no surplus in 2009 dropped to the equivalent of 33.7 at all projected over the coming decade.17 (In percent of spending of the $3.518 trillion. FY 2008, the figures were $459 billion and The proportion between 2009 and earlier $2.98 trillion, respectively.18) years is lower not because today’s calculated regulatory costs are lower, but because of the Figure 2 compares deficits and outlays dur- jump in federal outlays. ing 2007–2009 with Crain’s regulatory cost estimates, along with a projection for 2010. In recent years, the costs of regulation had Note that the regulatory hidden tax in recent been more than double the federal deficit. years has approached roughly 40 percent of Now, in the wake of the economic downturn the size of budgeted government. The ap- and escalated federal spending, the deficit proximate $1.187 trillion in regulatory costs has ballooned to eclipse the costs of regula- Crews: Ten Thousand Commandments 2010 7
- 9. Figure 2. Off-Budget Regulatory Costs Compared with Federal Spending (2007–2009 and projected 2010) $4,000 $3,518 $3,524 $3,500 $2,983 $3,000 $2,731 Billions of Dollars $2,500 $2,000 $1,187 $1,187 $1,414 $1,349 $1,500 $1,172 $1,157 $1,000 $459 $500 $163 $0 2007 2008 2009 2010 Year Deficit Regulatory Costs Federal Outlays Sources: The 2007–2008 deficit and outlays are from Congressional Budget Office, The Budget and Economic Outlook, 2008–2009 editions; 2009–2010 deficit and outlays are from the 2010 edition; Table 1-3, January 2010, http://www.cbo.gov/ftpdocs/108xx/doc10871/01-26-Outlook.pdf. Regulatory costs 2007–2010 are based on W. Mark Crain, “The Impact of Regulatory Costs on Small Firms,” report prepared for the Small Business Administration, Office of Advocacy, Contract No. SBHQ-03-M-0522, September 2005, http://www.sba.gov/advo/research/rs264tot.pdf. Note: Regulatory costs are a rough projection based on average annual increases in regulatory costs between 2000 and 2004 from Crain, 2005. Federal deficit and outlay numbers are by fiscal year; regulatory costs are by calendar year. Deficit now eclipses regulatory costs. tion. In a sense, regulations themselves con- again exceed $3.5 trillion thanks to the late- stitute off-budget deficit spending—the costs 2008 bailout and subsequent “stimulus” of federal requirements that the population frenzy. is compelled to bear, so to pair the two is ap- propriate. Given the months-old spending surge, New spending regulatory costs, although at record highs, related to bailouts The federal spending surge heralds are lower as a proportion of surging federal spending, but there is no silver lining here— new regulation. and stimulus will higher spending will eventually translate into higher future regulatory costs. Any spend- have regulatory Contemplating off-budget regulatory com- ing related to such bailout and “stimulus” as pliance costs that approach half the official infrastructure, banking restructuring, energy cost implications federal budget was disconcerting enough, efficiency mandates, and the like will in- but the situation is more precarious now clude significant regulatory components as too. given Washington’s new high-spending cul- well (for example, salary cap proposals with ture. Note again in Figure 2 the sea change respect to bank bailouts, as well as “open ac- that occurred between 2008 and 2009 in cess” proposals with respect to telecommuni- the deficit compared with regulation. Now, cations infrastructure spending). That analy- CBO projects actual FY 2010 spending to sis bears repeating: New spending related to 8 Crews: Ten Thousand Commandments 2010
- 10. bailouts and stimulus will have future regula- Because such regulatory costs are not bud- tory cost implications too. geted and lack the formal public disclosure of federal spending, they may generate com- Deficit spending that eclipses paratively little public outcry. Regulation thus becomes a form of off-budget or hidden regulation has ominous implications. taxation. The $1.414 deficit of 2009 and the CBO- As the mounting federal debt causes con- Trillion-dollar projected deficit for FY 2010 of $1.349 tril- cern, the impulse to regulate instead can lion both eclipse the cost of regulation and also mount. Deficit spending, in a manner deficits and of speaking, can manifest itself as regulatory are larger than all federal budget outlays as recently as 2000.19 Indeed, the days of a compliance costs that go largely unacknowl- regulatory costs $2-trillion federal budget are long past. Presi- edged by the federal government. Worse, if regulatory compliance costs prove burden- in the trillions are dent George W. Bush—only two years ago— presented the first $3 trillion budget. CBO some, Congress can escape accountability by both unsettling now projects FY 2010 outlays of a staggering blaming the agencies that issue the unpopu- $3.524 trillion. lar rules. new developments Trillion-dollar deficits and regulatory costs Regulatory Costs versus Income for America. in the trillions are both unsettling new de- Taxes and Corporate Profits velopments for America. It is sobering to note how both dwarf the initial $150-billion Regulatory costs now comfortably exceed the “stimulus package” of early 2008, which cost of individual income taxes, and those comprised the tax rebates that were to resur- costs vastly exceed revenue from corporate rect the economy at that time. Where we go taxes. As Figure 3 shows, regulatory costs from here is a tough call. In March 2009, now tower over the estimated 2009 individ- House Budget Committee Chair John Spratt ual income taxes of $953 billion (individual (D-S.C.) indicated how quickly circum- income tax receipts have fallen substantially stances can change: in the economic downturn).21 Corporate income taxes, estimated at $147 billion, are Economic forecasting is a risky busi- dwarfed by regulatory costs (and themselves ness. A year ago, economists pro- have declined by half in the downturn).22 As jected a deficit of about $200 billion the last bar of Figure 3 shows, regulatory cost for 2009. Economists now project a levels rise to well over half the level of pretax deficit about nine times that large, corporate profits, which were $1.886 tril- due mainly to extraordinary events lion in 2007.23 (Note that corporate profits that no one foresaw a year ago.20 will be far lower in upcoming editions of Ten Thousand Commandments.) A retreat from deficit spending could For a global perspective, U.S. regulatory mean more regulation. costs of $1.187 trillion exceed the output of many major national economies. Figure As noted in the introductory summary, taxa- 4 shows that U.S. regulatory costs nearly tion and regulation can substitute for each equaled the entire 2007 gross national in- other because regulation can advance govern- come (GNI) of Canada, which stood at ment initiatives without using tax dollars. $1.307 trillion. The regulatory burden also Rather than pay directly and book expenses exceeded Mexico’s GNI of $989 billion.24 for new programs, the government can re- For the United States, the CBO estimated quire the private sector (and state and local 2009 GDP at $14.253 trillion.25 Total regu- governments) to pay for federal initiatives latory costs of $1.187 trillion are equivalent through compliance costs. to 8 percent of that amount. Combining reg- Crews: Ten Thousand Commandments 2010 9
- 11. Figure 3. Regulatory Costs Compared with Individual Income Taxes, Corporate Income Taxes, and Corporate Pretax Profits $2,000 $1,886 $1,600 Billions of Dollars $1,187 $1,200 $953 $800 $400 $147 $0 Regulatory Individual Corporate Corporate Costs Income Income Profits Taxes Taxes Sources: W. Mark Crain, “The Impact of Regulatory Costs on Small Firms,” report prepared for the Small Business Adminis- tration, Office of Advocacy, Contract No. SBHQ-03-M-0522, September 2005, http://www.sba.gov/advo/research/rs264tot.pdf. Tax figures from U.S. Census Bureau, Statistical Abstract of the United States: 2010, Table 463, “Federal Budget Receipts by Source: 1990 to 2009,” http://www.census.gov/compendia/statab/2010/tables/10s0463.pdf. Profits from U.S. Census Bureau, Statistical Abstract of the United States: 2010, Table 76, “Corporate Profits before Taxes by Industry: 2000 to 2007,” http://www.census.gov/compendia/statab/2010/tables/10s0769.pdf. Profits do not reflect inven- tory valuation and capital consumption adjustments. Figure 4. U.S. Regulatory Costs Compared with Mexico’s and Canada’s Gross National Income $1,500 $1,307 $1,157 $1,200 $989 Billions of Dollars $900 $600 $300 $0 U.S. Regulatory Mexico GDP Canada GDP Costs Sources: W. Mark Crain, “The Impact of Regulatory Costs on Small Firms,” report prepared for the Small Business Adminis- tration, Office of Advocacy, Contract No. SBHQ-03-M-0522, September 2005, http://www.sba.gov/advo/research/rs264tot.pdf. GNI figures for Canada and Mexico are from U.S. Census Bureau, Statistical Abstract of the United States: 2010, Table 1312, “Gross National Income (GNI) by Country: 2000 and 2007,” http://www.census.gov/compendia/statab/2010/ tables/10s1312.pdf. 10 Crews: Ten Thousand Commandments 2010
- 12. Figure 5. Agency Enforcement Budgets, 2000–2009 (billions of constant 2008 dollars) $54.3 billion total in FY 2009 60 7.7 50 7.4 5.9 7.0 6.5 6.8 6.4 40 Billions of Dollars 6.0 5.5 5.6 30 46.6 38.4 40.7 41.8 36.8 36.9 38.0 20 27.4 32.4 26.3 10 0 2000 2001 2002 2003 2004 2005 2006 2007 2008 2009 Year Economic Regulation Social Regulation Sources:Veronique de Rugy and Melinda Warren, “Expansion of Regulatory Budgets and Staffing Continues in the New Administration: An Analysis of the U.S. Budget for Fiscal Years 2009 and 2010,” Regulators’ Budget Report 31, published jointly by the Weidenbaum Center and the Mercatus Center, October 2009, p. 28, http://mercatus.org/sites/default/files/publication/Regulators-Budget-Report-Final-Version-October-29.pdf. Original 2000 constant dollars are adjusted by the change in the consumer price index between 2000 and 2008, derived from U.S. Census Bureau, Statistical Abstract of the United States: 2010,Table 709, “Consumer Price In- dexes (CPI-U) by Major Groups: 1990 to 2008,” http://www.census.gov/compendia/statab/2010/tables/10s0709.pdf. ulatory costs with federal FY 2009 outlays of administrative costs of developing and en- $3.518 trillion indicates that the federal gov- forcing regulations. Because those funds ernment’s share of the economy (of GDP) are amounts that taxpayers pay to support now reaches 33 percent. agencies’ administrative budgets, rather than compliance costs paid by the regulated par- The Federal Government’s Costs ties, the amounts are disclosed in the federal budget. of Policing the Regulatory State FY 2009 enforcement costs incurred by fed- The Crain regulatory cost estimates encom- eral departments and agencies stood at $54.3 pass compliance costs paid by the public and billion (constant 2008 dollars), a 13-percent by state and local governments. But those increase over the previous year (Figure 5).26 estimates do not include the costs of admin- Of that amount, $7.7 billion was spent ad- istering the regulatory state—the on-budget ministering economic regulation. The larger amounts spent by federal agencies to pro- amount spent for writing and enforcing so- duce rules and to police regulatory compli- cial and environmental regulations was $46.6 ance. The Weidenbaum Center at Washing- billion. Those enforcement costs help com- ton University in St. Louis and the Mercatus plete the picture of the federal regulatory ap- Center at George Mason University in paratus. Adding the $54.3 billion in admin- Arlington, Virginia, together examined the istrative costs tabulated by the Weidenbaum federal budget to excerpt and compile the Center and Mercatus Center to the $1.187 Crews: Ten Thousand Commandments 2010 11
- 13. trillion in the Crain estimate for compliance 2001 were largely attributable to the newly costs brings the total estimated 2009 regula- created Transportation Security Administra- tory burden to roughly $1.24 trillion. tion’s (TSA) hiring of thousands of airport personnel. Over the past year alone, staff- Estimated full-time-equivalent employ- ing is up by 7 percent. (According to a 2008 ment staffing reached 266,300 in FY 2009, analysis, even excluding the new TSA per- according to the Weidenbaum and Merca- sonnel, government staffing rose at that time tus report. That figure is 54 percent above by nearly 11 percent, and costs increased by staffing levels in 2000. The surges after 30 percent.27) 12 Crews: Ten Thousand Commandments 2010
- 14. Federal Register The Federal Register is the daily depository was 75,676 pages in 2004.) Note that the of all proposed and final federal rules and new count for 2009 is 68,598, a very sub- regulations. The number of pages in the Fed- stantial drop of nearly 14 percent. eral Register is probably the most frequently cited measure of regulation’s scope. Yet seri- Analysis of Pages in the Federal ous problems exist with using the number of pages alone as a proxy for regulation. For ex- Register ample, in 2002, several thousand pages per- tained to the Justice Department’s Microsoft Future analysis may tell the tale more com- settlement—important, but not a very good pletely, but there are at least three potential gauge of what was going on government- explanations for the drop in Federal Register wide. Many newer rules address homeland pages (and, as will be seen, actual number of security, an important general pursuit regard- rules finalized) in 2009: less of specific policy battles. Even campaigns to reduce regulation and lessen burdens in- • The 2009 drop is exaggerated relative to volve agencies’ posting lengthy notices in the the normal page fluctuations since Presi- Federal Register. dent Bush issued a flurry of “midnight regulations” at the end of his term in And, of course, there are the more obvious 2008,28 the record year for Federal Register problems with relying on page counts: The pages. Whether any particular president’s wordiness of rules will vary, thus affecting homestretch regulations (the phenom- the number of pages and obscuring the real enon has a long history) are designed to effects of the underlying rules. A short rule mitigate and ease earlier rules (which also The wordiness could be costly and a lengthy one relatively requires Federal Register notice and com- cheap. Furthermore, the Federal Register ment) or to add actual new rules requires of rules will vary, contains administrative notices, corrections, presidential statements, and other material. analysis separate from this report. In any event, apart from midnight regula- thus affecting the And hundreds, even thousands, of blank tions, the current 2009 level still marks a number of pages pages sometimes appear owing to the Gov- decline from the years before 2008. ernment Printing Office’s imperfect predic- • President Obama’s appointment of a and obscuring the tion of the number of pages a given agency director of the Office of Information will require. and Regulatory Affairs (OIRA) who is real effects of the favorable toward cost-benefit analysis Despite limitations, it remains worthwhile could have slowed 2009 rulemaking. underlying rules. to track the Federal Register’s growth through Cost-benefit analysis is controversial to page counts, provided the caveats listed groups that favor activist agency regula- above are kept in mind. As Figure 6 shows, tion rather than congressional account- at the end of 2008, the number of pages ability for legislation.29 However, the stood at 79,435, an all-time record high and OIRA director’s Senate approval actually an increase of 10 percent from 72,090 pages came late in calendar year 2009, so 2010 the year before. (The previous record high may be more indicative of his effect. Crews: Ten Thousand Commandments 2010 13
- 15. Figure 6. Number of Federal Register Pages, 2000–2009 80,000 79,435 74,258 75,606 75,676 73,870 74,937 72,090 71,269 70,000 68,598 64,438 60,000 Number of Pages 50,000 40,000 30,000 20,000 10,000 0 2000 2001 2002 2003 2004 2005 2006 2007 2008 2009 Year Source: National Archives and Records Administration, Office of the Federal Register. • Finally, the regulatory freeze announced issuing “midnight regulations,” ahead of Presi- by the president’s chief of staff in Janu- dent George W. Bush’s arrival, were prevalent), ary 200930 that applied to Bush regula- pages topped 74,000.33 Since 2002, annual tions still in the pipeline may have had page counts remained above 70,000 until the some measurable effect by slowing what 2009 dip. The 2009 drop means that, overall, otherwise may have landed in the books the decade from 2000 to 2009 saw the annual during 2009.31 However, this effect may page count fall by 7.6 percent. (For a history not be permanent. A freeze on regula- of Federal Register page totals since 1936, see tions by the first President Bush did slow Appendix: Historical Tables, Part A.) regulations the year after its implementa- tion, but rules resumed normal trends Gross page counts alone do not reveal whether once the moratorium was lifted.32 In actual regulatory burdens have increased or any event, the longer-term result of any decreased—a rule of few pages might impose a “dampening” effect of this temporary significant burden. Isolating the pages devoted moratorium relative to the expansion of specifically to final rules might be more in- other rules under President George W. formative, because that approach omits pages Bush remains to be sorted out, but the devoted to proposed rules, agency notices, cor- two effects are consistent with the surge rections, and presidential documents. Between and the retreat seen in Federal Register 2007 and 2008, the number of pages devoted pages in 2008 and 2009, respectively. to final rules rose by 16 percent—from 22,771 to a record-high 26,320 (Figure 7), but the The bottom line, though, is that tens of number dropped sharply by 21 percent to thousands of pages still stream from 59 de- 20,782 in 2009. partments, agencies, and commissions. If one refers again to Figure 6, the third-high- Until the 2008 record, the count of 24,482 est page count had been 75,606 in 2002 (the pages in 2000 under President Clinton was year the Microsoft settlement contributed to the highest since 1976, when the Federal Reg- the total). During 2000, President Bill Clin- ister page-count breakdown by category was ton’s last year in office (when similar charges of first reported. The count in 2000 was up by 14 Crews: Ten Thousand Commandments 2010
- 16. Figure 7. Federal Register Pages Devoted to Final Rules, 2000–2009 30,000 26,320 25,000 24,482 22,670 22,546 23,041 22,771 22,347 20,782 20,000 19,643 19,233 Number of Pages 15,000 10,000 5000 0 2000 2001 2002 2003 2004 2005 2006 2007 2008 2009 Year Source: National Archives and Records Administration, Office of the Federal Register. 21 percent over 1999 (possibly partly attrib- over the 1990s and an average of 73,018 utable to the aforementioned effort by Clin- pages annually. ton to complete the backlog of rules before the arrival of the Bush administration). The Although the final codification of general drop right after Clinton’s final year in office and permanent rules as ultimately realized was noteworthy in that this Clinton-to-Bush in the Code of Federal Regulations (CFR) drop mirrors the one we see today from Bush is considerably more modest in terms of Gross page counts to Obama. numbers—if not in costs—today’s CFR con- tains 55 percent more pages than that for alone do not Over the decade, the number of Federal 1980. Since 1980, the CFR has grown from Register pages devoted to final rules has de- 102,195 pages to 157,974. By contrast, in reveal whether creased by 15 percent. The number of final- rule pages has remained above 22,000 since 1960, it had only 22,877 pages. actual regulatory 2003; it bounced to more than 26,000 in Although one must recognize the limitations burdens have 2008 (those midnight regulations again); of Federal Register page counts, the higher and then it fell to the current 20,782, which overall number of pages compared with past increased or is the lowest level since 2002. decades, plus a stream of pages devoted to final rules averaging well over 20,000 annu- decreased—a Yet another way of looking at Federal Regis- ally, credibly signify higher levels of final rule ter trends is pages per decade (see Figure 8). costs and burdens. rule of few pages During the 1990s, the total number of Fed- eral Register pages published was 622,368, might impose a Number of Proposed and Final whereas the total number published during the 1980s was 529,223. (The busiest year Rule Documents in the Federal significant burden. in the 1980s was the 1980 peak of 73,000 Register pages.) Here at the end of the first decade of the 21st century,34 730,176 pages ulti- The actual numbers of proposed and final mately appeared—a 17 percent increase rules published in the Federal Register merit Crews: Ten Thousand Commandments 2010 15
- 17. Figure 8. New Federal Register Pages per Decade 800,000 Average of 73,018 pages annually for 730,176* the decade ending in 2009. 700,000 622,368 600,000 529,223 Number of Pages 500,000 450,821 400,000 300,000 200,000 170,325 112,771 107,030 100,000 0 1940s 1950s 1960s 1970s 1980s 1990s 2000s Decade * Projection based on nine-year average. Source: National Archives and Records Administration, Office of the Federal Register. Figure 9. Number of Rules Published in the Federal Register, 1999–2008 8,000 Total 5,547 rules in 2009 7,000 2,636 2,638 2,512 2,538 2,430 2,257 2,475 2,346 2,308 6,000 2,044 Number of Rules 5,000 4,000 3,000 4,313 4,132 4,167 4,148 4,101 3,943 3,718 3,595 3,830 2,000 3,503 1,000 0 2000 2001 2002 2003 2004 2005 2006 2007 2008 2009 Year Proposed Rules Final Rules Source: National Archives and Records Administration, Office of the Federal Register. 16 Crews: Ten Thousand Commandments 2010
- 18. attention. As Figure 9 shows, in 2009 the ward likely higher levels of future regulation. total number of proposed and final rules (For the numbers of proposed and final rules published fell to 5,547, a 12-percent drop and other documents issued in the Federal from 6,305 in 2008. The number of rules Register since 1976, see Appendix: Historical actually finalized by federal agencies in 2009 Tables, Part B.) also fell—from 3,830 to 3,503, an 8.5-per- cent drop. Despite the prior year’s surge, The cumulative effect of regulation can the number of final rules currently being matter a great deal despite yearly fluctua- published is lower than it was throughout tions. The bottom line is that the annual the 1990s. The average number of annual outflow of some 4,000 final rules has meant regulations finalized during the 1990s was that nearly 60,000 rules have been issued 4,596. The average for the first decade of the since 1995. Although the costs of those 21st century (2000–2009) is 3,945. That is rules can vary tremendously, that number a positive trend. However, as noted before, represents a substantial yield of rules and recent budgetary spending surges point to- regulations. Crews: Ten Thousand Commandments 2010 17
- 19. Analysis of the Regulatory Plan and Unified Agenda The “Regulatory Plan and the Unified may often carry over at the same stage from Agenda of Federal Regulatory and Deregula- one year to the next, or they may reappear in tory Actions” appears in the Federal Regis- subsequent Agendas at different stages. The ter each December. Detailing rules recently Agenda’s rules primarily affect the private completed, plus those anticipated within sector, but many also affect state and local the upcoming 12 months by the roughly 60 governments and the federal government federal departments, agencies, and commis- itself. sions, the Agenda helps gauge the pulse of the regulatory pipeline. 4,043 New Rules in the Pipeline The Agenda lists federal regulatory actions at several stages: “prerules,” proposed and final The 2009 Agenda finds federal agencies, rules, actions completed during the past few departments, and commissions at work on months, and anticipated longer-term rule- 4,043 regulations from the prerule to the makings. The Agenda functions as a cross- just-completed stages.35 This level is up 1 sectional snapshot of rules moving through percent from 4,004 in 2008 (see Figure 10), the pipeline. Therefore, the rules it contains and up 4 percent from 2007. The number Figure 10. Total Agency Rules in the Unified Agenda Pipeline, 2000–2009 5,000 4,699 4,509 4,187 4,266 4,083 4,062 4,052 4,043 4,000 3,882 4,004 Number of Rules 3,000 2,000 1,000 0 2000 2001 2002 2003 2004 2005 2006 2007 2008 2009 Year Source: Compiled from “The Regulatory Plan and Unified Agenda of Federal Regulatory and Deregulatory Actions,” Federal Register, December edition, various years. 18 Crews: Ten Thousand Commandments 2010
- 20. of rules in the Agenda peaked at 5,119, in Table 3. Unified Agenda Entries by Department and Agency, 1994, and the count has remained above December 2009 (continued on next page) 4,000 except in 2007. (For a history of numbers of rules in the Unified Agenda since 1983, see Appendix: Historical Tables, Total Reg. Agenda Rules Plan Part C.36) Department of Agriculture 327 31 296 Table 3 breaks down the 4,043 rules ac- Department of Commerce 300 4 296 cording to issuing department, agency, or Department of Defense 133 1 132 commission. Each year, a relative handful of Department of Education 22 3 19 agencies account for a large number of the Department of Energy 85 2 83 rules produced. The five departments and Department of Health and Human Services 231 14 217 agencies listed in Table 4—the departments Department of Homeland Security 237 30 207 of the Treasury, Agriculture, Commerce, and Department of Housing and Urban Development 60 3 57 Interior, along with the Environmental Pro- Department of the Interior 277 0 277 tection Agency—were the biggest rulemak- Department of Justice 121 3 118 ers. These top five, with 1,763 rules among Department of Labor 104 19 85 them, account for 44 percent of all rules in Department of State 18 0 18 the Agenda pipeline. (For the numbers of rules by department and agency from previ- Department of Transportation 230 19 211 ous editions of the Unified Agenda, see Ap- Department of the Treasury 528 3 525 pendix: Historical Tables, Part D.) Department of Veterans Affairs 78 0 78 Environmental Protection Agency 331 22 309 Federal agencies noted the following initia- Agency for International Development 12 0 12 tives (among many others) as priorities in Architectural and Transportation Barriers 6 0 6 recent Unified Agenda editions: Compliance Board Commission on Civil Rights 1 0 1 Department of Agriculture CPBSD* 3 0 3 Commodity Futures Trading Commission 32 0 32 • Mandatory country-of-origin labeling of Consumer Product Safety Commission 39 0 39 beef, pork, lamb, fish, and peanuts Corporation for National and Community Service 7 0 7 • Inspection regulations for eggs and egg Court Sevices/Offender Supervision, D.C. 2 0 2 products Federal Acquisition Regulation 55 0 55 • Performance standards for ready-to-eat Equal Employment Opportunity Commission 7 2 5 meat and poultry products Farm Credit Administration 25 0 25 • New poultry slaughter inspection Farm Credit System Insurance Corporation 1 0 1 • Regulations concerning importation of Federal Communications Commission 145 0 145 unmanufactured wood articles (solid- Federal Deposit Insurance Corporation 21 0 21 wood packing material) Federal Energy Regulatory Commission 37 0 37 • Bovine spongiform encephalopathy: Federal Housing Finance Agency 30 0 30 minimal risk regions and importation of commodities Federal Maritime Commission 6 0 6 • Nutrition labeling of single-ingredient Federal Mediation and Conciliation Service 2 0 2 and ground or chopped meat and poul- Federal Reserve System 26 0 26 try products Federal Trade Commission 20 0 20 General Services Administration 49 0 49 Department of Commerce Institute of Museum and Library Services 1 0 1 • Right whale ship strike reduction * Committee for Purchase from People Who Are Blind or Severely Disabled. Crews: Ten Thousand Commandments 2010 19
- 21. Table 3. Unified Agenda Entries by Department and Agency, • Department of Health and December 2009 (continued) Human Services • Substances prohibited from use in ani- Total Reg. mal food or feed Agenda • Prevention of Salmonella enteritidis in Rules Plan National Aeronautics and Space Administration 32 0 32 shell eggs National Archives and Records Administration 7 1 6 • Good manufacturing practice in manu- facturing, packing, or holding dietary National Credit Union Administration 24 0 24 ingredients and dietary supplements National Endowment for the Arts 2 0 2 • Registration of food and animal feed National Endowment for the Humanities 3 0 3 facilities National Indian Gaming Commission 17 2 15 • Food labeling: transfatty acids in nutri- National Science Foundation 3 0 3 tion labeling, nutrient content claims, Nuclear Regulatory Commission 61 0 61 and health claims Office of Government Ethics 7 0 7 • Criteria for determining whether a drug Office of Management and Budget 7 0 7 is considered usually self-administered • Requirements for long-term care facili- Office of Personnel Management 77 0 77 ties: hospice services Peace Corps 1 0 1 • Bar-code label requirements for human Pension Benefit Guaranty Corporation 10 0 10 drug products and blood Postal Regulatory Commission 2 1 1 • Pediatric dosing for various over-the- Railroad Retirement Board 1 0 1 counter cough, cold, and allergy Recovery Accountability and Transparency Board 3 0 3 products Securities and Exchange Commission 74 0 74 • Fire-safety and sprinkler requirements Selective Service System 1 0 1 for long-term care facilities Small Business Administration 39 5 34 Social Security Administration 58 13 45 Department of Homeland Security Surface Transportation Board 5 0 5 TOTAL 4,043 178 3,865 • Computer Assisted Passenger Prescreen- ing System (CAPPS II), providing gov- Source: Compiled from “The Regulatory Plan and Unified Agenda of Federal Regulatory and Deregulatory Actions,” Federal Register,Vol. 74, No. 233, December 7, 2009; and from online ernment access to passenger reservation edition at http://www.reginfo.gov. information • Importer security filing • Air cargo screening and inspection of towing vessels • Minimum standards for driver’s licenses and ID cards acceptable to federal agencies • Secure Flight Program • United States Visitor and Immigrant Status Indicator Technology program (US-VISIT), which is authorized to col- lect biometric data from travelers and to expand to the 50 most highly trafficked land border ports Department of Labor • Occupational exposure to crystalline silica 20 Crews: Ten Thousand Commandments 2010
- 22. Table 4. Top Rule-Producing Departments or Agencies, 2009 Department or Agency Number of Regulations 1. Department of the Treasury 528 2. Environmental Protection Agency 331 3. Department of Agriculture 327 4. Department of Commerce 300 5. Department of the Interior 277 TOTAL 1,763 • Rules regarding confined spaces in Department of Transportation construction: preventing suffocation and explosions • Reform of the automobile fuel economy • Implementation of the health care ac- standards program cess, portability, and renewability provi- sions of the Health Insurance Portability • Light-truck Corporate Average Fuel and Accountability Act of 1996 Economy standards (2012 model years • Hearing conservation program for con- and beyond) struction workers • Aging aircraft safety • Cranes and derricks • Flight-crew member duty limitations • Health care standards for mothers and and rest requirements newborns • Upgrade of head restraints in vehicles • Protective equipment in electric power • Rear center lap and shoulder belt re- transmission and distribution quirement • Refuge alternatives for underground coal • Registration and training for operators mines of propane tank-filling equipment • Occupational exposure to tuberculosis • Monitoring systems for improved tire safety and tire pressure Department of Energy • Automotive regulations for car lighting, door retention, brake hoses, daytime • Energy-efficiency and conservation running-light glare, and side impact standards for residential furnaces, boil- protection ers, and mobile home furnaces; electric • Minimum training requirements for distribution transformers; commercial operators and training instructors of refrigeration units and heat pumps; multiple trailer combination trucks clothes dryers, room air conditioners • Hours of service, rest, and sleep for truck and dishwashers; pool heaters and direct drivers heating equipment; fluorescent and in- candescent lamps; small electric motors; Environmental Protection Agency battery chargers and power supplies; residential central air conditioners and heat pumps; and walk-in coolers and • Rulemaking to address greenhouse gas freezers emissions from motor vehicles • Advanced technology vehicles manufac- • Clean air visibility, mercury, and ozone turing incentive program implementation rules Crews: Ten Thousand Commandments 2010 21
- 23. • Review of National Ambient Air Quality • Regulation of Fannie Mae and Freddie Standards for lead, ozone, sulfur dioxide, Mac on “housing goals” particulate matter, and nitrogen dioxide • Regulations within the Real Estate • Rulemakings regarding lead-based paint Settlement Procedures Act pertaining to • National drinking water regulations cov- mortgages and closing costs ering groundwater and surface water • Refinement of income and rent determi- • National emission standards for hazard- nations in public and assisted housing ous air pollutants from plywood and composite wood products, certain recip- Department of the Treasury rocating internal combustion engines, and auto paints • Prohibition of funding of unlawful • Renewable fuels standard program Internet gambling • Standards for cooling water intake • Capital adequacy guidelines structures • Combined rulemaking for industrial, commercial, and institutional boilers “Economically Significant” A subset of the and process heaters Off-Budget Rules in the Agenda Agenda’s 4,043 • Standards for management of electric power producer coal-combustion wastes Cost Billions of Dollars. rules is classified • Control of emissions from nonroad A subset of the Agenda’s 4,043 rules is clas- spark ignition engines, new locomotives, as “economically and new marine diesel engines sified as “economically significant,” mean- ing that agencies anticipate yearly economic significant,” Consumer Product Safety impacts of at least $100 million apiece. Those impacts generally lead to increased meaning Commission costs, although occasionally an economically significant rule is intended to reduce costs. that agencies • Flammability standards for upholstered As Table 5 shows, 184 new economically significant rules are under consideration by anticipate yearly furniture and for bedclothes 23 separate departments and agencies at the • Banning of certain backyard play sets economic impacts • Product registration cards for products prerule, proposed rule, final rule, long-term, and recently completed stages. As Figure 11 intended for children of at least shows, this is a 2-percent increase over the 180 high-cost rules in 2008 (the prior year $100 million Federal Communications saw a 13.2-percent increase), and a 34.3-per- Commission cent jump over the past five years. apiece. • Broadband over power line systems High-cost “economically significant” rules • Mobile personal communications by are scattered among the 4,043 rules in the satellite Agenda. Because each will have an annual • Satellite broadcasting signal carriage impact of at least $100 million, those rules requirements can be expected to impose annual costs on • Rules regarding Internet protocol-en- the order of $18 billion (184 rules multiplied abled devices by $100 million). Some rules may reduce costs, but not typically. (For a full list of the Department of Housing and Urban 184 economically significant rules, see Ap- pendix: Historical Tables, Part E.) Development A breakdown of the $18 billion in regulatory • Revision of manufactured home con- costs (and sometimes benefits) is rarely pre- struction and safety standards regarding sented directly for each rule in the Agenda. location of smoke alarms Actual costs can sometimes best be found by 22 Crews: Ten Thousand Commandments 2010
- 24. Table 5. 184 Rules in the Pipeline Expected to Cost More than $100 Million Annually, 2009 Rules Department of Agriculture 18 Department of Commerce 2 Department of Defense 3 Department of Education 8 Department of Energy 8 Department of Health and Human Services 44 Department of Homeland Security 13 Department of Housing and Urban Development 2 Department of Justice 4 Department of the Interior 2 Department of Labor 13 Department of State 1 Department of Transportation 15 Department of the Treasury 5 Department of Veterans Affairs 3 Environmental Protection Agency 27 Consumer Product Safety Commission 2 Federal Communications Commission 7 Federal Deposit Insurance Corporation 1 National Credit Union Administration 1 Nuclear Regulatory Commission 2 Small Business Administration 1 Social Security Administration 2 TOTAL 184 Source: Compiled from “The Regulatory Plan and the Unified Agenda of Federal Regulatory and Deregulatory Actions,” Federal Register,Vol. 74, No. 233, December 7, 2009; and from online edition at http://www.reginfo.gov. combing through the document or searching The Regulatory Plan and the Uni- online. Rather than accumulate and summarize fied Agenda do not create a legal regulatory costs for the readers’ benefit, each obligation on agencies to adhere to Agenda entry indicates whether a rule is eco- schedules in this publication or to nomically significant and occasionally provides confine their regulatory activities to additional cost data from agency regulatory im- those regulations that appear within pact analyses. Note also that even though the it.37 $18 billion in anticipated economic impacts represents a floor (of a sort) for regulatory costs, Finally, the fact that policy makers and ana- it is not a one-time cost but a recurring annual lysts pay the most attention to economically cost that must be added to prior years’ costs, as significant rules should not lull them into well as to costs that come in the future. ignoring the remaining bulk of rules in the yearly pipeline. In 2009, 3,859 federal rules Nor are agencies required to limit their regu- were not considered officially economically latory activity to what they publish in the significant by the government (4,043 total Agenda: rules minus the 184 economically significant Crews: Ten Thousand Commandments 2010 23
- 25. Figure 11. “Economically Significant” Rules in the Agenda Pipeline, 2005–2009 180 184 180 139 159 160 137 139 140 Number of Rules 120 100 80 60 40 20 0 2005 2006 2007 2008 2009 Year Source: Compiled from “The Regulatory Plan and Unified Agenda of Federal Regulatory and Deregulatory Actions,” Federal Register, December edition, various years. Figure 12. Rules Affecting Small Business, 2005–2009 1,000 900 788 787 758 800 757 753 700 Number of Rules 600 500 400 300 200 100 0 2005 2006 2007 2008 2009 Year Sources: Compiled from “The Regulatory Plan and Unified Agenda of Federal Regulatory and Deregulatory Actions,” Federal Register, various years’ editions; and from online edition at http://www.reginfo.gov. 24 Crews: Ten Thousand Commandments 2010