SlideShare una empresa de Scribd logo
1 de 27
Descargar para leer sin conexión
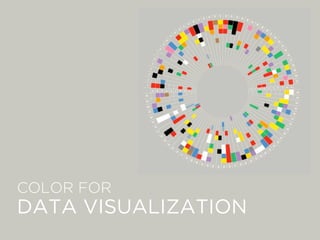
COLOR FOR
DATA VISUALIZATION
The fundamental uses of color in information
design (are): to label, to measure, to represent
or imitate reality, to enliven or decorate.
COLOR
Is this a good or bad use of color?
Particularly avoid Roy G. Biv (red, orange,
yellow, green, blue, indigo, violet), the color
spectrum of the rainbow.
THE FIRST RULE
BASIC COLOR THEORY
How humans think about color How computers process color
COLOR PERCEPTION
A constant increase in brightness is not perceived as linear,
and this response is different for red, green, and blue. Look
for tools and color palettes that describe colors in a
perceptual color space, like CIE L*C*h or Munsell.
A color scale should vary consistently across the entire range of values, so
that each step is equivalent, regardless of its position on the scale.
A palette should also minimize errors from the color shifts introduced by
nearby areas of differing color or lightness, a phenomenon known as
simultaneous contrast.
Combine a linear, proportional change in lightness with a simultaneous
change in hue and saturation to achieve the perfect palette for
sequential data.
SEQUENTIAL DATA
For divergent data, use palettes that are composed of two sequential
palettes merged with a neutral color.
This type of palette works because it takes advantage of pre attentive
processing: our visual systems can discriminate the different colors quickly
and without conscious thought.
DIVERGENT DATA
A sequential palette that varies uniformly in lightness will still be readable by
someone with color deficient vision (or a black and white print), regardless
of the hue. But a divergent palette with matched lightness can be difficult or
impossible to parse if the viewer can’t distinguish the hues.
COLOR DEFICIENCY CAUTION
Instead of representing proportional relationships, color is used to separate
areas into distinct categories. The palette should consist of colors as distinct
from one another as possible. Due to the limits of perception, especially
simultaneous contrast, the maximum number of categories that can be
displayed is about 12
CATEGORICAL/QUALITATIVE DATA
If you need to display double-digit categories, it’s best to group similar
classes together.
>12 CATEGORIES
A grouped color scheme allows the
USGS to simultaneously show 16 different
land cover classes in a single map of the
area surrounding Portland, Oregon.
RESOURCES FOR
SELECTING COLORS
Pros: Very easy to use, all palettes here are “safe”, available on D3
Cons: Limited color palettes to choose from
COLOR BREWER
NASA AMES COLOR TOOL
CHROMA.JS
HCL PICKER BY TRISTEN BROWN
LAB, LCH, RGB, AND HSV COLOR PICKER
I WANT HUE
For categorical palettes
COLOR GUIDELINES
FROM TUFTE
Color spots against a light gray or muted field
highlight and italicize data.
A magnetogram is a map of magnetic
fields, in this case on the surface of the
Sun. A divergent palette suits this data
because the north polarity (red) and
south polarity (blue) are both
measurements of the same quantity
(magnetism), just with opposite signs.
SDO HMI image adapted from the Solar
Data Analysis Center.
Use colors found in nature, especially those on the
lighter side.
The subtle colors in this bathymetric map
of Crater Lake are a direct descendent of
the palettes created by Eduard Imhof.
Map courtesy National Park Service
Harper’s Ferry Center.
The unnatural colors of the rainbow palette (left) are often difficult for novice viewers to interpret. A
more naturalistic palette for phytoplankton(more or less a type of ocean vegetation) trends from dark
blue for barren ocean, through turquoise, green, and yellow for increasing concentrations of the tiny
plants and algae.
Pure, bright or very strong colors have loud, unbearable effects when
they stand unrelieved over large areas adjacent to each other, but
extraordinary effects can be achieved when they are used sparingly on
or between dull background tones.
Screenshot from the BBC’s traffic
accident visualization
http://www.bbc.co.uk/news/
uk-15975724
Large area background or base-colors should
do their work most quietly, allowing the smaller,
bright areas to stand out most vividly, if the
former are muted, grayish or neutral.
DO NOT DO THIS
LINKS
Slides based on:
http://earthobservatory.nasa.gov/blogs/elegantfigures/2013/08/05/
subtleties-of-color-part-1-of-6/
A case study on color scales:
http://datavisualization.ch/inside/how-we-created-color-scales/

Más contenido relacionado

La actualidad más candente

From Data to Visualization, what happens in between?
From Data to Visualization, what happens in between?From Data to Visualization, what happens in between?
From Data to Visualization, what happens in between?Krist Wongsuphasawat
 
Hierarchical Clustering | Hierarchical Clustering in R |Hierarchical Clusteri...
Hierarchical Clustering | Hierarchical Clustering in R |Hierarchical Clusteri...Hierarchical Clustering | Hierarchical Clustering in R |Hierarchical Clusteri...
Hierarchical Clustering | Hierarchical Clustering in R |Hierarchical Clusteri...Simplilearn
 
Supply Chain Twin Demo - Companion Deck
Supply Chain Twin Demo - Companion DeckSupply Chain Twin Demo - Companion Deck
Supply Chain Twin Demo - Companion DeckNeo4j
 
2017 07 03_meetup_d
2017 07 03_meetup_d2017 07 03_meetup_d
2017 07 03_meetup_dDana Brophy
 
Brief introduction to data visualization
Brief introduction to data visualizationBrief introduction to data visualization
Brief introduction to data visualizationZach Gemignani
 
How Graph Algorithms Answer your Business Questions in Banking and Beyond
How Graph Algorithms Answer your Business Questions in Banking and BeyondHow Graph Algorithms Answer your Business Questions in Banking and Beyond
How Graph Algorithms Answer your Business Questions in Banking and BeyondNeo4j
 
Visualising Multi Dimensional Data
Visualising Multi Dimensional DataVisualising Multi Dimensional Data
Visualising Multi Dimensional DataAmit Kapoor
 
Technip Energies Italy: Planning is a graph matter
Technip Energies Italy: Planning is a graph matterTechnip Energies Italy: Planning is a graph matter
Technip Energies Italy: Planning is a graph matterNeo4j
 
DataMeet 4: Data cleaning & census data
DataMeet 4: Data cleaning & census dataDataMeet 4: Data cleaning & census data
DataMeet 4: Data cleaning & census dataRitvvij Parrikh
 
Neo4j GraphSummit London - The Path To Success With Graph Database and Data S...
Neo4j GraphSummit London - The Path To Success With Graph Database and Data S...Neo4j GraphSummit London - The Path To Success With Graph Database and Data S...
Neo4j GraphSummit London - The Path To Success With Graph Database and Data S...Neo4j
 
Big Data & Analytics (Conceptual and Practical Introduction)
Big Data & Analytics (Conceptual and Practical Introduction)Big Data & Analytics (Conceptual and Practical Introduction)
Big Data & Analytics (Conceptual and Practical Introduction)Yaman Hajja, Ph.D.
 
Applying Deep Learning with Weak and Noisy labels
Applying Deep Learning with Weak and Noisy labelsApplying Deep Learning with Weak and Noisy labels
Applying Deep Learning with Weak and Noisy labelsDarian Frajberg
 
Principles of data visualisation 2021
Principles of data visualisation 2021Principles of data visualisation 2021
Principles of data visualisation 2021Marié Roux
 
Introduction to Big Data
Introduction to Big DataIntroduction to Big Data
Introduction to Big DataJoey Li
 
Demystifying Graph Neural Networks
Demystifying Graph Neural NetworksDemystifying Graph Neural Networks
Demystifying Graph Neural NetworksNeo4j
 
Big Data Evolution
Big Data EvolutionBig Data Evolution
Big Data Evolutionitnewsafrica
 
The Importance of Data Visualization
The Importance of Data VisualizationThe Importance of Data Visualization
The Importance of Data VisualizationCenterline Digital
 

La actualidad más candente (20)

From Data to Visualization, what happens in between?
From Data to Visualization, what happens in between?From Data to Visualization, what happens in between?
From Data to Visualization, what happens in between?
 
Hierarchical Clustering | Hierarchical Clustering in R |Hierarchical Clusteri...
Hierarchical Clustering | Hierarchical Clustering in R |Hierarchical Clusteri...Hierarchical Clustering | Hierarchical Clustering in R |Hierarchical Clusteri...
Hierarchical Clustering | Hierarchical Clustering in R |Hierarchical Clusteri...
 
Supply Chain Twin Demo - Companion Deck
Supply Chain Twin Demo - Companion DeckSupply Chain Twin Demo - Companion Deck
Supply Chain Twin Demo - Companion Deck
 
2017 07 03_meetup_d
2017 07 03_meetup_d2017 07 03_meetup_d
2017 07 03_meetup_d
 
Brief introduction to data visualization
Brief introduction to data visualizationBrief introduction to data visualization
Brief introduction to data visualization
 
How Graph Algorithms Answer your Business Questions in Banking and Beyond
How Graph Algorithms Answer your Business Questions in Banking and BeyondHow Graph Algorithms Answer your Business Questions in Banking and Beyond
How Graph Algorithms Answer your Business Questions in Banking and Beyond
 
Visualising Multi Dimensional Data
Visualising Multi Dimensional DataVisualising Multi Dimensional Data
Visualising Multi Dimensional Data
 
Data Exploration.pptx
Data Exploration.pptxData Exploration.pptx
Data Exploration.pptx
 
Technip Energies Italy: Planning is a graph matter
Technip Energies Italy: Planning is a graph matterTechnip Energies Italy: Planning is a graph matter
Technip Energies Italy: Planning is a graph matter
 
DataMeet 4: Data cleaning & census data
DataMeet 4: Data cleaning & census dataDataMeet 4: Data cleaning & census data
DataMeet 4: Data cleaning & census data
 
Neo4j GraphSummit London - The Path To Success With Graph Database and Data S...
Neo4j GraphSummit London - The Path To Success With Graph Database and Data S...Neo4j GraphSummit London - The Path To Success With Graph Database and Data S...
Neo4j GraphSummit London - The Path To Success With Graph Database and Data S...
 
Big Data & Analytics (Conceptual and Practical Introduction)
Big Data & Analytics (Conceptual and Practical Introduction)Big Data & Analytics (Conceptual and Practical Introduction)
Big Data & Analytics (Conceptual and Practical Introduction)
 
Big data-analytics-ebook
Big data-analytics-ebookBig data-analytics-ebook
Big data-analytics-ebook
 
Applying Deep Learning with Weak and Noisy labels
Applying Deep Learning with Weak and Noisy labelsApplying Deep Learning with Weak and Noisy labels
Applying Deep Learning with Weak and Noisy labels
 
Principles of data visualisation 2021
Principles of data visualisation 2021Principles of data visualisation 2021
Principles of data visualisation 2021
 
Introduction to Big Data
Introduction to Big DataIntroduction to Big Data
Introduction to Big Data
 
Demystifying Graph Neural Networks
Demystifying Graph Neural NetworksDemystifying Graph Neural Networks
Demystifying Graph Neural Networks
 
Data visualization
Data visualizationData visualization
Data visualization
 
Big Data Evolution
Big Data EvolutionBig Data Evolution
Big Data Evolution
 
The Importance of Data Visualization
The Importance of Data VisualizationThe Importance of Data Visualization
The Importance of Data Visualization
 

Similar a Color for Data Visualization

Visual thinking colin_ware_lectures_2013_5_color theory and color for informa...
Visual thinking colin_ware_lectures_2013_5_color theory and color for informa...Visual thinking colin_ware_lectures_2013_5_color theory and color for informa...
Visual thinking colin_ware_lectures_2013_5_color theory and color for informa...Elsa von Licy
 
Presentation color (kelompok 12)
Presentation color (kelompok 12)Presentation color (kelompok 12)
Presentation color (kelompok 12)Erlangga Adinegoro
 
Data-Driven Color Palettes for Categorical Maps
Data-Driven Color Palettes for Categorical MapsData-Driven Color Palettes for Categorical Maps
Data-Driven Color Palettes for Categorical Mapsnacis_slides
 
Design Element 4 - Color
Design Element 4 - ColorDesign Element 4 - Color
Design Element 4 - Colormjb77ny
 
Presentación1 ingles
Presentación1 inglesPresentación1 ingles
Presentación1 ingleseverezcotelo
 
Color interaction
Color interactionColor interaction
Color interactionMona Rafiee
 
What color is white light? By Steven Rosen
What color is white light? By Steven RosenWhat color is white light? By Steven Rosen
What color is white light? By Steven RosenFARO
 
Color Chapter 2 Powerpoint 2
Color Chapter 2 Powerpoint 2Color Chapter 2 Powerpoint 2
Color Chapter 2 Powerpoint 2tanyalangford
 
Visualization-Recommendations
Visualization-RecommendationsVisualization-Recommendations
Visualization-RecommendationsSneha Nath
 
Presentacin1coloringles 2020
Presentacin1coloringles 2020Presentacin1coloringles 2020
Presentacin1coloringles 2020everezcotelo
 
Elements intro-color
Elements intro-colorElements intro-color
Elements intro-colorkbudge
 
Importance of colors in a presentation
Importance of colors in a presentationImportance of colors in a presentation
Importance of colors in a presentationRana Usman Sattar
 
presentacion1coloringles-2023 power point.pptx
presentacion1coloringles-2023 power point.pptxpresentacion1coloringles-2023 power point.pptx
presentacion1coloringles-2023 power point.pptxeverezcotelo
 

Similar a Color for Data Visualization (20)

Visual thinking colin_ware_lectures_2013_5_color theory and color for informa...
Visual thinking colin_ware_lectures_2013_5_color theory and color for informa...Visual thinking colin_ware_lectures_2013_5_color theory and color for informa...
Visual thinking colin_ware_lectures_2013_5_color theory and color for informa...
 
Presentation color (kelompok 12)
Presentation color (kelompok 12)Presentation color (kelompok 12)
Presentation color (kelompok 12)
 
W8 color
W8 colorW8 color
W8 color
 
Data-Driven Color Palettes for Categorical Maps
Data-Driven Color Palettes for Categorical MapsData-Driven Color Palettes for Categorical Maps
Data-Driven Color Palettes for Categorical Maps
 
Design Element 4 - Color
Design Element 4 - ColorDesign Element 4 - Color
Design Element 4 - Color
 
Colour Display
Colour DisplayColour Display
Colour Display
 
ColourART106.pptx
ColourART106.pptxColourART106.pptx
ColourART106.pptx
 
Colour role in seismic interpretation
Colour role in seismic interpretationColour role in seismic interpretation
Colour role in seismic interpretation
 
Presentación1 ingles
Presentación1 inglesPresentación1 ingles
Presentación1 ingles
 
Color interaction
Color interactionColor interaction
Color interaction
 
What color is white light? By Steven Rosen
What color is white light? By Steven RosenWhat color is white light? By Steven Rosen
What color is white light? By Steven Rosen
 
shade selection seminar.pptx
shade selection seminar.pptxshade selection seminar.pptx
shade selection seminar.pptx
 
Color Chapter 2 Powerpoint 2
Color Chapter 2 Powerpoint 2Color Chapter 2 Powerpoint 2
Color Chapter 2 Powerpoint 2
 
Visualization-Recommendations
Visualization-RecommendationsVisualization-Recommendations
Visualization-Recommendations
 
Colour 1 theory 2014
Colour 1 theory 2014Colour 1 theory 2014
Colour 1 theory 2014
 
Presentacin1coloringles 2020
Presentacin1coloringles 2020Presentacin1coloringles 2020
Presentacin1coloringles 2020
 
Elements intro-color
Elements intro-colorElements intro-color
Elements intro-color
 
Importance of colors in a presentation
Importance of colors in a presentationImportance of colors in a presentation
Importance of colors in a presentation
 
COLOR PRESENTATION
COLOR PRESENTATIONCOLOR PRESENTATION
COLOR PRESENTATION
 
presentacion1coloringles-2023 power point.pptx
presentacion1coloringles-2023 power point.pptxpresentacion1coloringles-2023 power point.pptx
presentacion1coloringles-2023 power point.pptx
 

Último

专业一比一美国俄亥俄大学毕业证成绩单pdf电子版制作修改
专业一比一美国俄亥俄大学毕业证成绩单pdf电子版制作修改专业一比一美国俄亥俄大学毕业证成绩单pdf电子版制作修改
专业一比一美国俄亥俄大学毕业证成绩单pdf电子版制作修改yuu sss
 
GA4 Without Cookies [Measure Camp AMS]
GA4 Without Cookies [Measure Camp AMS]GA4 Without Cookies [Measure Camp AMS]
GA4 Without Cookies [Measure Camp AMS]📊 Markus Baersch
 
Heart Disease Classification Report: A Data Analysis Project
Heart Disease Classification Report: A Data Analysis ProjectHeart Disease Classification Report: A Data Analysis Project
Heart Disease Classification Report: A Data Analysis ProjectBoston Institute of Analytics
 
PKS-TGC-1084-630 - Stage 1 Proposal.pptx
PKS-TGC-1084-630 - Stage 1 Proposal.pptxPKS-TGC-1084-630 - Stage 1 Proposal.pptx
PKS-TGC-1084-630 - Stage 1 Proposal.pptxPramod Kumar Srivastava
 
办理学位证纽约大学毕业证(NYU毕业证书)原版一比一
办理学位证纽约大学毕业证(NYU毕业证书)原版一比一办理学位证纽约大学毕业证(NYU毕业证书)原版一比一
办理学位证纽约大学毕业证(NYU毕业证书)原版一比一fhwihughh
 
1:1定制(UQ毕业证)昆士兰大学毕业证成绩单修改留信学历认证原版一模一样
1:1定制(UQ毕业证)昆士兰大学毕业证成绩单修改留信学历认证原版一模一样1:1定制(UQ毕业证)昆士兰大学毕业证成绩单修改留信学历认证原版一模一样
1:1定制(UQ毕业证)昆士兰大学毕业证成绩单修改留信学历认证原版一模一样vhwb25kk
 
Generative AI for Social Good at Open Data Science East 2024
Generative AI for Social Good at Open Data Science East 2024Generative AI for Social Good at Open Data Science East 2024
Generative AI for Social Good at Open Data Science East 2024Colleen Farrelly
 
20240419 - Measurecamp Amsterdam - SAM.pdf
20240419 - Measurecamp Amsterdam - SAM.pdf20240419 - Measurecamp Amsterdam - SAM.pdf
20240419 - Measurecamp Amsterdam - SAM.pdfHuman37
 
NO1 Certified Black Magic Specialist Expert Amil baba in Lahore Islamabad Raw...
NO1 Certified Black Magic Specialist Expert Amil baba in Lahore Islamabad Raw...NO1 Certified Black Magic Specialist Expert Amil baba in Lahore Islamabad Raw...
NO1 Certified Black Magic Specialist Expert Amil baba in Lahore Islamabad Raw...Amil Baba Dawood bangali
 
Top 5 Best Data Analytics Courses In Queens
Top 5 Best Data Analytics Courses In QueensTop 5 Best Data Analytics Courses In Queens
Top 5 Best Data Analytics Courses In Queensdataanalyticsqueen03
 
While-For-loop in python used in college
While-For-loop in python used in collegeWhile-For-loop in python used in college
While-For-loop in python used in collegessuser7a7cd61
 
Statistics, Data Analysis, and Decision Modeling, 5th edition by James R. Eva...
Statistics, Data Analysis, and Decision Modeling, 5th edition by James R. Eva...Statistics, Data Analysis, and Decision Modeling, 5th edition by James R. Eva...
Statistics, Data Analysis, and Decision Modeling, 5th edition by James R. Eva...ssuserf63bd7
 
RS 9000 Call In girls Dwarka Mor (DELHI)⇛9711147426🔝Delhi
RS 9000 Call In girls Dwarka Mor (DELHI)⇛9711147426🔝DelhiRS 9000 Call In girls Dwarka Mor (DELHI)⇛9711147426🔝Delhi
RS 9000 Call In girls Dwarka Mor (DELHI)⇛9711147426🔝Delhijennyeacort
 
INTERNSHIP ON PURBASHA COMPOSITE TEX LTD
INTERNSHIP ON PURBASHA COMPOSITE TEX LTDINTERNSHIP ON PURBASHA COMPOSITE TEX LTD
INTERNSHIP ON PURBASHA COMPOSITE TEX LTDRafezzaman
 
原版1:1定制南十字星大学毕业证(SCU毕业证)#文凭成绩单#真实留信学历认证永久存档
原版1:1定制南十字星大学毕业证(SCU毕业证)#文凭成绩单#真实留信学历认证永久存档原版1:1定制南十字星大学毕业证(SCU毕业证)#文凭成绩单#真实留信学历认证永久存档
原版1:1定制南十字星大学毕业证(SCU毕业证)#文凭成绩单#真实留信学历认证永久存档208367051
 
Indian Call Girls in Abu Dhabi O5286O24O8 Call Girls in Abu Dhabi By Independ...
Indian Call Girls in Abu Dhabi O5286O24O8 Call Girls in Abu Dhabi By Independ...Indian Call Girls in Abu Dhabi O5286O24O8 Call Girls in Abu Dhabi By Independ...
Indian Call Girls in Abu Dhabi O5286O24O8 Call Girls in Abu Dhabi By Independ...dajasot375
 
Student Profile Sample report on improving academic performance by uniting gr...
Student Profile Sample report on improving academic performance by uniting gr...Student Profile Sample report on improving academic performance by uniting gr...
Student Profile Sample report on improving academic performance by uniting gr...Seán Kennedy
 
Call Girls In Dwarka 9654467111 Escorts Service
Call Girls In Dwarka 9654467111 Escorts ServiceCall Girls In Dwarka 9654467111 Escorts Service
Call Girls In Dwarka 9654467111 Escorts ServiceSapana Sha
 
From idea to production in a day – Leveraging Azure ML and Streamlit to build...
From idea to production in a day – Leveraging Azure ML and Streamlit to build...From idea to production in a day – Leveraging Azure ML and Streamlit to build...
From idea to production in a day – Leveraging Azure ML and Streamlit to build...Florian Roscheck
 
Predicting Salary Using Data Science: A Comprehensive Analysis.pdf
Predicting Salary Using Data Science: A Comprehensive Analysis.pdfPredicting Salary Using Data Science: A Comprehensive Analysis.pdf
Predicting Salary Using Data Science: A Comprehensive Analysis.pdfBoston Institute of Analytics
 

Último (20)

专业一比一美国俄亥俄大学毕业证成绩单pdf电子版制作修改
专业一比一美国俄亥俄大学毕业证成绩单pdf电子版制作修改专业一比一美国俄亥俄大学毕业证成绩单pdf电子版制作修改
专业一比一美国俄亥俄大学毕业证成绩单pdf电子版制作修改
 
GA4 Without Cookies [Measure Camp AMS]
GA4 Without Cookies [Measure Camp AMS]GA4 Without Cookies [Measure Camp AMS]
GA4 Without Cookies [Measure Camp AMS]
 
Heart Disease Classification Report: A Data Analysis Project
Heart Disease Classification Report: A Data Analysis ProjectHeart Disease Classification Report: A Data Analysis Project
Heart Disease Classification Report: A Data Analysis Project
 
PKS-TGC-1084-630 - Stage 1 Proposal.pptx
PKS-TGC-1084-630 - Stage 1 Proposal.pptxPKS-TGC-1084-630 - Stage 1 Proposal.pptx
PKS-TGC-1084-630 - Stage 1 Proposal.pptx
 
办理学位证纽约大学毕业证(NYU毕业证书)原版一比一
办理学位证纽约大学毕业证(NYU毕业证书)原版一比一办理学位证纽约大学毕业证(NYU毕业证书)原版一比一
办理学位证纽约大学毕业证(NYU毕业证书)原版一比一
 
1:1定制(UQ毕业证)昆士兰大学毕业证成绩单修改留信学历认证原版一模一样
1:1定制(UQ毕业证)昆士兰大学毕业证成绩单修改留信学历认证原版一模一样1:1定制(UQ毕业证)昆士兰大学毕业证成绩单修改留信学历认证原版一模一样
1:1定制(UQ毕业证)昆士兰大学毕业证成绩单修改留信学历认证原版一模一样
 
Generative AI for Social Good at Open Data Science East 2024
Generative AI for Social Good at Open Data Science East 2024Generative AI for Social Good at Open Data Science East 2024
Generative AI for Social Good at Open Data Science East 2024
 
20240419 - Measurecamp Amsterdam - SAM.pdf
20240419 - Measurecamp Amsterdam - SAM.pdf20240419 - Measurecamp Amsterdam - SAM.pdf
20240419 - Measurecamp Amsterdam - SAM.pdf
 
NO1 Certified Black Magic Specialist Expert Amil baba in Lahore Islamabad Raw...
NO1 Certified Black Magic Specialist Expert Amil baba in Lahore Islamabad Raw...NO1 Certified Black Magic Specialist Expert Amil baba in Lahore Islamabad Raw...
NO1 Certified Black Magic Specialist Expert Amil baba in Lahore Islamabad Raw...
 
Top 5 Best Data Analytics Courses In Queens
Top 5 Best Data Analytics Courses In QueensTop 5 Best Data Analytics Courses In Queens
Top 5 Best Data Analytics Courses In Queens
 
While-For-loop in python used in college
While-For-loop in python used in collegeWhile-For-loop in python used in college
While-For-loop in python used in college
 
Statistics, Data Analysis, and Decision Modeling, 5th edition by James R. Eva...
Statistics, Data Analysis, and Decision Modeling, 5th edition by James R. Eva...Statistics, Data Analysis, and Decision Modeling, 5th edition by James R. Eva...
Statistics, Data Analysis, and Decision Modeling, 5th edition by James R. Eva...
 
RS 9000 Call In girls Dwarka Mor (DELHI)⇛9711147426🔝Delhi
RS 9000 Call In girls Dwarka Mor (DELHI)⇛9711147426🔝DelhiRS 9000 Call In girls Dwarka Mor (DELHI)⇛9711147426🔝Delhi
RS 9000 Call In girls Dwarka Mor (DELHI)⇛9711147426🔝Delhi
 
INTERNSHIP ON PURBASHA COMPOSITE TEX LTD
INTERNSHIP ON PURBASHA COMPOSITE TEX LTDINTERNSHIP ON PURBASHA COMPOSITE TEX LTD
INTERNSHIP ON PURBASHA COMPOSITE TEX LTD
 
原版1:1定制南十字星大学毕业证(SCU毕业证)#文凭成绩单#真实留信学历认证永久存档
原版1:1定制南十字星大学毕业证(SCU毕业证)#文凭成绩单#真实留信学历认证永久存档原版1:1定制南十字星大学毕业证(SCU毕业证)#文凭成绩单#真实留信学历认证永久存档
原版1:1定制南十字星大学毕业证(SCU毕业证)#文凭成绩单#真实留信学历认证永久存档
 
Indian Call Girls in Abu Dhabi O5286O24O8 Call Girls in Abu Dhabi By Independ...
Indian Call Girls in Abu Dhabi O5286O24O8 Call Girls in Abu Dhabi By Independ...Indian Call Girls in Abu Dhabi O5286O24O8 Call Girls in Abu Dhabi By Independ...
Indian Call Girls in Abu Dhabi O5286O24O8 Call Girls in Abu Dhabi By Independ...
 
Student Profile Sample report on improving academic performance by uniting gr...
Student Profile Sample report on improving academic performance by uniting gr...Student Profile Sample report on improving academic performance by uniting gr...
Student Profile Sample report on improving academic performance by uniting gr...
 
Call Girls In Dwarka 9654467111 Escorts Service
Call Girls In Dwarka 9654467111 Escorts ServiceCall Girls In Dwarka 9654467111 Escorts Service
Call Girls In Dwarka 9654467111 Escorts Service
 
From idea to production in a day – Leveraging Azure ML and Streamlit to build...
From idea to production in a day – Leveraging Azure ML and Streamlit to build...From idea to production in a day – Leveraging Azure ML and Streamlit to build...
From idea to production in a day – Leveraging Azure ML and Streamlit to build...
 
Predicting Salary Using Data Science: A Comprehensive Analysis.pdf
Predicting Salary Using Data Science: A Comprehensive Analysis.pdfPredicting Salary Using Data Science: A Comprehensive Analysis.pdf
Predicting Salary Using Data Science: A Comprehensive Analysis.pdf
 

Color for Data Visualization

  • 2. The fundamental uses of color in information design (are): to label, to measure, to represent or imitate reality, to enliven or decorate. COLOR
  • 3. Is this a good or bad use of color?
  • 4. Particularly avoid Roy G. Biv (red, orange, yellow, green, blue, indigo, violet), the color spectrum of the rainbow. THE FIRST RULE
  • 5. BASIC COLOR THEORY How humans think about color How computers process color
  • 6. COLOR PERCEPTION A constant increase in brightness is not perceived as linear, and this response is different for red, green, and blue. Look for tools and color palettes that describe colors in a perceptual color space, like CIE L*C*h or Munsell.
  • 7. A color scale should vary consistently across the entire range of values, so that each step is equivalent, regardless of its position on the scale. A palette should also minimize errors from the color shifts introduced by nearby areas of differing color or lightness, a phenomenon known as simultaneous contrast.
  • 8. Combine a linear, proportional change in lightness with a simultaneous change in hue and saturation to achieve the perfect palette for sequential data. SEQUENTIAL DATA
  • 9. For divergent data, use palettes that are composed of two sequential palettes merged with a neutral color. This type of palette works because it takes advantage of pre attentive processing: our visual systems can discriminate the different colors quickly and without conscious thought. DIVERGENT DATA
  • 10. A sequential palette that varies uniformly in lightness will still be readable by someone with color deficient vision (or a black and white print), regardless of the hue. But a divergent palette with matched lightness can be difficult or impossible to parse if the viewer can’t distinguish the hues. COLOR DEFICIENCY CAUTION
  • 11. Instead of representing proportional relationships, color is used to separate areas into distinct categories. The palette should consist of colors as distinct from one another as possible. Due to the limits of perception, especially simultaneous contrast, the maximum number of categories that can be displayed is about 12 CATEGORICAL/QUALITATIVE DATA
  • 12. If you need to display double-digit categories, it’s best to group similar classes together. >12 CATEGORIES A grouped color scheme allows the USGS to simultaneously show 16 different land cover classes in a single map of the area surrounding Portland, Oregon.
  • 14. Pros: Very easy to use, all palettes here are “safe”, available on D3 Cons: Limited color palettes to choose from COLOR BREWER
  • 17. HCL PICKER BY TRISTEN BROWN
  • 18. LAB, LCH, RGB, AND HSV COLOR PICKER
  • 19. I WANT HUE For categorical palettes
  • 21. Color spots against a light gray or muted field highlight and italicize data. A magnetogram is a map of magnetic fields, in this case on the surface of the Sun. A divergent palette suits this data because the north polarity (red) and south polarity (blue) are both measurements of the same quantity (magnetism), just with opposite signs. SDO HMI image adapted from the Solar Data Analysis Center.
  • 22. Use colors found in nature, especially those on the lighter side. The subtle colors in this bathymetric map of Crater Lake are a direct descendent of the palettes created by Eduard Imhof. Map courtesy National Park Service Harper’s Ferry Center.
  • 23. The unnatural colors of the rainbow palette (left) are often difficult for novice viewers to interpret. A more naturalistic palette for phytoplankton(more or less a type of ocean vegetation) trends from dark blue for barren ocean, through turquoise, green, and yellow for increasing concentrations of the tiny plants and algae.
  • 24. Pure, bright or very strong colors have loud, unbearable effects when they stand unrelieved over large areas adjacent to each other, but extraordinary effects can be achieved when they are used sparingly on or between dull background tones. Screenshot from the BBC’s traffic accident visualization http://www.bbc.co.uk/news/ uk-15975724
  • 25. Large area background or base-colors should do their work most quietly, allowing the smaller, bright areas to stand out most vividly, if the former are muted, grayish or neutral. DO NOT DO THIS
  • 26.
  • 27. LINKS Slides based on: http://earthobservatory.nasa.gov/blogs/elegantfigures/2013/08/05/ subtleties-of-color-part-1-of-6/ A case study on color scales: http://datavisualization.ch/inside/how-we-created-color-scales/