SlideShare una empresa de Scribd logo
1 de 6
Descargar para leer sin conexión
December 2009

                        Nonprofit Current Conditions Report
                        Analysis of a Minnesota Council of Nonprofits member survey
                        by Ruth Duran Deffley, membership and chapter coordinator and Jon Pratt, executive director


In December 2008, the Minnesota Council of Nonprofits (MCN) conducted its first Current Conditions survey to provide quick,
real-time analysis of the challenges nonprofits were experiencing at the end of last year. A second Current Conditions survey went
out in May 2009 to find out how nonprofits were faring after the 1st quarter of this year.
This report analyze the results of the third Current Conditions survey. The survey was conducted from December 1-8, 2009 and
was sent to approximately 2,000 nonprofits. It was completed by 639 organizations, employing roughly 32,589 staff and hav-
ing a combined budget of $2.5 billion, as reported in the survey. The participating organizations represent the full range of
Minnesota nonprofit activity areas, budget sizes and geographic locations. The survey was completed by 59 percent executive
directors, 4 percent chief operating officers, 7 percent chief financial officers and 8 percent development directors.

Increase in need continues to be coupled with declining revenues
As Minnesota’s unemploy-                                                                                  in individual gifts has
ment rate surpassed 7                                                                                     remained flat at 47 percent
percent during 2009, the                                                                                  in both 2008 and 2009.
number of people seeking                                                                                  The types of organizations
assistance from nonprofit                                                                                 that most frequently report-
organizations also                                                                                        ed declining total revenue
increased. Nonprofits con-                                                                                were environment related
tinued to experience an                                                                                   (71 percent), education (69
increase in demand for                                                                                    percent) and employment
their services while facing                                                                               and jobs (68 percent).
declining revenue. Sixty
                                                                                                           Food and/or housing
percent of organizations
                                                                                                           organizations were the
reported an increase in
                                                                                                           least likely to report a
need for services, com-
                                                                                                           decline in revenue (39 per-
pared to 42 percent at the
                                                                                                           cent), which explains why
end of 2008. The types of
                                                                                                           out of the 78 percent of
organizations that most
                                                                                                           these organizations that
frequently experienced an
                                                                                                           were experiencing an
increased demand for
                                                                                                           increase in demand for
services were mental
                                                                                                           services, 93 percent were
health and crisis intervention (89 percent of respondents report
                                                                     able to increase their services in response to the demand.
increased demand for services), food and/or housing (78 per-
cent) and employment and jobs (73 percent).Regionally, non-          One way to meet an increasing need for services without
profits in South Central/South West Minnesota most frequently        increasing expenses is through volunteers. Only 10 percent of
reported increased demand (74 percent).                              organizations reported a decline in volunteers in 2009.
                                                                     However, declining numbers of volunteers is disproportionately
The ability to meet this increase in need for services is undercut
                                                                     affecting Northern Minnesota. In the Twin Cities Metro area,
by the reduction in revenues to these organizations. Sixty-one
                                                                     only 8 percent of organizations experienced a decline in volun-
percent of nonprofits reported declining revenue, up from 55
                                                                     teers while in Northeast and Northwest Minnesota, 19 percent
percent in 2008. Sixty percent of nonprofits experienced a
                                                                     and 18 percent of organizations respectively have fewer volun-
decline in revenue from foundations and corporate giving pro-
                                                                     teers this year than last.
grams this year. (This question was not asked in 2008).
However, the percentage of organizations reporting a decline
“Cuts have come from administrative. We cut the financial coordinator position and administrative assistant posi-
tion due to having mostly programmatic and operational funding. This is a major problem. How do you main-
tain a nonprofit agency without administrative dollars?”

                                                                                                ~ A domestic violence shelter

                                                                                                                                Page 1
Small nonprofits have particular challenges
Minnesota organizations with budges under
$400,000 per year have faced the most difficulty
in 2009. Sixty-three percent of small organizations
experienced a decline in total revenue and 25 per-
cent anticipate a cash shortfall next year. Although
59 percent have increased their fundraising efforts,
38 percent do not have reserves available and 86
percent do not have access to a line of credit.


Staff reductions and other measures used by nonprofits
to weather the recession
To manage the effects of the economy, 32 percent of nonprofits    Additional measures that nonprofits took during the recession
have reduced their number of employees, 52 percent have           in 2009 were reducing their overall budget (52 percent),
implemented hiring freezes and/or salary freezes, and 25 per-     reductions in programming (21 percent) and putting expansion
cent have reduced employee benefits. The larger the organiza-     plans on hold (22 percent). Thirty-seven percent of organiza-
tion, the more likely it was to have cut employee benefits.       tions held a fundraising special event this year and of these,
Thirty-four percent of very large organizations (budget size      40 percent saw an increase in income generated from the
over $10 million) reduced benefits, as did 32 percent of large    event when compared to last year, while 40 percent had a
organizations (budget size between $3 and $10 million). The       decrease in special event income.
types of organizations that most often faced staff reductions
were health and/or disease related (42 percent), employment
and jobs (41 percent) and mental health and crisis intervention
(41 percent).

“Despite cutting our staffing and expenses by
about 30% since last fall, we have still been
able to provide the same quality and level of
services to our clients. We’ve been creative
about how we go about doing our work and
utilizing volunteers to accomplish our mission.”


                  ~ A health organization working
                                     with children


“Although we have not laid off staff, we have
delayed hiring vacated positions. We also
reduced specific staff hours during less busy
times. We have instituted a salary freeze and
also a reduction in contribution to retirement
accounts. The goal is to keep the same servic-
es available.”
                 ~ A human services organization


Page 2
The American Recovery and Reinvestment Act of 2009 has helped
some nonprofits
On February 17, 2009 President Obama signed the American            lowed by human services and/or youth development (57 per-
Recovery and Reinvestment Act, parts of which provided non-         cent) and legal, civil rights, advocacy and/or crime (55 per-
profits opportunities for additional federal dollars. Thirty per-   cent). Organizations with budgets over $3 million were the
cent of respondents applied for these funds in 2009 and 53          most likely to apply for and receive stimulus funds. They not
percent of those were successful. For organizations that decid-     only have the capacity to apply for federal grants but also the
ed not to pursue stimulus funds, the primary reason was that        ability to manage the funds once obtained.
the purpose of the funds did not fit the organization (74 per-
                                                                    Seventy-four percent of organizations that were selected to
cent). While 12 percent reported that they did not have the
                                                                    receive stimulus funds have already received them by
time or resources to apply and 5 percent did not have the
                                                                    December 2009, reflecting the legislative intent to quickly get
resources to manage government funding. Employment and job
                                                                    money into the economy. Sixty-four percent have used the funds
related organizations and food and/or housing organizations
                                                                    to retain existing staff and 50 percent have hired new employ-
were the most likely to receive stimulus money (70 percent), fol-
                                                                    ees. Fifty-two percent have also increased programs.


Employment gains; delays of payment problems reported
Despite the challenging economic environment or perhaps in          The type of revenue an organization relies upon has major
response to increased need for their services, 20 percent of non-   implications for financial management and program planning.
profits reported hiring additional staff in 2009. Human services    Overall, 30 percent of organizations in the survey have gov-
and/or youth development organizations were the most likely to      ernment funding as their largest single source of revenue and
hire new staff (32 percent), followed by food and/or housing        64 percent of all nonprofits receive some type of government
(12 percent) and health and/or disease (11 percent). Central        funding. Nonprofits that receive the majority of their govern-
Minnesota reported the highest percentage of nonprofits hiring      ment funds from the federal government reported increased
staff (32 percent). Of these organizations that were able to hire   delays in payments from the federal government, (32 percent
new staff, 58 percent also increased their fundraising activities   when compared to 19 percent in May). In contrast, fewer non-
during the year. Forty-two percent applied for federal stimulus     profits that receive most of their government funds from county
funds and, of those, 66 percent were selected to receive funds      government reported delayed payments, (28 percent, down
while 11 percent are still pending.                                 from 32 percent in May). State government payments experi-
                                                                     enced the least amount of change, with 27 percent of nonprof-
                                                                     its that receive the majority of their government funds from the
“We have been in the very difficult, uncomfortable
                                                                     state experiencing delayed payments in December and 25
and painful position of needing to terminate staff
                                                                     percent in May.
(because of reductions in funding from corporations
and foundations) at the same time we were hiring
staff with funding from the economic recovery act.”
                    ~ A youth development organization


                                                                                                                               Page 3
Cash flow issues are common across activities and sizes
Organizations that receive the largest percentage of their rev-    In the May survey, earned income (any self-generated revenue
enue from government are the least likely to experience cash       from service, facility rental or product, not from a government
flow problems, at 29 percent. Nonprofits that rely on individual   source) stood out as the most reliable stream of revenue. In that
contributions as their largest source of revenue were second,      report, 38 percent of nonprofits that relied on earned income
with 38 percent experiencing cash flow problems.                   as their largest single source of revenue reported a decrease in
Organizations that relied primarily on foundations or had          revenue. Now 50 percent of the same type of nonprofits report-
earned income as their main source of revenue were the most        ed a decline in revenue and only 25 percent expect to be with-
likely to have cash flow problems, 58 percent and 57 percent       in 91 percent of their end of year goal in earned income down
respectively. Revenue source appears to be a significant predic-   from 45 percent in May.
tor of whether an organization will have cash flow problems
regardless of activity area or budget size.


Individual contributions and GiveMN.org’s “Give to the Max Day”
Ninety-one percent of organizations report receiving individual
contributions, and half of these saw their individual contribu-
tions decline in 2009. However, 21 percent reported an
increase in individual contributions when compared to 2008.
The types of organizations that most often reported an increase
in individual giving were mental health and crisis intervention
(35 percent), food and/or housing (31 percent) and arts, cul-
ture and humanities (26 percent). Those organizations that
most often saw a decrease in individual contributions were
legal, civil rights and advocacy (54 percent), job and employ-
ment (50 percent) and human services and/or youth develop-
ment (45 percent). Organizations in Northeast Minnesota
were most likely to report a decline in individual giving at 52
percent. Sixty-two percent of overall survey respondents report
that when compared to 2008’s 4th quarter, individual contribu-
tions have decreased both in the average amount and number
of contributions.
In November 2009, a new Web site, GiveMN.org, was
launched to encourage individual contributions and make
online donating more accessible to both nonprofits and
donors. On November 17, the Bush, Minneapolis and St. Paul         “Being a grant giving organization, we do struggle to
Foundations sponsored “Give to Max Day,” on which dona-            receive grants, so we rely more on individual giving
tions made that day through GiveMN.org site would be               and that has declined dramatically and with staff
matched in part by the three foundations, up to a total match      reductions, we now don’t have the manpower to keep
of $500,000. Minnesotans set a national record that day,           pursuing contributions.”
raising $14 million in charitable donations in one day. Sixty-                                           ~ A private foundation
five percent of organizations surveyed participated in “Give to
the Max Day” representing all activity areas and budget sizes.
Nonprofits in Greater Minnesota were somewhat less likely to       legal, civil rights, advocacy and crime (69 percent) and health
participate, 43 percent versus nonprofits in the Twin Cities       and disease related (61 percent). Food and housing type
metro area at 74 percent. Sixty percent of nonprofits identified   organizations were the only ones to report an increase of foun-
between 1 and 10 new donors on this day, while 16 percent          dation and/or corporate giving, with over 20 percent report-
identified 11 to 25 new donors.                                    ing an increase. Less than half of organizations surveyed (45
                                                                   percent) will be within 91 percent or higher in achieving their
Eighty-six percent of nonprofits receive foundation and/or cor-    end of year goal for private grants.
porate grants and 55 percent reported a decline in grants
and/or commitments compared to 2008. The activity areas
that most often faced a decline in foundation and corporate
support were mental health and crisis intervention (74 percent),


Page 4
Nonprofits predict that 2010 will be tougher than 2009
Although 2009 was a difficult and challenging year for most
nonprofits, respondents predict an even gloomier 2010.
Because unemployment gains after the recession are not
expected until later in 2010, 62 percent of organizations
both predict an increase in demand for services and a
decline in total revenues next year. Sixty-six percent believe
that their organization will suffer from a decline in revenue
from foundations and corporate giving programs and 52 per-
cent think they will see individual contributions also decline.
Of the 69 percent of nonprofits that had an operating reserve
in 2009, 34 percent anticipate using it in 2010 and 67 per-
cent anticipate cash shortfalls during theyear.


“2009 has not been as difficult a year as the next
two will be. The 2007 Legislature was good for men-
tal health and we still benefited from that in 2009.
We are starting to see cuts for 2010 and anticipate
more via unallotment and potential reduction in
fees.”                                                                  *Response to the question: As you look at the next 12 months, what challenges
                                                                        are likely for your organization?
                           ~ A mental health organization


Recession Era Strategy and Planning
2009 was a year of uncertainty for nonprofit boards and man-         series of workshops on Recession Year Financial Leadership,
agers. The overall economy, state and county budgets, individ-       held in St. Paul, Mankato, Duluth, Grand Rapids, Brainerd and
ual spending and contributing are all spiraled downward, as          online as a Webinar
shown in MCN's Current Conditions survey. In the fourth quar-
                                                                     In 2009, many nonprofits took additional steps to respond to
ter of 2008, 2,798 Minnesota nonprofit employees filed initial
                                                                     the economy and its challenges of declining revenue and
unemployment claims, up 47 percent from 4th quarter 2007.
                                                                     increasing demand for services. These actions included:
While the U.S. 2007-2009 recession is technically considered
                                                                     • Analysis of financial and programmatic trends over the past
to have ended in May 2009, the lag in employment gains and
                                                                       1 to 3 years (58 percent)
the nature of nonprofit revenue streams (including reduced
                                                                     • Projection of revenue over the next 1 to 3 year (63 percent)
foundation assets and continuing Minnesota state budget
                                                                     • Development of several “what if” scenarios and contingen-
deficits) means a tough nonprofit economy at least through the
                                                                       cies based on various assumptions about funding changes
end of 2010.
                                                                       (65 percent)
Each individual organization’s story varied based on their           • Analysis of fully-allocated costs of programs, including indi-
activity area, revenue profile and amount of reserves; but clear-      rect expenses and the level of support for these programs
ly most organizations saw flat or reduced 2009 revenues. The           (46 percent)
major positive option was the effect of the federal stimulus         • Consideration of whether or not the organization should
package -- a partial salvation for the states $4.8 billion deficit     intentionally run a short-term or long-term deficit (29 per-
and welcome support for some nonprofit services.                       cent)
                                                                     • Renegotiation of terms with funding sources (14 percent)
In addition to MCN’s legislative and budget advocacy, in
2009 MCN and the Nonprofit Assistance Fund cosponsored a


“We are using careful strategic planning, combined                   “Our board of directors has been instrumental in help-
with transparency that supports an informed and pos-                 ing develop the strategic and financial acumen needed
itive work culture. We have a ‘we are all in this                    to move forward boldly through these times. People
together’ approach focusing on continuous improve-                   facing homelessness are depending on our success.”
ment to and focus on mission.”                                       ~ A homeless shelter/transitional housing organization
                           ~ A residential treatment center


                                                                                                                                               Page 5
MCN plans for 2010 and beyond
MCN will continue to provide information in 2010 to support                  Also during 2009 the Minnesota Council of Nonprofits under-
nonprofit boards and managers as they cope with a likely sec-                took its own strategic planning, identifying five major goals for
ond consecutive year of revenue uncertainty, including briefin-              the period 2010-2014:
gs with partner organizations such as the Nonprofit Assistance
                                                                             1. Strengthen the economic sustainability of individual nonprof-
Fund. In January, MCN will issue 2010 Fundraising and
                                                                                its and the nonprofit sector.
Revenue Outlook Reports for the ten primary nonprofit activity
areas used in this report, in a quick read format suitable for               2. Deepen relationships among member organizations to
boards of directors and finance and fundraising committees.                     increase knowledge, effectiveness and capacity for collec-
                                                                                tive action.
                                                                             3. Build bridges between nonprofits and key institutions (busi-
                                                                                ness, local government, philanthropy, etc.) to increase part-
                                                                                nership and cooperation.
                                                                             4. Increase opportunities for cost saving programs, shared
                                                                                services and shared spaces.
                                                                             5. Strengthen nonprofit community engagement.

Respondent distribution
639 MCN member organizations completed this
Current Conditions survey, representing a wide range
of activity areas and budget sizes; similar to the distri-
bution of nonprofit activity areas and sizes of organi-
zations in the state.
72 percent of the respondents were from the Twin
Cities Metro Area and 28 percent from Greater
Minnesota. (This is a higher representation from the
metro area than for Minnesota nonprofits as a whole.
The Twin Cities Metro Area holds 56 percent of all
nonprofits while 44 percent are located in Greater
Minnesota.)


                        2314 University Avenue West, Suite 20, Saint Paul, MN 55114
                        TeL: 651-642-1904 • 800-289-1904 • Fax: 651-642-1517 • www.mncn.org

About the Minnesota Council of Nonprofits
The Minnesota Council of Nonprofits (MCN) is the statewide association of more than 2,000 Minnesota nonprofit organizations. Through its
Web site, publications, workshops and events, cost-saving programs and advocacy, MCN works to inform, promote, connect and strengthen
individual nonprofits and the nonprofit sector.

Copyright ® 2009 Minnesota Council of Nonprofits. All rights reserved. Short sections of text may be quoted without explicit permission,
provided that full credit is given to the source. Additional copies of this report can be downloaded from MCN’s Web site at
www.mncn.org.


Page 6

Más contenido relacionado

La actualidad más candente

Building a new_payment_system-hfma
Building a new_payment_system-hfmaBuilding a new_payment_system-hfma
Building a new_payment_system-hfmarevenuecyclem
 
TBI and Related Resources in Rural America
TBI and Related Resources in Rural AmericaTBI and Related Resources in Rural America
TBI and Related Resources in Rural AmericaRuralTBIData
 
2011 making it better conference
2011 making it better conference2011 making it better conference
2011 making it better conferencehealthiermn
 
Financial assistance and community health needs benefits
Financial assistance and community health needs benefitsFinancial assistance and community health needs benefits
Financial assistance and community health needs benefitsEY
 
16_4_24CITReentry_Peer_Specialist_1
16_4_24CITReentry_Peer_Specialist_116_4_24CITReentry_Peer_Specialist_1
16_4_24CITReentry_Peer_Specialist_1Mishelle O'Shasky
 
May 26 2015 Reintegration Centre from Dentention JHST
May 26 2015 Reintegration Centre from Dentention JHSTMay 26 2015 Reintegration Centre from Dentention JHST
May 26 2015 Reintegration Centre from Dentention JHSTJeff Good
 
The role of microfinance institutions in disaster management
The role of microfinance institutions in disaster managementThe role of microfinance institutions in disaster management
The role of microfinance institutions in disaster managementAlexander Decker
 
2014_Philanthropy and Hurricane Sandy_Steven Lawrence
2014_Philanthropy and Hurricane Sandy_Steven Lawrence2014_Philanthropy and Hurricane Sandy_Steven Lawrence
2014_Philanthropy and Hurricane Sandy_Steven LawrenceSteven Lawrence
 
CommonHealth Newsletter - Spring 2010
CommonHealth Newsletter - Spring 2010CommonHealth Newsletter - Spring 2010
CommonHealth Newsletter - Spring 2010masscare
 
CommonHealth Newsletter - Spring 2007
CommonHealth Newsletter - Spring 2007CommonHealth Newsletter - Spring 2007
CommonHealth Newsletter - Spring 2007masscare
 
Reinventing How Health Systems Manage Revenue and Can Improve the Economics o...
Reinventing How Health Systems Manage Revenue and Can Improve the Economics o...Reinventing How Health Systems Manage Revenue and Can Improve the Economics o...
Reinventing How Health Systems Manage Revenue and Can Improve the Economics o...revenuecyclem
 
Direct Relief FY 2014 Annual Report
Direct Relief FY 2014 Annual ReportDirect Relief FY 2014 Annual Report
Direct Relief FY 2014 Annual ReportDirect Relief
 
Volunteer Management Thesis
Volunteer Management ThesisVolunteer Management Thesis
Volunteer Management ThesisPhelicia Hardy
 
2011 State of the Safety Net Report
2011 State of the Safety Net Report2011 State of the Safety Net Report
2011 State of the Safety Net ReportDirect Relief
 
CommonHealth Newsletter - Spring 2008
CommonHealth Newsletter - Spring 2008CommonHealth Newsletter - Spring 2008
CommonHealth Newsletter - Spring 2008masscare
 
CommonHealth Newsletter - Spring 2011
CommonHealth Newsletter - Spring 2011CommonHealth Newsletter - Spring 2011
CommonHealth Newsletter - Spring 2011masscare
 
CommonHealth Newsletter - Fall 2005
CommonHealth Newsletter - Fall 2005CommonHealth Newsletter - Fall 2005
CommonHealth Newsletter - Fall 2005masscare
 

La actualidad más candente (20)

Building a new_payment_system-hfma
Building a new_payment_system-hfmaBuilding a new_payment_system-hfma
Building a new_payment_system-hfma
 
TBI and Related Resources in Rural America
TBI and Related Resources in Rural AmericaTBI and Related Resources in Rural America
TBI and Related Resources in Rural America
 
Who had the idea to build up a village organization? Some evidence from Sene...
Who had the idea to build up a village organization?  Some evidence from Sene...Who had the idea to build up a village organization?  Some evidence from Sene...
Who had the idea to build up a village organization? Some evidence from Sene...
 
2011 making it better conference
2011 making it better conference2011 making it better conference
2011 making it better conference
 
Financial assistance and community health needs benefits
Financial assistance and community health needs benefitsFinancial assistance and community health needs benefits
Financial assistance and community health needs benefits
 
16_4_24CITReentry_Peer_Specialist_1
16_4_24CITReentry_Peer_Specialist_116_4_24CITReentry_Peer_Specialist_1
16_4_24CITReentry_Peer_Specialist_1
 
May 26 2015 Reintegration Centre from Dentention JHST
May 26 2015 Reintegration Centre from Dentention JHSTMay 26 2015 Reintegration Centre from Dentention JHST
May 26 2015 Reintegration Centre from Dentention JHST
 
The role of microfinance institutions in disaster management
The role of microfinance institutions in disaster managementThe role of microfinance institutions in disaster management
The role of microfinance institutions in disaster management
 
2014_Philanthropy and Hurricane Sandy_Steven Lawrence
2014_Philanthropy and Hurricane Sandy_Steven Lawrence2014_Philanthropy and Hurricane Sandy_Steven Lawrence
2014_Philanthropy and Hurricane Sandy_Steven Lawrence
 
CommonHealth Newsletter - Spring 2010
CommonHealth Newsletter - Spring 2010CommonHealth Newsletter - Spring 2010
CommonHealth Newsletter - Spring 2010
 
CommonHealth Newsletter - Spring 2007
CommonHealth Newsletter - Spring 2007CommonHealth Newsletter - Spring 2007
CommonHealth Newsletter - Spring 2007
 
Reinventing How Health Systems Manage Revenue and Can Improve the Economics o...
Reinventing How Health Systems Manage Revenue and Can Improve the Economics o...Reinventing How Health Systems Manage Revenue and Can Improve the Economics o...
Reinventing How Health Systems Manage Revenue and Can Improve the Economics o...
 
Direct Relief FY 2014 Annual Report
Direct Relief FY 2014 Annual ReportDirect Relief FY 2014 Annual Report
Direct Relief FY 2014 Annual Report
 
Country Presentation Tunisia
Country Presentation TunisiaCountry Presentation Tunisia
Country Presentation Tunisia
 
Volunteer Management Thesis
Volunteer Management ThesisVolunteer Management Thesis
Volunteer Management Thesis
 
Gary Goscenski Attracting And Keeping Donors
Gary Goscenski Attracting And Keeping DonorsGary Goscenski Attracting And Keeping Donors
Gary Goscenski Attracting And Keeping Donors
 
2011 State of the Safety Net Report
2011 State of the Safety Net Report2011 State of the Safety Net Report
2011 State of the Safety Net Report
 
CommonHealth Newsletter - Spring 2008
CommonHealth Newsletter - Spring 2008CommonHealth Newsletter - Spring 2008
CommonHealth Newsletter - Spring 2008
 
CommonHealth Newsletter - Spring 2011
CommonHealth Newsletter - Spring 2011CommonHealth Newsletter - Spring 2011
CommonHealth Newsletter - Spring 2011
 
CommonHealth Newsletter - Fall 2005
CommonHealth Newsletter - Fall 2005CommonHealth Newsletter - Fall 2005
CommonHealth Newsletter - Fall 2005
 

Destacado

Destacado (8)

2009 Minnesota Nonprofit Economy Report
2009 Minnesota Nonprofit Economy Report2009 Minnesota Nonprofit Economy Report
2009 Minnesota Nonprofit Economy Report
 
Voter Registration Toolbox
Voter Registration ToolboxVoter Registration Toolbox
Voter Registration Toolbox
 
Sta R%20 Chart[1]
Sta R%20 Chart[1]Sta R%20 Chart[1]
Sta R%20 Chart[1]
 
TripWolf vs Boo
TripWolf vs BooTripWolf vs Boo
TripWolf vs Boo
 
The mysterious 16_9_17_10
The mysterious 16_9_17_10The mysterious 16_9_17_10
The mysterious 16_9_17_10
 
The president of the united states
The president of the united statesThe president of the united states
The president of the united states
 
Legrand Bticino Katalog Living Light Light Tech
Legrand Bticino Katalog   Living Light Light TechLegrand Bticino Katalog   Living Light Light Tech
Legrand Bticino Katalog Living Light Light Tech
 
Upchurchpresentation
UpchurchpresentationUpchurchpresentation
Upchurchpresentation
 

Similar a Nonprofit Current Conditions Dec 2009

2005 Summer Newsletter
2005 Summer Newsletter2005 Summer Newsletter
2005 Summer NewsletterDirect Relief
 
Nonprofit Organization Revenue Origin MatrixBSHS373 Version.docx
Nonprofit Organization Revenue Origin MatrixBSHS373 Version.docxNonprofit Organization Revenue Origin MatrixBSHS373 Version.docx
Nonprofit Organization Revenue Origin MatrixBSHS373 Version.docxhenrymartin15260
 
Mncaa eval report_final_083112
Mncaa eval report_final_083112Mncaa eval report_final_083112
Mncaa eval report_final_083112soder145
 
The 5th Annual JOTW Strategic Communications Survey for 2022
The 5th Annual JOTW Strategic Communications Survey for 2022The 5th Annual JOTW Strategic Communications Survey for 2022
The 5th Annual JOTW Strategic Communications Survey for 2022Frank Strong
 
Shrm economic-conditions-financial-health-hiring
Shrm economic-conditions-financial-health-hiringShrm economic-conditions-financial-health-hiring
Shrm economic-conditions-financial-health-hiringSHRMRESEARCH
 
Key stats of small business survival rates
Key stats of small business survival ratesKey stats of small business survival rates
Key stats of small business survival ratesJuan Solana
 
Annual Report on the State of Philanthropy - North Macedonia 2018 - Quick Facts
Annual Report on the State of Philanthropy - North Macedonia 2018 - Quick FactsAnnual Report on the State of Philanthropy - North Macedonia 2018 - Quick Facts
Annual Report on the State of Philanthropy - North Macedonia 2018 - Quick FactsCatalyst Balkans
 
2013 Nonprofit Needs Assessment Brief
2013 Nonprofit Needs Assessment Brief2013 Nonprofit Needs Assessment Brief
2013 Nonprofit Needs Assessment Briefnotarini
 
Social media pres_05-26-2010 (1)
Social media pres_05-26-2010 (1)Social media pres_05-26-2010 (1)
Social media pres_05-26-2010 (1)Shari Weiss
 
Race in the workplace: The Black experience in the US private sector
Race in the workplace: The Black experience in the US private sectorRace in the workplace: The Black experience in the US private sector
Race in the workplace: The Black experience in the US private sectorMcKinsey & Company
 
Charity Survey 2012 Result
Charity Survey 2012 ResultCharity Survey 2012 Result
Charity Survey 2012 ResultVDS001
 
Experience With Microfinance In Paraguay
Experience With Microfinance In ParaguayExperience With Microfinance In Paraguay
Experience With Microfinance In Paraguayarlakan
 
2010 Economic Impact on Associations
2010 Economic Impact on Associations2010 Economic Impact on Associations
2010 Economic Impact on AssociationsMcKinley Advisors
 
2013 BioBuzz Employment Report Final
2013 BioBuzz Employment Report Final2013 BioBuzz Employment Report Final
2013 BioBuzz Employment Report FinalChris Frew
 
International Journal of Business and Management Invention (IJBMI)
International Journal of Business and Management Invention (IJBMI)International Journal of Business and Management Invention (IJBMI)
International Journal of Business and Management Invention (IJBMI)inventionjournals
 

Similar a Nonprofit Current Conditions Dec 2009 (20)

2005 Summer Newsletter
2005 Summer Newsletter2005 Summer Newsletter
2005 Summer Newsletter
 
Nonprofit Organization Revenue Origin MatrixBSHS373 Version.docx
Nonprofit Organization Revenue Origin MatrixBSHS373 Version.docxNonprofit Organization Revenue Origin MatrixBSHS373 Version.docx
Nonprofit Organization Revenue Origin MatrixBSHS373 Version.docx
 
McKinley EIA Study 2011
McKinley EIA Study 2011McKinley EIA Study 2011
McKinley EIA Study 2011
 
Mncaa eval report_final_083112
Mncaa eval report_final_083112Mncaa eval report_final_083112
Mncaa eval report_final_083112
 
The 5th Annual JOTW Strategic Communications Survey for 2022
The 5th Annual JOTW Strategic Communications Survey for 2022The 5th Annual JOTW Strategic Communications Survey for 2022
The 5th Annual JOTW Strategic Communications Survey for 2022
 
Nonprofits & The Economy Results: Northern Palm
Nonprofits & The Economy Results: Northern Palm Nonprofits & The Economy Results: Northern Palm
Nonprofits & The Economy Results: Northern Palm
 
Shrm economic-conditions-financial-health-hiring
Shrm economic-conditions-financial-health-hiringShrm economic-conditions-financial-health-hiring
Shrm economic-conditions-financial-health-hiring
 
Key stats of small business survival rates
Key stats of small business survival ratesKey stats of small business survival rates
Key stats of small business survival rates
 
Annual Report on the State of Philanthropy - North Macedonia 2018 - Quick Facts
Annual Report on the State of Philanthropy - North Macedonia 2018 - Quick FactsAnnual Report on the State of Philanthropy - North Macedonia 2018 - Quick Facts
Annual Report on the State of Philanthropy - North Macedonia 2018 - Quick Facts
 
2013 Nonprofit Needs Assessment Brief
2013 Nonprofit Needs Assessment Brief2013 Nonprofit Needs Assessment Brief
2013 Nonprofit Needs Assessment Brief
 
Social media pres_05-26-2010 (1)
Social media pres_05-26-2010 (1)Social media pres_05-26-2010 (1)
Social media pres_05-26-2010 (1)
 
Race in the workplace: The Black experience in the US private sector
Race in the workplace: The Black experience in the US private sectorRace in the workplace: The Black experience in the US private sector
Race in the workplace: The Black experience in the US private sector
 
Charity Survey 2012 Result
Charity Survey 2012 ResultCharity Survey 2012 Result
Charity Survey 2012 Result
 
Corporate sickness
Corporate sicknessCorporate sickness
Corporate sickness
 
Experience With Microfinance In Paraguay
Experience With Microfinance In ParaguayExperience With Microfinance In Paraguay
Experience With Microfinance In Paraguay
 
2010 Giving Survey
2010 Giving Survey2010 Giving Survey
2010 Giving Survey
 
AEO SBA Testimony (PRIME)
AEO SBA Testimony (PRIME)AEO SBA Testimony (PRIME)
AEO SBA Testimony (PRIME)
 
2010 Economic Impact on Associations
2010 Economic Impact on Associations2010 Economic Impact on Associations
2010 Economic Impact on Associations
 
2013 BioBuzz Employment Report Final
2013 BioBuzz Employment Report Final2013 BioBuzz Employment Report Final
2013 BioBuzz Employment Report Final
 
International Journal of Business and Management Invention (IJBMI)
International Journal of Business and Management Invention (IJBMI)International Journal of Business and Management Invention (IJBMI)
International Journal of Business and Management Invention (IJBMI)
 

Último

Choosing the Right CBSE School A Comprehensive Guide for Parents
Choosing the Right CBSE School A Comprehensive Guide for ParentsChoosing the Right CBSE School A Comprehensive Guide for Parents
Choosing the Right CBSE School A Comprehensive Guide for Parentsnavabharathschool99
 
Barangay Council for the Protection of Children (BCPC) Orientation.pptx
Barangay Council for the Protection of Children (BCPC) Orientation.pptxBarangay Council for the Protection of Children (BCPC) Orientation.pptx
Barangay Council for the Protection of Children (BCPC) Orientation.pptxCarlos105
 
Science 7 Quarter 4 Module 2: Natural Resources.pptx
Science 7 Quarter 4 Module 2: Natural Resources.pptxScience 7 Quarter 4 Module 2: Natural Resources.pptx
Science 7 Quarter 4 Module 2: Natural Resources.pptxMaryGraceBautista27
 
Proudly South Africa powerpoint Thorisha.pptx
Proudly South Africa powerpoint Thorisha.pptxProudly South Africa powerpoint Thorisha.pptx
Proudly South Africa powerpoint Thorisha.pptxthorishapillay1
 
THEORIES OF ORGANIZATION-PUBLIC ADMINISTRATION
THEORIES OF ORGANIZATION-PUBLIC ADMINISTRATIONTHEORIES OF ORGANIZATION-PUBLIC ADMINISTRATION
THEORIES OF ORGANIZATION-PUBLIC ADMINISTRATIONHumphrey A Beña
 
ECONOMIC CONTEXT - PAPER 1 Q3: NEWSPAPERS.pptx
ECONOMIC CONTEXT - PAPER 1 Q3: NEWSPAPERS.pptxECONOMIC CONTEXT - PAPER 1 Q3: NEWSPAPERS.pptx
ECONOMIC CONTEXT - PAPER 1 Q3: NEWSPAPERS.pptxiammrhaywood
 
ECONOMIC CONTEXT - LONG FORM TV DRAMA - PPT
ECONOMIC CONTEXT - LONG FORM TV DRAMA - PPTECONOMIC CONTEXT - LONG FORM TV DRAMA - PPT
ECONOMIC CONTEXT - LONG FORM TV DRAMA - PPTiammrhaywood
 
ISYU TUNGKOL SA SEKSWLADIDA (ISSUE ABOUT SEXUALITY
ISYU TUNGKOL SA SEKSWLADIDA (ISSUE ABOUT SEXUALITYISYU TUNGKOL SA SEKSWLADIDA (ISSUE ABOUT SEXUALITY
ISYU TUNGKOL SA SEKSWLADIDA (ISSUE ABOUT SEXUALITYKayeClaireEstoconing
 
ENGLISH 7_Q4_LESSON 2_ Employing a Variety of Strategies for Effective Interp...
ENGLISH 7_Q4_LESSON 2_ Employing a Variety of Strategies for Effective Interp...ENGLISH 7_Q4_LESSON 2_ Employing a Variety of Strategies for Effective Interp...
ENGLISH 7_Q4_LESSON 2_ Employing a Variety of Strategies for Effective Interp...JhezDiaz1
 
DATA STRUCTURE AND ALGORITHM for beginners
DATA STRUCTURE AND ALGORITHM for beginnersDATA STRUCTURE AND ALGORITHM for beginners
DATA STRUCTURE AND ALGORITHM for beginnersSabitha Banu
 
Full Stack Web Development Course for Beginners
Full Stack Web Development Course  for BeginnersFull Stack Web Development Course  for Beginners
Full Stack Web Development Course for BeginnersSabitha Banu
 
What is Model Inheritance in Odoo 17 ERP
What is Model Inheritance in Odoo 17 ERPWhat is Model Inheritance in Odoo 17 ERP
What is Model Inheritance in Odoo 17 ERPCeline George
 
ACC 2024 Chronicles. Cardiology. Exam.pdf
ACC 2024 Chronicles. Cardiology. Exam.pdfACC 2024 Chronicles. Cardiology. Exam.pdf
ACC 2024 Chronicles. Cardiology. Exam.pdfSpandanaRallapalli
 
Computed Fields and api Depends in the Odoo 17
Computed Fields and api Depends in the Odoo 17Computed Fields and api Depends in the Odoo 17
Computed Fields and api Depends in the Odoo 17Celine George
 
GRADE 4 - SUMMATIVE TEST QUARTER 4 ALL SUBJECTS
GRADE 4 - SUMMATIVE TEST QUARTER 4 ALL SUBJECTSGRADE 4 - SUMMATIVE TEST QUARTER 4 ALL SUBJECTS
GRADE 4 - SUMMATIVE TEST QUARTER 4 ALL SUBJECTSJoshuaGantuangco2
 
HỌC TỐT TIẾNG ANH 11 THEO CHƯƠNG TRÌNH GLOBAL SUCCESS ĐÁP ÁN CHI TIẾT - CẢ NĂ...
HỌC TỐT TIẾNG ANH 11 THEO CHƯƠNG TRÌNH GLOBAL SUCCESS ĐÁP ÁN CHI TIẾT - CẢ NĂ...HỌC TỐT TIẾNG ANH 11 THEO CHƯƠNG TRÌNH GLOBAL SUCCESS ĐÁP ÁN CHI TIẾT - CẢ NĂ...
HỌC TỐT TIẾNG ANH 11 THEO CHƯƠNG TRÌNH GLOBAL SUCCESS ĐÁP ÁN CHI TIẾT - CẢ NĂ...Nguyen Thanh Tu Collection
 
Karra SKD Conference Presentation Revised.pptx
Karra SKD Conference Presentation Revised.pptxKarra SKD Conference Presentation Revised.pptx
Karra SKD Conference Presentation Revised.pptxAshokKarra1
 

Último (20)

YOUVE GOT EMAIL_FINALS_EL_DORADO_2024.pptx
YOUVE GOT EMAIL_FINALS_EL_DORADO_2024.pptxYOUVE GOT EMAIL_FINALS_EL_DORADO_2024.pptx
YOUVE GOT EMAIL_FINALS_EL_DORADO_2024.pptx
 
Choosing the Right CBSE School A Comprehensive Guide for Parents
Choosing the Right CBSE School A Comprehensive Guide for ParentsChoosing the Right CBSE School A Comprehensive Guide for Parents
Choosing the Right CBSE School A Comprehensive Guide for Parents
 
Barangay Council for the Protection of Children (BCPC) Orientation.pptx
Barangay Council for the Protection of Children (BCPC) Orientation.pptxBarangay Council for the Protection of Children (BCPC) Orientation.pptx
Barangay Council for the Protection of Children (BCPC) Orientation.pptx
 
Science 7 Quarter 4 Module 2: Natural Resources.pptx
Science 7 Quarter 4 Module 2: Natural Resources.pptxScience 7 Quarter 4 Module 2: Natural Resources.pptx
Science 7 Quarter 4 Module 2: Natural Resources.pptx
 
Proudly South Africa powerpoint Thorisha.pptx
Proudly South Africa powerpoint Thorisha.pptxProudly South Africa powerpoint Thorisha.pptx
Proudly South Africa powerpoint Thorisha.pptx
 
THEORIES OF ORGANIZATION-PUBLIC ADMINISTRATION
THEORIES OF ORGANIZATION-PUBLIC ADMINISTRATIONTHEORIES OF ORGANIZATION-PUBLIC ADMINISTRATION
THEORIES OF ORGANIZATION-PUBLIC ADMINISTRATION
 
ECONOMIC CONTEXT - PAPER 1 Q3: NEWSPAPERS.pptx
ECONOMIC CONTEXT - PAPER 1 Q3: NEWSPAPERS.pptxECONOMIC CONTEXT - PAPER 1 Q3: NEWSPAPERS.pptx
ECONOMIC CONTEXT - PAPER 1 Q3: NEWSPAPERS.pptx
 
ECONOMIC CONTEXT - LONG FORM TV DRAMA - PPT
ECONOMIC CONTEXT - LONG FORM TV DRAMA - PPTECONOMIC CONTEXT - LONG FORM TV DRAMA - PPT
ECONOMIC CONTEXT - LONG FORM TV DRAMA - PPT
 
ISYU TUNGKOL SA SEKSWLADIDA (ISSUE ABOUT SEXUALITY
ISYU TUNGKOL SA SEKSWLADIDA (ISSUE ABOUT SEXUALITYISYU TUNGKOL SA SEKSWLADIDA (ISSUE ABOUT SEXUALITY
ISYU TUNGKOL SA SEKSWLADIDA (ISSUE ABOUT SEXUALITY
 
ENGLISH 7_Q4_LESSON 2_ Employing a Variety of Strategies for Effective Interp...
ENGLISH 7_Q4_LESSON 2_ Employing a Variety of Strategies for Effective Interp...ENGLISH 7_Q4_LESSON 2_ Employing a Variety of Strategies for Effective Interp...
ENGLISH 7_Q4_LESSON 2_ Employing a Variety of Strategies for Effective Interp...
 
Model Call Girl in Tilak Nagar Delhi reach out to us at 🔝9953056974🔝
Model Call Girl in Tilak Nagar Delhi reach out to us at 🔝9953056974🔝Model Call Girl in Tilak Nagar Delhi reach out to us at 🔝9953056974🔝
Model Call Girl in Tilak Nagar Delhi reach out to us at 🔝9953056974🔝
 
DATA STRUCTURE AND ALGORITHM for beginners
DATA STRUCTURE AND ALGORITHM for beginnersDATA STRUCTURE AND ALGORITHM for beginners
DATA STRUCTURE AND ALGORITHM for beginners
 
Full Stack Web Development Course for Beginners
Full Stack Web Development Course  for BeginnersFull Stack Web Development Course  for Beginners
Full Stack Web Development Course for Beginners
 
LEFT_ON_C'N_ PRELIMS_EL_DORADO_2024.pptx
LEFT_ON_C'N_ PRELIMS_EL_DORADO_2024.pptxLEFT_ON_C'N_ PRELIMS_EL_DORADO_2024.pptx
LEFT_ON_C'N_ PRELIMS_EL_DORADO_2024.pptx
 
What is Model Inheritance in Odoo 17 ERP
What is Model Inheritance in Odoo 17 ERPWhat is Model Inheritance in Odoo 17 ERP
What is Model Inheritance in Odoo 17 ERP
 
ACC 2024 Chronicles. Cardiology. Exam.pdf
ACC 2024 Chronicles. Cardiology. Exam.pdfACC 2024 Chronicles. Cardiology. Exam.pdf
ACC 2024 Chronicles. Cardiology. Exam.pdf
 
Computed Fields and api Depends in the Odoo 17
Computed Fields and api Depends in the Odoo 17Computed Fields and api Depends in the Odoo 17
Computed Fields and api Depends in the Odoo 17
 
GRADE 4 - SUMMATIVE TEST QUARTER 4 ALL SUBJECTS
GRADE 4 - SUMMATIVE TEST QUARTER 4 ALL SUBJECTSGRADE 4 - SUMMATIVE TEST QUARTER 4 ALL SUBJECTS
GRADE 4 - SUMMATIVE TEST QUARTER 4 ALL SUBJECTS
 
HỌC TỐT TIẾNG ANH 11 THEO CHƯƠNG TRÌNH GLOBAL SUCCESS ĐÁP ÁN CHI TIẾT - CẢ NĂ...
HỌC TỐT TIẾNG ANH 11 THEO CHƯƠNG TRÌNH GLOBAL SUCCESS ĐÁP ÁN CHI TIẾT - CẢ NĂ...HỌC TỐT TIẾNG ANH 11 THEO CHƯƠNG TRÌNH GLOBAL SUCCESS ĐÁP ÁN CHI TIẾT - CẢ NĂ...
HỌC TỐT TIẾNG ANH 11 THEO CHƯƠNG TRÌNH GLOBAL SUCCESS ĐÁP ÁN CHI TIẾT - CẢ NĂ...
 
Karra SKD Conference Presentation Revised.pptx
Karra SKD Conference Presentation Revised.pptxKarra SKD Conference Presentation Revised.pptx
Karra SKD Conference Presentation Revised.pptx
 

Nonprofit Current Conditions Dec 2009

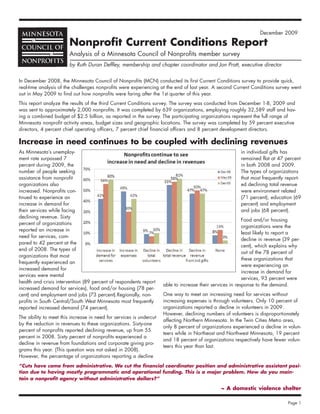
  • 1. December 2009 Nonprofit Current Conditions Report Analysis of a Minnesota Council of Nonprofits member survey by Ruth Duran Deffley, membership and chapter coordinator and Jon Pratt, executive director In December 2008, the Minnesota Council of Nonprofits (MCN) conducted its first Current Conditions survey to provide quick, real-time analysis of the challenges nonprofits were experiencing at the end of last year. A second Current Conditions survey went out in May 2009 to find out how nonprofits were faring after the 1st quarter of this year. This report analyze the results of the third Current Conditions survey. The survey was conducted from December 1-8, 2009 and was sent to approximately 2,000 nonprofits. It was completed by 639 organizations, employing roughly 32,589 staff and hav- ing a combined budget of $2.5 billion, as reported in the survey. The participating organizations represent the full range of Minnesota nonprofit activity areas, budget sizes and geographic locations. The survey was completed by 59 percent executive directors, 4 percent chief operating officers, 7 percent chief financial officers and 8 percent development directors. Increase in need continues to be coupled with declining revenues As Minnesota’s unemploy- in individual gifts has ment rate surpassed 7 remained flat at 47 percent percent during 2009, the in both 2008 and 2009. number of people seeking The types of organizations assistance from nonprofit that most frequently report- organizations also ed declining total revenue increased. Nonprofits con- were environment related tinued to experience an (71 percent), education (69 increase in demand for percent) and employment their services while facing and jobs (68 percent). declining revenue. Sixty Food and/or housing percent of organizations organizations were the reported an increase in least likely to report a need for services, com- decline in revenue (39 per- pared to 42 percent at the cent), which explains why end of 2008. The types of out of the 78 percent of organizations that most these organizations that frequently experienced an were experiencing an increased demand for increase in demand for services were mental services, 93 percent were health and crisis intervention (89 percent of respondents report able to increase their services in response to the demand. increased demand for services), food and/or housing (78 per- cent) and employment and jobs (73 percent).Regionally, non- One way to meet an increasing need for services without profits in South Central/South West Minnesota most frequently increasing expenses is through volunteers. Only 10 percent of reported increased demand (74 percent). organizations reported a decline in volunteers in 2009. However, declining numbers of volunteers is disproportionately The ability to meet this increase in need for services is undercut affecting Northern Minnesota. In the Twin Cities Metro area, by the reduction in revenues to these organizations. Sixty-one only 8 percent of organizations experienced a decline in volun- percent of nonprofits reported declining revenue, up from 55 teers while in Northeast and Northwest Minnesota, 19 percent percent in 2008. Sixty percent of nonprofits experienced a and 18 percent of organizations respectively have fewer volun- decline in revenue from foundations and corporate giving pro- teers this year than last. grams this year. (This question was not asked in 2008). However, the percentage of organizations reporting a decline “Cuts have come from administrative. We cut the financial coordinator position and administrative assistant posi- tion due to having mostly programmatic and operational funding. This is a major problem. How do you main- tain a nonprofit agency without administrative dollars?” ~ A domestic violence shelter Page 1
  • 2. Small nonprofits have particular challenges Minnesota organizations with budges under $400,000 per year have faced the most difficulty in 2009. Sixty-three percent of small organizations experienced a decline in total revenue and 25 per- cent anticipate a cash shortfall next year. Although 59 percent have increased their fundraising efforts, 38 percent do not have reserves available and 86 percent do not have access to a line of credit. Staff reductions and other measures used by nonprofits to weather the recession To manage the effects of the economy, 32 percent of nonprofits Additional measures that nonprofits took during the recession have reduced their number of employees, 52 percent have in 2009 were reducing their overall budget (52 percent), implemented hiring freezes and/or salary freezes, and 25 per- reductions in programming (21 percent) and putting expansion cent have reduced employee benefits. The larger the organiza- plans on hold (22 percent). Thirty-seven percent of organiza- tion, the more likely it was to have cut employee benefits. tions held a fundraising special event this year and of these, Thirty-four percent of very large organizations (budget size 40 percent saw an increase in income generated from the over $10 million) reduced benefits, as did 32 percent of large event when compared to last year, while 40 percent had a organizations (budget size between $3 and $10 million). The decrease in special event income. types of organizations that most often faced staff reductions were health and/or disease related (42 percent), employment and jobs (41 percent) and mental health and crisis intervention (41 percent). “Despite cutting our staffing and expenses by about 30% since last fall, we have still been able to provide the same quality and level of services to our clients. We’ve been creative about how we go about doing our work and utilizing volunteers to accomplish our mission.” ~ A health organization working with children “Although we have not laid off staff, we have delayed hiring vacated positions. We also reduced specific staff hours during less busy times. We have instituted a salary freeze and also a reduction in contribution to retirement accounts. The goal is to keep the same servic- es available.” ~ A human services organization Page 2
  • 3. The American Recovery and Reinvestment Act of 2009 has helped some nonprofits On February 17, 2009 President Obama signed the American lowed by human services and/or youth development (57 per- Recovery and Reinvestment Act, parts of which provided non- cent) and legal, civil rights, advocacy and/or crime (55 per- profits opportunities for additional federal dollars. Thirty per- cent). Organizations with budgets over $3 million were the cent of respondents applied for these funds in 2009 and 53 most likely to apply for and receive stimulus funds. They not percent of those were successful. For organizations that decid- only have the capacity to apply for federal grants but also the ed not to pursue stimulus funds, the primary reason was that ability to manage the funds once obtained. the purpose of the funds did not fit the organization (74 per- Seventy-four percent of organizations that were selected to cent). While 12 percent reported that they did not have the receive stimulus funds have already received them by time or resources to apply and 5 percent did not have the December 2009, reflecting the legislative intent to quickly get resources to manage government funding. Employment and job money into the economy. Sixty-four percent have used the funds related organizations and food and/or housing organizations to retain existing staff and 50 percent have hired new employ- were the most likely to receive stimulus money (70 percent), fol- ees. Fifty-two percent have also increased programs. Employment gains; delays of payment problems reported Despite the challenging economic environment or perhaps in The type of revenue an organization relies upon has major response to increased need for their services, 20 percent of non- implications for financial management and program planning. profits reported hiring additional staff in 2009. Human services Overall, 30 percent of organizations in the survey have gov- and/or youth development organizations were the most likely to ernment funding as their largest single source of revenue and hire new staff (32 percent), followed by food and/or housing 64 percent of all nonprofits receive some type of government (12 percent) and health and/or disease (11 percent). Central funding. Nonprofits that receive the majority of their govern- Minnesota reported the highest percentage of nonprofits hiring ment funds from the federal government reported increased staff (32 percent). Of these organizations that were able to hire delays in payments from the federal government, (32 percent new staff, 58 percent also increased their fundraising activities when compared to 19 percent in May). In contrast, fewer non- during the year. Forty-two percent applied for federal stimulus profits that receive most of their government funds from county funds and, of those, 66 percent were selected to receive funds government reported delayed payments, (28 percent, down while 11 percent are still pending. from 32 percent in May). State government payments experi- enced the least amount of change, with 27 percent of nonprof- its that receive the majority of their government funds from the “We have been in the very difficult, uncomfortable state experiencing delayed payments in December and 25 and painful position of needing to terminate staff percent in May. (because of reductions in funding from corporations and foundations) at the same time we were hiring staff with funding from the economic recovery act.” ~ A youth development organization Page 3
  • 4. Cash flow issues are common across activities and sizes Organizations that receive the largest percentage of their rev- In the May survey, earned income (any self-generated revenue enue from government are the least likely to experience cash from service, facility rental or product, not from a government flow problems, at 29 percent. Nonprofits that rely on individual source) stood out as the most reliable stream of revenue. In that contributions as their largest source of revenue were second, report, 38 percent of nonprofits that relied on earned income with 38 percent experiencing cash flow problems. as their largest single source of revenue reported a decrease in Organizations that relied primarily on foundations or had revenue. Now 50 percent of the same type of nonprofits report- earned income as their main source of revenue were the most ed a decline in revenue and only 25 percent expect to be with- likely to have cash flow problems, 58 percent and 57 percent in 91 percent of their end of year goal in earned income down respectively. Revenue source appears to be a significant predic- from 45 percent in May. tor of whether an organization will have cash flow problems regardless of activity area or budget size. Individual contributions and GiveMN.org’s “Give to the Max Day” Ninety-one percent of organizations report receiving individual contributions, and half of these saw their individual contribu- tions decline in 2009. However, 21 percent reported an increase in individual contributions when compared to 2008. The types of organizations that most often reported an increase in individual giving were mental health and crisis intervention (35 percent), food and/or housing (31 percent) and arts, cul- ture and humanities (26 percent). Those organizations that most often saw a decrease in individual contributions were legal, civil rights and advocacy (54 percent), job and employ- ment (50 percent) and human services and/or youth develop- ment (45 percent). Organizations in Northeast Minnesota were most likely to report a decline in individual giving at 52 percent. Sixty-two percent of overall survey respondents report that when compared to 2008’s 4th quarter, individual contribu- tions have decreased both in the average amount and number of contributions. In November 2009, a new Web site, GiveMN.org, was launched to encourage individual contributions and make online donating more accessible to both nonprofits and donors. On November 17, the Bush, Minneapolis and St. Paul “Being a grant giving organization, we do struggle to Foundations sponsored “Give to Max Day,” on which dona- receive grants, so we rely more on individual giving tions made that day through GiveMN.org site would be and that has declined dramatically and with staff matched in part by the three foundations, up to a total match reductions, we now don’t have the manpower to keep of $500,000. Minnesotans set a national record that day, pursuing contributions.” raising $14 million in charitable donations in one day. Sixty- ~ A private foundation five percent of organizations surveyed participated in “Give to the Max Day” representing all activity areas and budget sizes. Nonprofits in Greater Minnesota were somewhat less likely to legal, civil rights, advocacy and crime (69 percent) and health participate, 43 percent versus nonprofits in the Twin Cities and disease related (61 percent). Food and housing type metro area at 74 percent. Sixty percent of nonprofits identified organizations were the only ones to report an increase of foun- between 1 and 10 new donors on this day, while 16 percent dation and/or corporate giving, with over 20 percent report- identified 11 to 25 new donors. ing an increase. Less than half of organizations surveyed (45 percent) will be within 91 percent or higher in achieving their Eighty-six percent of nonprofits receive foundation and/or cor- end of year goal for private grants. porate grants and 55 percent reported a decline in grants and/or commitments compared to 2008. The activity areas that most often faced a decline in foundation and corporate support were mental health and crisis intervention (74 percent), Page 4
  • 5. Nonprofits predict that 2010 will be tougher than 2009 Although 2009 was a difficult and challenging year for most nonprofits, respondents predict an even gloomier 2010. Because unemployment gains after the recession are not expected until later in 2010, 62 percent of organizations both predict an increase in demand for services and a decline in total revenues next year. Sixty-six percent believe that their organization will suffer from a decline in revenue from foundations and corporate giving programs and 52 per- cent think they will see individual contributions also decline. Of the 69 percent of nonprofits that had an operating reserve in 2009, 34 percent anticipate using it in 2010 and 67 per- cent anticipate cash shortfalls during theyear. “2009 has not been as difficult a year as the next two will be. The 2007 Legislature was good for men- tal health and we still benefited from that in 2009. We are starting to see cuts for 2010 and anticipate more via unallotment and potential reduction in fees.” *Response to the question: As you look at the next 12 months, what challenges are likely for your organization? ~ A mental health organization Recession Era Strategy and Planning 2009 was a year of uncertainty for nonprofit boards and man- series of workshops on Recession Year Financial Leadership, agers. The overall economy, state and county budgets, individ- held in St. Paul, Mankato, Duluth, Grand Rapids, Brainerd and ual spending and contributing are all spiraled downward, as online as a Webinar shown in MCN's Current Conditions survey. In the fourth quar- In 2009, many nonprofits took additional steps to respond to ter of 2008, 2,798 Minnesota nonprofit employees filed initial the economy and its challenges of declining revenue and unemployment claims, up 47 percent from 4th quarter 2007. increasing demand for services. These actions included: While the U.S. 2007-2009 recession is technically considered • Analysis of financial and programmatic trends over the past to have ended in May 2009, the lag in employment gains and 1 to 3 years (58 percent) the nature of nonprofit revenue streams (including reduced • Projection of revenue over the next 1 to 3 year (63 percent) foundation assets and continuing Minnesota state budget • Development of several “what if” scenarios and contingen- deficits) means a tough nonprofit economy at least through the cies based on various assumptions about funding changes end of 2010. (65 percent) Each individual organization’s story varied based on their • Analysis of fully-allocated costs of programs, including indi- activity area, revenue profile and amount of reserves; but clear- rect expenses and the level of support for these programs ly most organizations saw flat or reduced 2009 revenues. The (46 percent) major positive option was the effect of the federal stimulus • Consideration of whether or not the organization should package -- a partial salvation for the states $4.8 billion deficit intentionally run a short-term or long-term deficit (29 per- and welcome support for some nonprofit services. cent) • Renegotiation of terms with funding sources (14 percent) In addition to MCN’s legislative and budget advocacy, in 2009 MCN and the Nonprofit Assistance Fund cosponsored a “We are using careful strategic planning, combined “Our board of directors has been instrumental in help- with transparency that supports an informed and pos- ing develop the strategic and financial acumen needed itive work culture. We have a ‘we are all in this to move forward boldly through these times. People together’ approach focusing on continuous improve- facing homelessness are depending on our success.” ment to and focus on mission.” ~ A homeless shelter/transitional housing organization ~ A residential treatment center Page 5
  • 6. MCN plans for 2010 and beyond MCN will continue to provide information in 2010 to support Also during 2009 the Minnesota Council of Nonprofits under- nonprofit boards and managers as they cope with a likely sec- took its own strategic planning, identifying five major goals for ond consecutive year of revenue uncertainty, including briefin- the period 2010-2014: gs with partner organizations such as the Nonprofit Assistance 1. Strengthen the economic sustainability of individual nonprof- Fund. In January, MCN will issue 2010 Fundraising and its and the nonprofit sector. Revenue Outlook Reports for the ten primary nonprofit activity areas used in this report, in a quick read format suitable for 2. Deepen relationships among member organizations to boards of directors and finance and fundraising committees. increase knowledge, effectiveness and capacity for collec- tive action. 3. Build bridges between nonprofits and key institutions (busi- ness, local government, philanthropy, etc.) to increase part- nership and cooperation. 4. Increase opportunities for cost saving programs, shared services and shared spaces. 5. Strengthen nonprofit community engagement. Respondent distribution 639 MCN member organizations completed this Current Conditions survey, representing a wide range of activity areas and budget sizes; similar to the distri- bution of nonprofit activity areas and sizes of organi- zations in the state. 72 percent of the respondents were from the Twin Cities Metro Area and 28 percent from Greater Minnesota. (This is a higher representation from the metro area than for Minnesota nonprofits as a whole. The Twin Cities Metro Area holds 56 percent of all nonprofits while 44 percent are located in Greater Minnesota.) 2314 University Avenue West, Suite 20, Saint Paul, MN 55114 TeL: 651-642-1904 • 800-289-1904 • Fax: 651-642-1517 • www.mncn.org About the Minnesota Council of Nonprofits The Minnesota Council of Nonprofits (MCN) is the statewide association of more than 2,000 Minnesota nonprofit organizations. Through its Web site, publications, workshops and events, cost-saving programs and advocacy, MCN works to inform, promote, connect and strengthen individual nonprofits and the nonprofit sector. Copyright ® 2009 Minnesota Council of Nonprofits. All rights reserved. Short sections of text may be quoted without explicit permission, provided that full credit is given to the source. Additional copies of this report can be downloaded from MCN’s Web site at www.mncn.org. Page 6