SlideShare una empresa de Scribd logo
1 de 1
y = a +bx a = mean temperature at sea level b = lapse rate (rate at which  temperature changes) y = predicted temperature image x = DEM y = 19.069720 + (- 0.004833) x Local Climate Change Analysis in Rio Branco, Brazil By Rebecca Alper and Rahul Rakshit Reclass Boolean Anomalies Greybody Reclass Predicted Temperature SRTM Distance Landcover Emissivity Introduction Conclusion Methodology Acknowledgements Climate change at a global scale is well documented in the scientific community. Regional or local climate change is a subject that has not gained as much attention by scientists but has important ramifications for regions such as rainforests in Brazil. With the advent of the ‘thermal band’ in satellite imagery, such investigations at a finer resolution are now possible.  Aim:  Our study focuses on the effects of deforestation on climate in and around Rio Branco, Brazil, as it is representative of large-scale deforestation.  Hypothesis:   We hypothesized that deforested areas, correcting for differences in elevation, should have higher temperatures than their forested counterparts.  We used the Landsat thermal band 6.1 coupled with a classified landcover map of the area to model temperature anomalies as distance from forest increases. Our research also tested the new ‘Thermal module’ in IDRISI Andes, inputting an emissivity image created from Landsat Bands 3 and 4 using NDVI.  We conclude from the study that although there exists some relationship between distance and temperature anomalies but their direction and amount are non uniform. Therefore, this study warrants further inquiry. We would like to thank Professor Ron Eastman for the project suggestion and subsequent advising, Jacqueline Vadjunec and her team for providing the classified landcover map, University of Maryland for the satellite imagery, Google Earth, and IDRISI for all the help on this project.  Landcover Landsat Thermal (6.1) SRTM Difference 7X7 Filter Reclass Boolean Landsat Bands 3:4 NDVI Emissivity Thermal Greybody Resample  30 m  Regress Distance Reclass Temperature Anomalies Regress ANOMALIES DISTANCE

Más contenido relacionado

La actualidad más candente

2015Sum_LaRC_ArizonaHAQ_Presentation_FD
2015Sum_LaRC_ArizonaHAQ_Presentation_FD2015Sum_LaRC_ArizonaHAQ_Presentation_FD
2015Sum_LaRC_ArizonaHAQ_Presentation_FD
Emma Singh Baghel
 
SIMULATED SEASONAL SPATIO-TEMPORAL PATTERNS OF SOIL MOISTURE, TEMPERATURE, AN...
SIMULATED SEASONAL SPATIO-TEMPORAL PATTERNS OF SOIL MOISTURE, TEMPERATURE, AN...SIMULATED SEASONAL SPATIO-TEMPORAL PATTERNS OF SOIL MOISTURE, TEMPERATURE, AN...
SIMULATED SEASONAL SPATIO-TEMPORAL PATTERNS OF SOIL MOISTURE, TEMPERATURE, AN...
grssieee
 
IGARSS_July2011_CANEX_SH.ppt
IGARSS_July2011_CANEX_SH.pptIGARSS_July2011_CANEX_SH.ppt
IGARSS_July2011_CANEX_SH.ppt
grssieee
 
poster_ams2014_Kamal
poster_ams2014_Kamalposter_ams2014_Kamal
poster_ams2014_Kamal
Samy Kamal
 
igarss11_rudiger.ppt
igarss11_rudiger.pptigarss11_rudiger.ppt
igarss11_rudiger.ppt
grssieee
 
Undergraduate Research Poster
Undergraduate Research PosterUndergraduate Research Poster
Undergraduate Research Poster
Parker Malek
 
GENERATING FINE RESOLUTION LEAF AREA INDEX MAPS FOR BOREAL FORESTS OF FINLAND...
GENERATING FINE RESOLUTION LEAF AREA INDEX MAPS FOR BOREAL FORESTS OF FINLAND...GENERATING FINE RESOLUTION LEAF AREA INDEX MAPS FOR BOREAL FORESTS OF FINLAND...
GENERATING FINE RESOLUTION LEAF AREA INDEX MAPS FOR BOREAL FORESTS OF FINLAND...
grssieee
 

La actualidad más candente (18)

2015Sum_LaRC_ArizonaHAQ_Presentation_FD
2015Sum_LaRC_ArizonaHAQ_Presentation_FD2015Sum_LaRC_ArizonaHAQ_Presentation_FD
2015Sum_LaRC_ArizonaHAQ_Presentation_FD
 
Poster Nov19 V2
Poster Nov19 V2Poster Nov19 V2
Poster Nov19 V2
 
Why is it difficult to resolve future projections of Arctic-midlatitude linka...
Why is it difficult to resolve future projections of Arctic-midlatitude linka...Why is it difficult to resolve future projections of Arctic-midlatitude linka...
Why is it difficult to resolve future projections of Arctic-midlatitude linka...
 
SIMULATED SEASONAL SPATIO-TEMPORAL PATTERNS OF SOIL MOISTURE, TEMPERATURE, AN...
SIMULATED SEASONAL SPATIO-TEMPORAL PATTERNS OF SOIL MOISTURE, TEMPERATURE, AN...SIMULATED SEASONAL SPATIO-TEMPORAL PATTERNS OF SOIL MOISTURE, TEMPERATURE, AN...
SIMULATED SEASONAL SPATIO-TEMPORAL PATTERNS OF SOIL MOISTURE, TEMPERATURE, AN...
 
IGARSS_July2011_CANEX_SH.ppt
IGARSS_July2011_CANEX_SH.pptIGARSS_July2011_CANEX_SH.ppt
IGARSS_July2011_CANEX_SH.ppt
 
poster_ams2014_Kamal
poster_ams2014_Kamalposter_ams2014_Kamal
poster_ams2014_Kamal
 
igarss11_rudiger.ppt
igarss11_rudiger.pptigarss11_rudiger.ppt
igarss11_rudiger.ppt
 
Observations and climate model projections of Arctic climate change
Observations and climate model projections of Arctic climate changeObservations and climate model projections of Arctic climate change
Observations and climate model projections of Arctic climate change
 
Undergraduate Research Poster
Undergraduate Research PosterUndergraduate Research Poster
Undergraduate Research Poster
 
MA Thesis Presentation
MA Thesis PresentationMA Thesis Presentation
MA Thesis Presentation
 
GENERATING FINE RESOLUTION LEAF AREA INDEX MAPS FOR BOREAL FORESTS OF FINLAND...
GENERATING FINE RESOLUTION LEAF AREA INDEX MAPS FOR BOREAL FORESTS OF FINLAND...GENERATING FINE RESOLUTION LEAF AREA INDEX MAPS FOR BOREAL FORESTS OF FINLAND...
GENERATING FINE RESOLUTION LEAF AREA INDEX MAPS FOR BOREAL FORESTS OF FINLAND...
 
Leaf Area Index (LAI) in the quantification of vegetation disturbance in Iris...
Leaf Area Index (LAI) in the quantification of vegetation disturbance in Iris...Leaf Area Index (LAI) in the quantification of vegetation disturbance in Iris...
Leaf Area Index (LAI) in the quantification of vegetation disturbance in Iris...
 
Improving scientific graphics of climate (change) data
Improving scientific graphics of climate (change) dataImproving scientific graphics of climate (change) data
Improving scientific graphics of climate (change) data
 
Climate Summit for the ABC Network
Climate Summit for the ABC NetworkClimate Summit for the ABC Network
Climate Summit for the ABC Network
 
Öncel Akademi: İstatistiksel Sismoloji
Öncel Akademi: İstatistiksel SismolojiÖncel Akademi: İstatistiksel Sismoloji
Öncel Akademi: İstatistiksel Sismoloji
 
Project 1
Project 1Project 1
Project 1
 
Climate Signals in CESM1 Single-Forcing Large Ensembles Revealed by Explainab...
Climate Signals in CESM1 Single-Forcing Large Ensembles Revealed by Explainab...Climate Signals in CESM1 Single-Forcing Large Ensembles Revealed by Explainab...
Climate Signals in CESM1 Single-Forcing Large Ensembles Revealed by Explainab...
 
EcoTas13 BradEvans e-MAST
EcoTas13 BradEvans e-MASTEcoTas13 BradEvans e-MAST
EcoTas13 BradEvans e-MAST
 

Destacado

Destacado (7)

Patient distribution Maps
Patient distribution MapsPatient distribution Maps
Patient distribution Maps
 
Mapping lawns in MA
Mapping lawns in MAMapping lawns in MA
Mapping lawns in MA
 
Health Maps
Health MapsHealth Maps
Health Maps
 
Virtual Fieldwork
Virtual FieldworkVirtual Fieldwork
Virtual Fieldwork
 
Mapping Lawns
Mapping LawnsMapping Lawns
Mapping Lawns
 
The world of virtual globes
The world of virtual globesThe world of virtual globes
The world of virtual globes
 
Comparing directions
Comparing directionsComparing directions
Comparing directions
 

Similar a Effects of Deforestation

3178_IGARSS11.ppt
3178_IGARSS11.ppt3178_IGARSS11.ppt
3178_IGARSS11.ppt
grssieee
 
WE1.L09 - AN OVERVIEW OF THE DESDYNI MISSION
WE1.L09 - AN OVERVIEW OF THE DESDYNI MISSIONWE1.L09 - AN OVERVIEW OF THE DESDYNI MISSION
WE1.L09 - AN OVERVIEW OF THE DESDYNI MISSION
grssieee
 
FR3.TO5.3.ppt
FR3.TO5.3.pptFR3.TO5.3.ppt
FR3.TO5.3.ppt
grssieee
 
IGARSS11_HongboSu_ver3.ppt
IGARSS11_HongboSu_ver3.pptIGARSS11_HongboSu_ver3.ppt
IGARSS11_HongboSu_ver3.ppt
grssieee
 
IGARSS11_DESDynI_V2.pptx
IGARSS11_DESDynI_V2.pptxIGARSS11_DESDynI_V2.pptx
IGARSS11_DESDynI_V2.pptx
grssieee
 
Changes in the atmosphere
Changes in the atmosphereChanges in the atmosphere
Changes in the atmosphere
cdenef
 
Llano_del_cedro_main01
Llano_del_cedro_main01Llano_del_cedro_main01
Llano_del_cedro_main01
Greg Burton
 
MONITORING FOREST MANAGEMENT ACTIVTIES USING AIRBORNE LIDAR AND ALOS PALSAR.pptx
MONITORING FOREST MANAGEMENT ACTIVTIES USING AIRBORNE LIDAR AND ALOS PALSAR.pptxMONITORING FOREST MANAGEMENT ACTIVTIES USING AIRBORNE LIDAR AND ALOS PALSAR.pptx
MONITORING FOREST MANAGEMENT ACTIVTIES USING AIRBORNE LIDAR AND ALOS PALSAR.pptx
grssieee
 
Climate change: Changes in the atmosphere
Climate change: Changes in the atmosphereClimate change: Changes in the atmosphere
Climate change: Changes in the atmosphere
cdenef
 
Human and natural_influences_on_the_changing_thermal_structure_of_the_atmosphere
Human and natural_influences_on_the_changing_thermal_structure_of_the_atmosphereHuman and natural_influences_on_the_changing_thermal_structure_of_the_atmosphere
Human and natural_influences_on_the_changing_thermal_structure_of_the_atmosphere
Sérgio Sacani
 
LHill_Geog592_ClassProjectFinalPaperDS_Final
LHill_Geog592_ClassProjectFinalPaperDS_FinalLHill_Geog592_ClassProjectFinalPaperDS_Final
LHill_Geog592_ClassProjectFinalPaperDS_Final
Lisa Hill
 

Similar a Effects of Deforestation (20)

3178_IGARSS11.ppt
3178_IGARSS11.ppt3178_IGARSS11.ppt
3178_IGARSS11.ppt
 
Making effective and accessible figures
Making effective and accessible figuresMaking effective and accessible figures
Making effective and accessible figures
 
WE1.L09 - AN OVERVIEW OF THE DESDYNI MISSION
WE1.L09 - AN OVERVIEW OF THE DESDYNI MISSIONWE1.L09 - AN OVERVIEW OF THE DESDYNI MISSION
WE1.L09 - AN OVERVIEW OF THE DESDYNI MISSION
 
PhD Qualifying
PhD QualifyingPhD Qualifying
PhD Qualifying
 
Remote Sensing the Urban Heat Island Effect
Remote Sensing the Urban Heat Island EffectRemote Sensing the Urban Heat Island Effect
Remote Sensing the Urban Heat Island Effect
 
FR3.TO5.3.ppt
FR3.TO5.3.pptFR3.TO5.3.ppt
FR3.TO5.3.ppt
 
IGARSS11_HongboSu_ver3.ppt
IGARSS11_HongboSu_ver3.pptIGARSS11_HongboSu_ver3.ppt
IGARSS11_HongboSu_ver3.ppt
 
IGARSS11_DESDynI_V2.pptx
IGARSS11_DESDynI_V2.pptxIGARSS11_DESDynI_V2.pptx
IGARSS11_DESDynI_V2.pptx
 
Changes in the atmosphere
Changes in the atmosphereChanges in the atmosphere
Changes in the atmosphere
 
Surface and soil moisture monitoring, estimations, variations, and retrievals
Surface and soil moisture monitoring, estimations, variations, and retrievalsSurface and soil moisture monitoring, estimations, variations, and retrievals
Surface and soil moisture monitoring, estimations, variations, and retrievals
 
Llano_del_cedro_main01
Llano_del_cedro_main01Llano_del_cedro_main01
Llano_del_cedro_main01
 
MONITORING FOREST MANAGEMENT ACTIVTIES USING AIRBORNE LIDAR AND ALOS PALSAR.pptx
MONITORING FOREST MANAGEMENT ACTIVTIES USING AIRBORNE LIDAR AND ALOS PALSAR.pptxMONITORING FOREST MANAGEMENT ACTIVTIES USING AIRBORNE LIDAR AND ALOS PALSAR.pptx
MONITORING FOREST MANAGEMENT ACTIVTIES USING AIRBORNE LIDAR AND ALOS PALSAR.pptx
 
Scheel et al_2011_trmm_andes
Scheel et al_2011_trmm_andesScheel et al_2011_trmm_andes
Scheel et al_2011_trmm_andes
 
Making effective science figures
Making effective science figuresMaking effective science figures
Making effective science figures
 
Drought Assessment + Impacts: Discussion Facilitation Questions
Drought Assessment + Impacts: Discussion Facilitation QuestionsDrought Assessment + Impacts: Discussion Facilitation Questions
Drought Assessment + Impacts: Discussion Facilitation Questions
 
Wireless sensor network research and application
Wireless sensor network research and application Wireless sensor network research and application
Wireless sensor network research and application
 
Climate change: Changes in the atmosphere
Climate change: Changes in the atmosphereClimate change: Changes in the atmosphere
Climate change: Changes in the atmosphere
 
Human and natural_influences_on_the_changing_thermal_structure_of_the_atmosphere
Human and natural_influences_on_the_changing_thermal_structure_of_the_atmosphereHuman and natural_influences_on_the_changing_thermal_structure_of_the_atmosphere
Human and natural_influences_on_the_changing_thermal_structure_of_the_atmosphere
 
Using explainable machine learning to evaluate climate change projections
Using explainable machine learning to evaluate climate change projectionsUsing explainable machine learning to evaluate climate change projections
Using explainable machine learning to evaluate climate change projections
 
LHill_Geog592_ClassProjectFinalPaperDS_Final
LHill_Geog592_ClassProjectFinalPaperDS_FinalLHill_Geog592_ClassProjectFinalPaperDS_Final
LHill_Geog592_ClassProjectFinalPaperDS_Final
 

Más de Rahul Rakshit (6)

holmes
holmesholmes
holmes
 
Site Suitability Analysis
Site Suitability AnalysisSite Suitability Analysis
Site Suitability Analysis
 
Comparing directional maps
Comparing directional mapsComparing directional maps
Comparing directional maps
 
Post Accuracy Assessment Classification
Post Accuracy Assessment ClassificationPost Accuracy Assessment Classification
Post Accuracy Assessment Classification
 
Segmentation scale selection
Segmentation scale selectionSegmentation scale selection
Segmentation scale selection
 
OBIA accuracy survey
OBIA accuracy surveyOBIA accuracy survey
OBIA accuracy survey
 

Último

Cloud Frontiers: A Deep Dive into Serverless Spatial Data and FME
Cloud Frontiers:  A Deep Dive into Serverless Spatial Data and FMECloud Frontiers:  A Deep Dive into Serverless Spatial Data and FME
Cloud Frontiers: A Deep Dive into Serverless Spatial Data and FME
Safe Software
 

Último (20)

"I see eyes in my soup": How Delivery Hero implemented the safety system for ...
"I see eyes in my soup": How Delivery Hero implemented the safety system for ..."I see eyes in my soup": How Delivery Hero implemented the safety system for ...
"I see eyes in my soup": How Delivery Hero implemented the safety system for ...
 
Emergent Methods: Multi-lingual narrative tracking in the news - real-time ex...
Emergent Methods: Multi-lingual narrative tracking in the news - real-time ex...Emergent Methods: Multi-lingual narrative tracking in the news - real-time ex...
Emergent Methods: Multi-lingual narrative tracking in the news - real-time ex...
 
Automating Google Workspace (GWS) & more with Apps Script
Automating Google Workspace (GWS) & more with Apps ScriptAutomating Google Workspace (GWS) & more with Apps Script
Automating Google Workspace (GWS) & more with Apps Script
 
Cloud Frontiers: A Deep Dive into Serverless Spatial Data and FME
Cloud Frontiers:  A Deep Dive into Serverless Spatial Data and FMECloud Frontiers:  A Deep Dive into Serverless Spatial Data and FME
Cloud Frontiers: A Deep Dive into Serverless Spatial Data and FME
 
Web Form Automation for Bonterra Impact Management (fka Social Solutions Apri...
Web Form Automation for Bonterra Impact Management (fka Social Solutions Apri...Web Form Automation for Bonterra Impact Management (fka Social Solutions Apri...
Web Form Automation for Bonterra Impact Management (fka Social Solutions Apri...
 
TrustArc Webinar - Stay Ahead of US State Data Privacy Law Developments
TrustArc Webinar - Stay Ahead of US State Data Privacy Law DevelopmentsTrustArc Webinar - Stay Ahead of US State Data Privacy Law Developments
TrustArc Webinar - Stay Ahead of US State Data Privacy Law Developments
 
Strategies for Landing an Oracle DBA Job as a Fresher
Strategies for Landing an Oracle DBA Job as a FresherStrategies for Landing an Oracle DBA Job as a Fresher
Strategies for Landing an Oracle DBA Job as a Fresher
 
Corporate and higher education May webinar.pptx
Corporate and higher education May webinar.pptxCorporate and higher education May webinar.pptx
Corporate and higher education May webinar.pptx
 
Apidays New York 2024 - Scaling API-first by Ian Reasor and Radu Cotescu, Adobe
Apidays New York 2024 - Scaling API-first by Ian Reasor and Radu Cotescu, AdobeApidays New York 2024 - Scaling API-first by Ian Reasor and Radu Cotescu, Adobe
Apidays New York 2024 - Scaling API-first by Ian Reasor and Radu Cotescu, Adobe
 
ProductAnonymous-April2024-WinProductDiscovery-MelissaKlemke
ProductAnonymous-April2024-WinProductDiscovery-MelissaKlemkeProductAnonymous-April2024-WinProductDiscovery-MelissaKlemke
ProductAnonymous-April2024-WinProductDiscovery-MelissaKlemke
 
Manulife - Insurer Transformation Award 2024
Manulife - Insurer Transformation Award 2024Manulife - Insurer Transformation Award 2024
Manulife - Insurer Transformation Award 2024
 
Powerful Google developer tools for immediate impact! (2023-24 C)
Powerful Google developer tools for immediate impact! (2023-24 C)Powerful Google developer tools for immediate impact! (2023-24 C)
Powerful Google developer tools for immediate impact! (2023-24 C)
 
Apidays New York 2024 - Accelerating FinTech Innovation by Vasa Krishnan, Fin...
Apidays New York 2024 - Accelerating FinTech Innovation by Vasa Krishnan, Fin...Apidays New York 2024 - Accelerating FinTech Innovation by Vasa Krishnan, Fin...
Apidays New York 2024 - Accelerating FinTech Innovation by Vasa Krishnan, Fin...
 
Apidays New York 2024 - The value of a flexible API Management solution for O...
Apidays New York 2024 - The value of a flexible API Management solution for O...Apidays New York 2024 - The value of a flexible API Management solution for O...
Apidays New York 2024 - The value of a flexible API Management solution for O...
 
Polkadot JAM Slides - Token2049 - By Dr. Gavin Wood
Polkadot JAM Slides - Token2049 - By Dr. Gavin WoodPolkadot JAM Slides - Token2049 - By Dr. Gavin Wood
Polkadot JAM Slides - Token2049 - By Dr. Gavin Wood
 
AWS Community Day CPH - Three problems of Terraform
AWS Community Day CPH - Three problems of TerraformAWS Community Day CPH - Three problems of Terraform
AWS Community Day CPH - Three problems of Terraform
 
Ransomware_Q4_2023. The report. [EN].pdf
Ransomware_Q4_2023. The report. [EN].pdfRansomware_Q4_2023. The report. [EN].pdf
Ransomware_Q4_2023. The report. [EN].pdf
 
Repurposing LNG terminals for Hydrogen Ammonia: Feasibility and Cost Saving
Repurposing LNG terminals for Hydrogen Ammonia: Feasibility and Cost SavingRepurposing LNG terminals for Hydrogen Ammonia: Feasibility and Cost Saving
Repurposing LNG terminals for Hydrogen Ammonia: Feasibility and Cost Saving
 
2024: Domino Containers - The Next Step. News from the Domino Container commu...
2024: Domino Containers - The Next Step. News from the Domino Container commu...2024: Domino Containers - The Next Step. News from the Domino Container commu...
2024: Domino Containers - The Next Step. News from the Domino Container commu...
 
Data Cloud, More than a CDP by Matt Robison
Data Cloud, More than a CDP by Matt RobisonData Cloud, More than a CDP by Matt Robison
Data Cloud, More than a CDP by Matt Robison
 

Effects of Deforestation

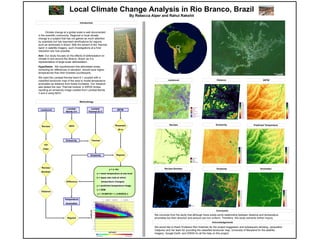
  • 1. y = a +bx a = mean temperature at sea level b = lapse rate (rate at which temperature changes) y = predicted temperature image x = DEM y = 19.069720 + (- 0.004833) x Local Climate Change Analysis in Rio Branco, Brazil By Rebecca Alper and Rahul Rakshit Reclass Boolean Anomalies Greybody Reclass Predicted Temperature SRTM Distance Landcover Emissivity Introduction Conclusion Methodology Acknowledgements Climate change at a global scale is well documented in the scientific community. Regional or local climate change is a subject that has not gained as much attention by scientists but has important ramifications for regions such as rainforests in Brazil. With the advent of the ‘thermal band’ in satellite imagery, such investigations at a finer resolution are now possible. Aim: Our study focuses on the effects of deforestation on climate in and around Rio Branco, Brazil, as it is representative of large-scale deforestation. Hypothesis: We hypothesized that deforested areas, correcting for differences in elevation, should have higher temperatures than their forested counterparts. We used the Landsat thermal band 6.1 coupled with a classified landcover map of the area to model temperature anomalies as distance from forest increases. Our research also tested the new ‘Thermal module’ in IDRISI Andes, inputting an emissivity image created from Landsat Bands 3 and 4 using NDVI. We conclude from the study that although there exists some relationship between distance and temperature anomalies but their direction and amount are non uniform. Therefore, this study warrants further inquiry. We would like to thank Professor Ron Eastman for the project suggestion and subsequent advising, Jacqueline Vadjunec and her team for providing the classified landcover map, University of Maryland for the satellite imagery, Google Earth, and IDRISI for all the help on this project. Landcover Landsat Thermal (6.1) SRTM Difference 7X7 Filter Reclass Boolean Landsat Bands 3:4 NDVI Emissivity Thermal Greybody Resample 30 m Regress Distance Reclass Temperature Anomalies Regress ANOMALIES DISTANCE