SlideShare una empresa de Scribd logo
1 de 2
Prueba única periodo          2
Mitchell Mejía Buitrago.

NOMBRE DEL ESTUDIANTE:_______________________ GRUPO__________

    1. Abrir un documento en Word y escriba el siguiente texo: (configurar pagina asi:
       orientación: horizontal. Márgenes: estrecho. Columnas: 2. Coloque su primer nombre
       como marca de agua). Utilizar fuente arial black, tamaño fuente 15, color azul e
       interlineado: 1


        ANALISIS DE UN CASO

        SE APLICARON 52 ENCUESTAS A VARIOS JOVENES DE LA
        INSTITUCION CON EL FIN DE INDAGAR SOBRE EL USO QUE
        HACEN DE LAS CANECAS DESTINADAS PARA DEPOSITAR
        LAS BASURAS CONTRIBUYENDO ASI A LA BUENA O MALA
        PRESENTACION DE SU COLEGIO


    2. Construir una pregunta de investigación con base en el análisis hecho por un estudiante.
    3. Abrir un libro de Excel, construir la tabla y completar los datos que hacen falta. Inserte un
       grafico circular en 3D y visibilice los porcentajes. Copie la tabla y el grafico los pega en el
       documento de Word. (No olviden que se toma la columna del porcentaje para graficarlos).

         Respuesta     Frecuancia       Frecuencia      Frecuancia relativa
                       absoluta         absoluta
        KKK
                                        acumulada
                                                        Fraccionario     Decimal         Porcentaje % Acumulado

         Si            19               19              19/52            0,3653          36,53           36,53

         No            30               49              27/49            0,5769          57,69           57,69

         Le da pena    3                52              19/52            5,7692          76,92           51,92
         responder

         Total         52               120                                                              100
1
                                                                  2

                                                                  3


4. Guardar como evaluación worexcel__________________________________ y enviar
   como archivo adjunto a albaigiraldo@hotmail.com

Más contenido relacionado

Destacado

La crisis en méxico
La crisis en méxicoLa crisis en méxico
La crisis en méxicoEze Kata
 
การเคลื่อนย้ายรูปภาพ
การเคลื่อนย้ายรูปภาพการเคลื่อนย้ายรูปภาพ
การเคลื่อนย้ายรูปภาพJeedZii Saren
 
South Africa Demography Thru Infographics
South Africa Demography Thru InfographicsSouth Africa Demography Thru Infographics
South Africa Demography Thru Infographicslifeofgraphic
 

Destacado (9)

La crisis en méxico
La crisis en méxicoLa crisis en méxico
La crisis en méxico
 
Yahoo
YahooYahoo
Yahoo
 
Cartells
CartellsCartells
Cartells
 
Session 3.6 introduction to the session
Session 3.6 introduction to the sessionSession 3.6 introduction to the session
Session 3.6 introduction to the session
 
Coba presentasi
Coba presentasiCoba presentasi
Coba presentasi
 
การเคลื่อนย้ายรูปภาพ
การเคลื่อนย้ายรูปภาพการเคลื่อนย้ายรูปภาพ
การเคลื่อนย้ายรูปภาพ
 
gift aid_irfan
gift aid_irfangift aid_irfan
gift aid_irfan
 
FiscalEducationNetwork_Greeley_Flyer
FiscalEducationNetwork_Greeley_FlyerFiscalEducationNetwork_Greeley_Flyer
FiscalEducationNetwork_Greeley_Flyer
 
South Africa Demography Thru Infographics
South Africa Demography Thru InfographicsSouth Africa Demography Thru Infographics
South Africa Demography Thru Infographics
 

Prueba unica wordexcel mitchell mejia

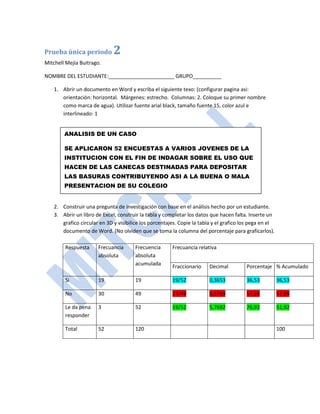
  • 1. Prueba única periodo 2 Mitchell Mejía Buitrago. NOMBRE DEL ESTUDIANTE:_______________________ GRUPO__________ 1. Abrir un documento en Word y escriba el siguiente texo: (configurar pagina asi: orientación: horizontal. Márgenes: estrecho. Columnas: 2. Coloque su primer nombre como marca de agua). Utilizar fuente arial black, tamaño fuente 15, color azul e interlineado: 1 ANALISIS DE UN CASO SE APLICARON 52 ENCUESTAS A VARIOS JOVENES DE LA INSTITUCION CON EL FIN DE INDAGAR SOBRE EL USO QUE HACEN DE LAS CANECAS DESTINADAS PARA DEPOSITAR LAS BASURAS CONTRIBUYENDO ASI A LA BUENA O MALA PRESENTACION DE SU COLEGIO 2. Construir una pregunta de investigación con base en el análisis hecho por un estudiante. 3. Abrir un libro de Excel, construir la tabla y completar los datos que hacen falta. Inserte un grafico circular en 3D y visibilice los porcentajes. Copie la tabla y el grafico los pega en el documento de Word. (No olviden que se toma la columna del porcentaje para graficarlos). Respuesta Frecuancia Frecuencia Frecuancia relativa absoluta absoluta KKK acumulada Fraccionario Decimal Porcentaje % Acumulado Si 19 19 19/52 0,3653 36,53 36,53 No 30 49 27/49 0,5769 57,69 57,69 Le da pena 3 52 19/52 5,7692 76,92 51,92 responder Total 52 120 100
  • 2. 1 2 3 4. Guardar como evaluación worexcel__________________________________ y enviar como archivo adjunto a albaigiraldo@hotmail.com