SlideShare una empresa de Scribd logo
1 de 19
Apple 2015 Financial Analysis
Full year results released in October 2015 (all numbers in $US)
Oct
2014
Nov
2014
Dec
2014
Jan
2015
Feb
2015
Mar
2015
Apr
2015
May
2015
Jun
2015
Jul
2015
Aug
2015
Sep
2015
Reporting Period
Oct
2014
Nov
2014
Dec
2014
Jan
2015
Feb
2015
Mar
2015
Apr
2015
May
2015
Jun
2015
Jul
2015
Aug
2015
Sep
2015
The Key Numbers
The Key Numbers
In $millions This Period Last Period Variance
Sales 233715 182795 +28%
Cost of Goods Sold 140089 112258 +25%
Gross Profit 93626 70537 +33%
Net Profit 53394 39510 +35%
Current Assets 89378 68531 +30%
Non-Current Assets 201101 163308 +23%
Current Liabilities 80610 63448 +27%
Non-Current Liabilities 90514 56844 +59%
Owner's Equity 119355 111547 +7%
The Key Numbers
Operating
Investing
Financing
Operating
Investing
Financing
+81266 m
─56274 m
─17716 m
Cash Balance
This Period
Operating
Investing
Financing
Operating
Investing
Financing
+59713 m
─22579 m
Cash Balance
Last Period
─37549 m
+7276m
Change in
Cash Balance
─415m
Change in
Cash Balance
Analysis of the Financial Reports
Profitability
Gross Profit Margin
This Period Last Period Comparison
40.1% 38.6% Better
Sales
$1.00
Gross Profit
40.1c
COGS
59.9c
Income Statement
What does this mean?
For every $1 the firm generates in
sales:
• A Gross Profit of 40.1 cents is
earned
• Once the Cost of Goods Sold is
deducted.
Analysis of the Financial Reports
Profitability
Net Profit Margin
This Period Last Period Comparison
22.8% 21.6% Better
Income Statement
$1.00 of
Sales
Gross Profit
40.1c
COGS
59.9c
Net Profit
22.8c
Other
Expenses
17.3c
What does this mean?
For every $1 the firm
generates in sales an
overall Net Profit of
22.8 cents is earned.
Analysis of the Financial Reports
This Period
Sales
$1.00
Gross Profit
40.1c
COGS
59.9c
Net Profit
22.8c
Other Exp
17.3c
─
=
─
=
Last Period
Sales
$1.00
Gross Profit
38.6c
COGS
61.4c
Net Profit
21.6c
Other Exp
17.0c
─
=
─
=
Lower COGS… possible
causes?
• Suppliers ↓ prices
• Mark-ups ↑
And a better Net Profit
Margin… possible causes?
• But ↑ in Oth. Exp.???
• ↑ GP > ↑ in Oth. Exp .
Analysis of the Financial Reports
Profitability
Return on Assets
This Period Last Period Comparison
18.4% 13.6% Better
What does this mean?
For every $1 of Assets the firm
has, the business is earning a
Net Profit of 18.4 cents.
Business
Net Profit
18.4c
Balance Sheet
Assets Liabilities
Owner’s
Equity
Balance Sheet
Assets Liabilities
$1 Owner’s
Equity
Analysis of the Financial Reports
Return on Investment
This Period Last Period Comparison
46.2% 35.4% Better
What does this mean?
For every $1 of Capital invested in
the firm, the business is earning a
Net Profit of 46.2 cents.
Net Profit
46.2c
Balance Sheet
Assets Liabilities
Owner’s Eq.
$1
Business
Balance Sheet
Assets Liabilities
Owner’s Eq.
$1
Profitability
Analysis of the Financial Reports
Efficiency
Asset Turnover Ratio
This Period Last Period Comparison
0.80
times
0.63
times
Better
Business
$0.80 of
Sales
Balance Sheet
Assets Liabilities
Owner’s
Equity
Balance Sheet
Assets Liabilities
$1 Owner’s
Equity
What does this mean?
For every $1 of Assets the firm
has, the business generates
$0.80 of sales
Analysis of the Financial Reports
Efficiency
This Period
Last Period
Profitability and
DuPont Formula
0.80 times
0.63 times
22.8%
21.6%
18.4%
13.6%
= X
= X
Asset
Turnover
Net Profit
Margin
Return on
Assets
= X
Better
ROA
More
efficient at
making sales
And each sale
made at a
higher Net
Profit
Analysis of the Financial Reports
Efficiency
Stock Turnover Ratio
This Period Last Period Comparison
6 days 7 days Better
What does this mean?
The firm takes, on average, 6 days to
sell all of its inventory
0 6 days
Stock
bought
Stock
sold
Analysis of the Financial Reports
Liquidity
Working Capital Ratio
This Period Last Period Comparison
1.11 1.08 Better
What does this mean?
For every $1 of Current
Liabilities the firm has, there
are $1.11 in Current Assets to
pay them
Balance Sheet
Current Assets Current Liabilities
$1.53 $1.00
Balance Sheet
Current Assets Current Liabilities
$1.53 $1.00
Balance Sheet
Current Assets Current Liabilities
$1.11 $1.00
Analysis of the Financial Reports
Liquidity
Quick Asset Ratio
This Period Last Period Comparison
1.08 1.05 Better
What does this mean?
For every $1 of Urgent
Liabilities the firm has, there
are $1.08 in Quick Assets to
pay them
$1.08
Quick
Assets
$1.00
Urgent
Liabilities
Analysis of the Financial Reports
Liquidity
Cash Flow Ratio
This Period Last Period Comparison
1.13 0.94 Better
What does this mean?
For every $1 of Current
Liabilities the firm has, the
firm’s Operating Activities are
generating $1.13 to pay them
Operating
Investing
Financing
$1.13
Cash Balance
$1.00
Current
Liabilities
Nothing
needed
from
here
Analysis of the Financial Reports
Stability
Debt Ratio (Gearing)
This Period Last Period Comparison
59% 52% Worse
What does this mean?
59% of the firm’s Total Assets
have been financed with debt
(Liabilities)
Balance Sheet
Assets Liabilities
$1.00 $0.60
Owner’s Equity
$0.40
Balance Sheet
Assets Liabilities
$1.00 $0.60
Owner’s Equity
$0.40
Balance Sheet
Assets Liabilities
$1.00 $0.59
Owner’s Equity
$0.40
Balance Sheet
Assets Liabilities
$1.00 $0.59
Owner’s Equity
$0.41
Summary of Results
Summary of Results
This Period Last PeriodProfitability
Gross Profit Margin 40.1% 38.6%
Net Profit Margin 22.8% 21.6%
Return on Assets 18.4% 13.6%
Return on Investment 46.2% 35.4%
Efficiency
Asset Turnover Ratio
0.80
times
0.63
times
Stock Turnover Ratio
6
days
7
days
This Period Last PeriodLiquidity
Working Capital Ratio 1.11 1.08
Quick Asset Ratio 1.08 1.05
Cash Flow Ratio 1.13 0.94
Debt Ratio (Gearing) 59% 52%
Stability

Más contenido relacionado

La actualidad más candente

Keeping PACE With Energy Efficiency in North America
Keeping PACE With Energy Efficiency in North AmericaKeeping PACE With Energy Efficiency in North America
Keeping PACE With Energy Efficiency in North AmericaKerry Kilpatrick
 
Acxiom FY17 Third Quarter Earnings Call
Acxiom FY17 Third Quarter Earnings CallAcxiom FY17 Third Quarter Earnings Call
Acxiom FY17 Third Quarter Earnings Callacxiom2016ir
 
| Financial Statement Analysis | Limitations of Financial Statement Analysis ...
| Financial Statement Analysis | Limitations of Financial Statement Analysis ...| Financial Statement Analysis | Limitations of Financial Statement Analysis ...
| Financial Statement Analysis | Limitations of Financial Statement Analysis ...Ahmad Hassan
 
Q1 Earnings Call Slide Deck_FINAL
Q1 Earnings Call Slide Deck_FINALQ1 Earnings Call Slide Deck_FINAL
Q1 Earnings Call Slide Deck_FINALacxiom2016ir
 
Amazon Fresh - Mock Financials
Amazon Fresh - Mock FinancialsAmazon Fresh - Mock Financials
Amazon Fresh - Mock FinancialsHelena Lavieri
 
Analysis of S&P500 financial sector
Analysis of S&P500 financial sectorAnalysis of S&P500 financial sector
Analysis of S&P500 financial sectorJean. G. Ndoutoum
 
Q2 earnings call slide deck 20171101 10am
Q2 earnings call slide deck 20171101 10amQ2 earnings call slide deck 20171101 10am
Q2 earnings call slide deck 20171101 10amacxiom2016ir
 
Electrionc arts
Electrionc artsElectrionc arts
Electrionc artsasablsdf
 
Creating Value With Metrics Pt.1
Creating Value With Metrics Pt.1Creating Value With Metrics Pt.1
Creating Value With Metrics Pt.1Vivastream
 
Acc 291 new Extraordinary Success/newtonhelp.com
Acc 291 new Extraordinary Success/newtonhelp.comAcc 291 new Extraordinary Success/newtonhelp.com
Acc 291 new Extraordinary Success/newtonhelp.comamaranthbeg101
 
Acc 291 new Perfect Education/newtonhelp.com
Acc 291 new Perfect Education/newtonhelp.comAcc 291 new Perfect Education/newtonhelp.com
Acc 291 new Perfect Education/newtonhelp.comamaranthbeg121
 
Regional Operating Income Bridge 2002
Regional Operating Income Bridge 2002Regional Operating Income Bridge 2002
Regional Operating Income Bridge 2002finance7
 

La actualidad más candente (13)

Keeping PACE With Energy Efficiency in North America
Keeping PACE With Energy Efficiency in North AmericaKeeping PACE With Energy Efficiency in North America
Keeping PACE With Energy Efficiency in North America
 
Acxiom FY17 Third Quarter Earnings Call
Acxiom FY17 Third Quarter Earnings CallAcxiom FY17 Third Quarter Earnings Call
Acxiom FY17 Third Quarter Earnings Call
 
| Financial Statement Analysis | Limitations of Financial Statement Analysis ...
| Financial Statement Analysis | Limitations of Financial Statement Analysis ...| Financial Statement Analysis | Limitations of Financial Statement Analysis ...
| Financial Statement Analysis | Limitations of Financial Statement Analysis ...
 
Q1 Earnings Call Slide Deck_FINAL
Q1 Earnings Call Slide Deck_FINALQ1 Earnings Call Slide Deck_FINAL
Q1 Earnings Call Slide Deck_FINAL
 
Attock cement company
Attock cement companyAttock cement company
Attock cement company
 
Amazon Fresh - Mock Financials
Amazon Fresh - Mock FinancialsAmazon Fresh - Mock Financials
Amazon Fresh - Mock Financials
 
Analysis of S&P500 financial sector
Analysis of S&P500 financial sectorAnalysis of S&P500 financial sector
Analysis of S&P500 financial sector
 
Q2 earnings call slide deck 20171101 10am
Q2 earnings call slide deck 20171101 10amQ2 earnings call slide deck 20171101 10am
Q2 earnings call slide deck 20171101 10am
 
Electrionc arts
Electrionc artsElectrionc arts
Electrionc arts
 
Creating Value With Metrics Pt.1
Creating Value With Metrics Pt.1Creating Value With Metrics Pt.1
Creating Value With Metrics Pt.1
 
Acc 291 new Extraordinary Success/newtonhelp.com
Acc 291 new Extraordinary Success/newtonhelp.comAcc 291 new Extraordinary Success/newtonhelp.com
Acc 291 new Extraordinary Success/newtonhelp.com
 
Acc 291 new Perfect Education/newtonhelp.com
Acc 291 new Perfect Education/newtonhelp.comAcc 291 new Perfect Education/newtonhelp.com
Acc 291 new Perfect Education/newtonhelp.com
 
Regional Operating Income Bridge 2002
Regional Operating Income Bridge 2002Regional Operating Income Bridge 2002
Regional Operating Income Bridge 2002
 

Destacado

How to Start your Business
How to Start your BusinessHow to Start your Business
How to Start your BusinessAbdalla Ibrahim
 

Destacado (19)

1.14 Assets
1.14 Assets1.14 Assets
1.14 Assets
 
19.4 - The liability approach to prepaid revenue
19.4 - The liability approach to prepaid revenue19.4 - The liability approach to prepaid revenue
19.4 - The liability approach to prepaid revenue
 
How to Start your Business
How to Start your BusinessHow to Start your Business
How to Start your Business
 
Answering Elements Questions
Answering Elements QuestionsAnswering Elements Questions
Answering Elements Questions
 
Task 2C - GST Basics
Task 2C - GST Basics Task 2C - GST Basics
Task 2C - GST Basics
 
Answering Theory Questions
Answering Theory QuestionsAnswering Theory Questions
Answering Theory Questions
 
21.11 Budget Variance Report
21.11 Budget Variance Report21.11 Budget Variance Report
21.11 Budget Variance Report
 
20.9 Creditors and the Cash Cycle
20.9  Creditors and the Cash Cycle20.9  Creditors and the Cash Cycle
20.9 Creditors and the Cash Cycle
 
1.19 Summary of Revenues and Expenses
1.19 Summary of Revenues and Expenses1.19 Summary of Revenues and Expenses
1.19 Summary of Revenues and Expenses
 
1.2 Relevance
1.2 Relevance1.2 Relevance
1.2 Relevance
 
2.1 Format of the Balance Sheet
2.1 Format of the Balance Sheet2.1 Format of the Balance Sheet
2.1 Format of the Balance Sheet
 
1.3 Reliability
1.3 Reliability1.3 Reliability
1.3 Reliability
 
11.2A Mark-ups, Cost of Sales and Selling Price
11.2A Mark-ups, Cost of Sales and Selling Price11.2A Mark-ups, Cost of Sales and Selling Price
11.2A Mark-ups, Cost of Sales and Selling Price
 
Task 2C - GST Basics Solutions
Task 2C - GST Basics SolutionsTask 2C - GST Basics Solutions
Task 2C - GST Basics Solutions
 
Task 2A - Balance Sheets (Basic) Solutions
Task 2A - Balance Sheets (Basic) SolutionsTask 2A - Balance Sheets (Basic) Solutions
Task 2A - Balance Sheets (Basic) Solutions
 
13.4A Why is depreciation an Expense?
13.4A Why is depreciation an Expense?13.4A Why is depreciation an Expense?
13.4A Why is depreciation an Expense?
 
1.20 Assets v Expenses
1.20 Assets v Expenses1.20 Assets v Expenses
1.20 Assets v Expenses
 
19.5 - Recording prepaid revenue
19.5 - Recording prepaid revenue19.5 - Recording prepaid revenue
19.5 - Recording prepaid revenue
 
1.1 What is Accounting?
1.1 What is Accounting?1.1 What is Accounting?
1.1 What is Accounting?
 

Similar a Apple 2015 Financial Analysis Reveals Higher Profits and Efficiency

Coca-Cola 2016 Financial Analysis (Half year ended 30 June)
Coca-Cola 2016 Financial Analysis (Half year ended 30 June)Coca-Cola 2016 Financial Analysis (Half year ended 30 June)
Coca-Cola 2016 Financial Analysis (Half year ended 30 June)VCE Accounting - Michael Allison
 
FinancialStmtAnalysis-Garrison11ePPT (1).ppt
FinancialStmtAnalysis-Garrison11ePPT (1).pptFinancialStmtAnalysis-Garrison11ePPT (1).ppt
FinancialStmtAnalysis-Garrison11ePPT (1).pptSaurabhSharma262273
 
Acc mgt noreen14 how well am i doing financial statement analysis
Acc mgt noreen14 how well am i doing financial statement analysisAcc mgt noreen14 how well am i doing financial statement analysis
Acc mgt noreen14 how well am i doing financial statement analysisJudianto Nugroho
 
2019 sold biz study color
2019 sold biz study color2019 sold biz study color
2019 sold biz study colorMichael Shea PA
 
Financial statement analysis
Financial statement analysisFinancial statement analysis
Financial statement analysisTara Kissel, M.Ed
 
Take Assessment Exam 3Top of FormNameExam 3 Ins.docx
Take Assessment Exam 3Top of FormNameExam 3 Ins.docxTake Assessment Exam 3Top of FormNameExam 3 Ins.docx
Take Assessment Exam 3Top of FormNameExam 3 Ins.docxmattinsonjanel
 
STATEMENT OF CASH FLOWS.ppt
STATEMENT OF CASH FLOWS.pptSTATEMENT OF CASH FLOWS.ppt
STATEMENT OF CASH FLOWS.pptLayTekchhay2
 
LVC 04-SRM- Master of Business Adminsitration
LVC 04-SRM- Master of Business AdminsitrationLVC 04-SRM- Master of Business Adminsitration
LVC 04-SRM- Master of Business Adminsitrationnewalliancecommerce
 
Financial Boot Camp for Entrepreneurs - 2016
Financial Boot Camp for Entrepreneurs - 2016Financial Boot Camp for Entrepreneurs - 2016
Financial Boot Camp for Entrepreneurs - 2016David Chase
 
2-Accounting Presentation 2012
2-Accounting Presentation 20122-Accounting Presentation 2012
2-Accounting Presentation 2012Lakisha Edens
 
chapter 1.ppt
chapter 1.pptchapter 1.ppt
chapter 1.pptEnJoe1
 
Chapter 4: Financial Statement Analysis
Chapter 4: Financial Statement AnalysisChapter 4: Financial Statement Analysis
Chapter 4: Financial Statement AnalysisNada G.Youssef
 
Amazon ebay comparison presentation with simple regression analysis
Amazon ebay comparison presentation with simple regression analysisAmazon ebay comparison presentation with simple regression analysis
Amazon ebay comparison presentation with simple regression analysisChien Jaw
 
EIA2019Portugal - Building Your Financials - Rick Rasmussen
EIA2019Portugal - Building Your Financials - Rick RasmussenEIA2019Portugal - Building Your Financials - Rick Rasmussen
EIA2019Portugal - Building Your Financials - Rick RasmussenEuropean Innovation Academy
 
Financial Planing PowerPoint Presentation Slides
Financial Planing PowerPoint Presentation Slides Financial Planing PowerPoint Presentation Slides
Financial Planing PowerPoint Presentation Slides SlideTeam
 
Module 5.2 - Financial sustainability
Module 5.2 - Financial sustainabilityModule 5.2 - Financial sustainability
Module 5.2 - Financial sustainabilityszpinter
 

Similar a Apple 2015 Financial Analysis Reveals Higher Profits and Efficiency (20)

Coca-Cola 2016 Financial Analysis (Half year ended 30 June)
Coca-Cola 2016 Financial Analysis (Half year ended 30 June)Coca-Cola 2016 Financial Analysis (Half year ended 30 June)
Coca-Cola 2016 Financial Analysis (Half year ended 30 June)
 
manpreet fianacial statement analysis
manpreet fianacial statement analysismanpreet fianacial statement analysis
manpreet fianacial statement analysis
 
FinancialStmtAnalysis-Garrison11ePPT (1).ppt
FinancialStmtAnalysis-Garrison11ePPT (1).pptFinancialStmtAnalysis-Garrison11ePPT (1).ppt
FinancialStmtAnalysis-Garrison11ePPT (1).ppt
 
Common size analysis
Common size analysisCommon size analysis
Common size analysis
 
EIA2016 Turin - Rick Rasmussen. P&L Statements
EIA2016 Turin - Rick Rasmussen. P&L StatementsEIA2016 Turin - Rick Rasmussen. P&L Statements
EIA2016 Turin - Rick Rasmussen. P&L Statements
 
Acc mgt noreen14 how well am i doing financial statement analysis
Acc mgt noreen14 how well am i doing financial statement analysisAcc mgt noreen14 how well am i doing financial statement analysis
Acc mgt noreen14 how well am i doing financial statement analysis
 
2019 sold biz study color
2019 sold biz study color2019 sold biz study color
2019 sold biz study color
 
Financial statement analysis
Financial statement analysisFinancial statement analysis
Financial statement analysis
 
Take Assessment Exam 3Top of FormNameExam 3 Ins.docx
Take Assessment Exam 3Top of FormNameExam 3 Ins.docxTake Assessment Exam 3Top of FormNameExam 3 Ins.docx
Take Assessment Exam 3Top of FormNameExam 3 Ins.docx
 
STATEMENT OF CASH FLOWS.ppt
STATEMENT OF CASH FLOWS.pptSTATEMENT OF CASH FLOWS.ppt
STATEMENT OF CASH FLOWS.ppt
 
LVC 04-SRM- Master of Business Adminsitration
LVC 04-SRM- Master of Business AdminsitrationLVC 04-SRM- Master of Business Adminsitration
LVC 04-SRM- Master of Business Adminsitration
 
Financial Boot Camp for Entrepreneurs - 2016
Financial Boot Camp for Entrepreneurs - 2016Financial Boot Camp for Entrepreneurs - 2016
Financial Boot Camp for Entrepreneurs - 2016
 
2-Accounting Presentation 2012
2-Accounting Presentation 20122-Accounting Presentation 2012
2-Accounting Presentation 2012
 
chapter 1.ppt
chapter 1.pptchapter 1.ppt
chapter 1.ppt
 
Chapter 4: Financial Statement Analysis
Chapter 4: Financial Statement AnalysisChapter 4: Financial Statement Analysis
Chapter 4: Financial Statement Analysis
 
Amazon ebay comparison presentation with simple regression analysis
Amazon ebay comparison presentation with simple regression analysisAmazon ebay comparison presentation with simple regression analysis
Amazon ebay comparison presentation with simple regression analysis
 
EIA2019Portugal - Building Your Financials - Rick Rasmussen
EIA2019Portugal - Building Your Financials - Rick RasmussenEIA2019Portugal - Building Your Financials - Rick Rasmussen
EIA2019Portugal - Building Your Financials - Rick Rasmussen
 
Financial Planing PowerPoint Presentation Slides
Financial Planing PowerPoint Presentation Slides Financial Planing PowerPoint Presentation Slides
Financial Planing PowerPoint Presentation Slides
 
Bottom Line Improvement
Bottom Line ImprovementBottom Line Improvement
Bottom Line Improvement
 
Module 5.2 - Financial sustainability
Module 5.2 - Financial sustainabilityModule 5.2 - Financial sustainability
Module 5.2 - Financial sustainability
 

Más de VCE Accounting - Michael Allison

Chapter 18 Product Costs, Period Costs, NRV - Test Solutions
Chapter 18 Product Costs, Period Costs, NRV - Test SolutionsChapter 18 Product Costs, Period Costs, NRV - Test Solutions
Chapter 18 Product Costs, Period Costs, NRV - Test SolutionsVCE Accounting - Michael Allison
 
Chapter 17 Buying and Selling Non-Current Assets - Test Solutions
Chapter 17 Buying and Selling Non-Current Assets - Test SolutionsChapter 17 Buying and Selling Non-Current Assets - Test Solutions
Chapter 17 Buying and Selling Non-Current Assets - Test SolutionsVCE Accounting - Michael Allison
 

Más de VCE Accounting - Michael Allison (20)

VCE Accounting Unit 3-4 Exam Revision Tests
VCE Accounting Unit 3-4 Exam Revision TestsVCE Accounting Unit 3-4 Exam Revision Tests
VCE Accounting Unit 3-4 Exam Revision Tests
 
Chapter 22 Analysis and Interpretation - Test 2 Solutions
Chapter 22 Analysis and Interpretation - Test 2 SolutionsChapter 22 Analysis and Interpretation - Test 2 Solutions
Chapter 22 Analysis and Interpretation - Test 2 Solutions
 
Chapter 22 Analysis and Interpretation - Test 2
Chapter 22 Analysis and Interpretation - Test 2Chapter 22 Analysis and Interpretation - Test 2
Chapter 22 Analysis and Interpretation - Test 2
 
Chapter 22 Analysis and Interpretation - Test 1
Chapter 22 Analysis and Interpretation - Test 1Chapter 22 Analysis and Interpretation - Test 1
Chapter 22 Analysis and Interpretation - Test 1
 
Chapter 22 Analysis and Interpretation - Test 1 Solutions
Chapter 22 Analysis and Interpretation - Test 1 SolutionsChapter 22 Analysis and Interpretation - Test 1 Solutions
Chapter 22 Analysis and Interpretation - Test 1 Solutions
 
Chapter 21 Budgeting - Test 2 Solutions
Chapter 21 Budgeting - Test 2 SolutionsChapter 21 Budgeting - Test 2 Solutions
Chapter 21 Budgeting - Test 2 Solutions
 
Chapter 21 Budgeting - Test 2
Chapter 21 Budgeting - Test 2Chapter 21 Budgeting - Test 2
Chapter 21 Budgeting - Test 2
 
Chapter 21 Budgeting - Test 1
Chapter 21 Budgeting - Test 1Chapter 21 Budgeting - Test 1
Chapter 21 Budgeting - Test 1
 
Chapter 21 Budgeting - Test 1 Solutions
Chapter 21 Budgeting - Test 1 SolutionsChapter 21 Budgeting - Test 1 Solutions
Chapter 21 Budgeting - Test 1 Solutions
 
Chapter 19 Prepaid and Accrued Revenues - Test
Chapter 19 Prepaid and Accrued Revenues - TestChapter 19 Prepaid and Accrued Revenues - Test
Chapter 19 Prepaid and Accrued Revenues - Test
 
Chapter 18 Product Costs, Period Costs, NRV - Test Solutions
Chapter 18 Product Costs, Period Costs, NRV - Test SolutionsChapter 18 Product Costs, Period Costs, NRV - Test Solutions
Chapter 18 Product Costs, Period Costs, NRV - Test Solutions
 
Chapter 18 Product Costs, Period Costs, NRV - Test
Chapter 18 Product Costs, Period Costs, NRV - TestChapter 18 Product Costs, Period Costs, NRV - Test
Chapter 18 Product Costs, Period Costs, NRV - Test
 
Chapter 17 Buying and Selling Non-Current Assets - Test Solutions
Chapter 17 Buying and Selling Non-Current Assets - Test SolutionsChapter 17 Buying and Selling Non-Current Assets - Test Solutions
Chapter 17 Buying and Selling Non-Current Assets - Test Solutions
 
Chapter 17 Buying and Selling Non-Current Assets - Test
Chapter 17 Buying and Selling Non-Current Assets - TestChapter 17 Buying and Selling Non-Current Assets - Test
Chapter 17 Buying and Selling Non-Current Assets - Test
 
Chapter 16 Reducing Balance Depreciation - Test Solutions
Chapter 16 Reducing Balance Depreciation - Test SolutionsChapter 16 Reducing Balance Depreciation - Test Solutions
Chapter 16 Reducing Balance Depreciation - Test Solutions
 
Chapter 16 Reducing Balance Depreciation - Test
Chapter 16 Reducing Balance Depreciation - TestChapter 16 Reducing Balance Depreciation - Test
Chapter 16 Reducing Balance Depreciation - Test
 
Chapter 15 Accounting for Returns - Test Solutions
Chapter 15 Accounting for Returns - Test SolutionsChapter 15 Accounting for Returns - Test Solutions
Chapter 15 Accounting for Returns - Test Solutions
 
Chapter 15 Accounting for Returns - Test
Chapter 15 Accounting for Returns - TestChapter 15 Accounting for Returns - Test
Chapter 15 Accounting for Returns - Test
 
Chapter 14 Prepaid and Accrued Expenses - Test Solutions
Chapter 14 Prepaid and Accrued Expenses - Test SolutionsChapter 14 Prepaid and Accrued Expenses - Test Solutions
Chapter 14 Prepaid and Accrued Expenses - Test Solutions
 
Chapter 14 Prepaid and Accrued Expenses - Test
Chapter 14 Prepaid and Accrued Expenses - TestChapter 14 Prepaid and Accrued Expenses - Test
Chapter 14 Prepaid and Accrued Expenses - Test
 

Último

The basics of sentences session 2pptx copy.pptx
The basics of sentences session 2pptx copy.pptxThe basics of sentences session 2pptx copy.pptx
The basics of sentences session 2pptx copy.pptxheathfieldcps1
 
Separation of Lanthanides/ Lanthanides and Actinides
Separation of Lanthanides/ Lanthanides and ActinidesSeparation of Lanthanides/ Lanthanides and Actinides
Separation of Lanthanides/ Lanthanides and ActinidesFatimaKhan178732
 
Presentation by Andreas Schleicher Tackling the School Absenteeism Crisis 30 ...
Presentation by Andreas Schleicher Tackling the School Absenteeism Crisis 30 ...Presentation by Andreas Schleicher Tackling the School Absenteeism Crisis 30 ...
Presentation by Andreas Schleicher Tackling the School Absenteeism Crisis 30 ...EduSkills OECD
 
The Most Excellent Way | 1 Corinthians 13
The Most Excellent Way | 1 Corinthians 13The Most Excellent Way | 1 Corinthians 13
The Most Excellent Way | 1 Corinthians 13Steve Thomason
 
Advanced Views - Calendar View in Odoo 17
Advanced Views - Calendar View in Odoo 17Advanced Views - Calendar View in Odoo 17
Advanced Views - Calendar View in Odoo 17Celine George
 
Activity 01 - Artificial Culture (1).pdf
Activity 01 - Artificial Culture (1).pdfActivity 01 - Artificial Culture (1).pdf
Activity 01 - Artificial Culture (1).pdfciinovamais
 
Accessible design: Minimum effort, maximum impact
Accessible design: Minimum effort, maximum impactAccessible design: Minimum effort, maximum impact
Accessible design: Minimum effort, maximum impactdawncurless
 
Nutritional Needs Presentation - HLTH 104
Nutritional Needs Presentation - HLTH 104Nutritional Needs Presentation - HLTH 104
Nutritional Needs Presentation - HLTH 104misteraugie
 
Privatization and Disinvestment - Meaning, Objectives, Advantages and Disadva...
Privatization and Disinvestment - Meaning, Objectives, Advantages and Disadva...Privatization and Disinvestment - Meaning, Objectives, Advantages and Disadva...
Privatization and Disinvestment - Meaning, Objectives, Advantages and Disadva...RKavithamani
 
Z Score,T Score, Percential Rank and Box Plot Graph
Z Score,T Score, Percential Rank and Box Plot GraphZ Score,T Score, Percential Rank and Box Plot Graph
Z Score,T Score, Percential Rank and Box Plot GraphThiyagu K
 
Student login on Anyboli platform.helpin
Student login on Anyboli platform.helpinStudent login on Anyboli platform.helpin
Student login on Anyboli platform.helpinRaunakKeshri1
 
POINT- BIOCHEMISTRY SEM 2 ENZYMES UNIT 5.pptx
POINT- BIOCHEMISTRY SEM 2 ENZYMES UNIT 5.pptxPOINT- BIOCHEMISTRY SEM 2 ENZYMES UNIT 5.pptx
POINT- BIOCHEMISTRY SEM 2 ENZYMES UNIT 5.pptxSayali Powar
 
Introduction to AI in Higher Education_draft.pptx
Introduction to AI in Higher Education_draft.pptxIntroduction to AI in Higher Education_draft.pptx
Introduction to AI in Higher Education_draft.pptxpboyjonauth
 
Kisan Call Centre - To harness potential of ICT in Agriculture by answer farm...
Kisan Call Centre - To harness potential of ICT in Agriculture by answer farm...Kisan Call Centre - To harness potential of ICT in Agriculture by answer farm...
Kisan Call Centre - To harness potential of ICT in Agriculture by answer farm...Krashi Coaching
 
Grant Readiness 101 TechSoup and Remy Consulting
Grant Readiness 101 TechSoup and Remy ConsultingGrant Readiness 101 TechSoup and Remy Consulting
Grant Readiness 101 TechSoup and Remy ConsultingTechSoup
 
1029 - Danh muc Sach Giao Khoa 10 . pdf
1029 -  Danh muc Sach Giao Khoa 10 . pdf1029 -  Danh muc Sach Giao Khoa 10 . pdf
1029 - Danh muc Sach Giao Khoa 10 . pdfQucHHunhnh
 
Paris 2024 Olympic Geographies - an activity
Paris 2024 Olympic Geographies - an activityParis 2024 Olympic Geographies - an activity
Paris 2024 Olympic Geographies - an activityGeoBlogs
 
Mastering the Unannounced Regulatory Inspection
Mastering the Unannounced Regulatory InspectionMastering the Unannounced Regulatory Inspection
Mastering the Unannounced Regulatory InspectionSafetyChain Software
 
1029-Danh muc Sach Giao Khoa khoi 6.pdf
1029-Danh muc Sach Giao Khoa khoi  6.pdf1029-Danh muc Sach Giao Khoa khoi  6.pdf
1029-Danh muc Sach Giao Khoa khoi 6.pdfQucHHunhnh
 
Employee wellbeing at the workplace.pptx
Employee wellbeing at the workplace.pptxEmployee wellbeing at the workplace.pptx
Employee wellbeing at the workplace.pptxNirmalaLoungPoorunde1
 

Último (20)

The basics of sentences session 2pptx copy.pptx
The basics of sentences session 2pptx copy.pptxThe basics of sentences session 2pptx copy.pptx
The basics of sentences session 2pptx copy.pptx
 
Separation of Lanthanides/ Lanthanides and Actinides
Separation of Lanthanides/ Lanthanides and ActinidesSeparation of Lanthanides/ Lanthanides and Actinides
Separation of Lanthanides/ Lanthanides and Actinides
 
Presentation by Andreas Schleicher Tackling the School Absenteeism Crisis 30 ...
Presentation by Andreas Schleicher Tackling the School Absenteeism Crisis 30 ...Presentation by Andreas Schleicher Tackling the School Absenteeism Crisis 30 ...
Presentation by Andreas Schleicher Tackling the School Absenteeism Crisis 30 ...
 
The Most Excellent Way | 1 Corinthians 13
The Most Excellent Way | 1 Corinthians 13The Most Excellent Way | 1 Corinthians 13
The Most Excellent Way | 1 Corinthians 13
 
Advanced Views - Calendar View in Odoo 17
Advanced Views - Calendar View in Odoo 17Advanced Views - Calendar View in Odoo 17
Advanced Views - Calendar View in Odoo 17
 
Activity 01 - Artificial Culture (1).pdf
Activity 01 - Artificial Culture (1).pdfActivity 01 - Artificial Culture (1).pdf
Activity 01 - Artificial Culture (1).pdf
 
Accessible design: Minimum effort, maximum impact
Accessible design: Minimum effort, maximum impactAccessible design: Minimum effort, maximum impact
Accessible design: Minimum effort, maximum impact
 
Nutritional Needs Presentation - HLTH 104
Nutritional Needs Presentation - HLTH 104Nutritional Needs Presentation - HLTH 104
Nutritional Needs Presentation - HLTH 104
 
Privatization and Disinvestment - Meaning, Objectives, Advantages and Disadva...
Privatization and Disinvestment - Meaning, Objectives, Advantages and Disadva...Privatization and Disinvestment - Meaning, Objectives, Advantages and Disadva...
Privatization and Disinvestment - Meaning, Objectives, Advantages and Disadva...
 
Z Score,T Score, Percential Rank and Box Plot Graph
Z Score,T Score, Percential Rank and Box Plot GraphZ Score,T Score, Percential Rank and Box Plot Graph
Z Score,T Score, Percential Rank and Box Plot Graph
 
Student login on Anyboli platform.helpin
Student login on Anyboli platform.helpinStudent login on Anyboli platform.helpin
Student login on Anyboli platform.helpin
 
POINT- BIOCHEMISTRY SEM 2 ENZYMES UNIT 5.pptx
POINT- BIOCHEMISTRY SEM 2 ENZYMES UNIT 5.pptxPOINT- BIOCHEMISTRY SEM 2 ENZYMES UNIT 5.pptx
POINT- BIOCHEMISTRY SEM 2 ENZYMES UNIT 5.pptx
 
Introduction to AI in Higher Education_draft.pptx
Introduction to AI in Higher Education_draft.pptxIntroduction to AI in Higher Education_draft.pptx
Introduction to AI in Higher Education_draft.pptx
 
Kisan Call Centre - To harness potential of ICT in Agriculture by answer farm...
Kisan Call Centre - To harness potential of ICT in Agriculture by answer farm...Kisan Call Centre - To harness potential of ICT in Agriculture by answer farm...
Kisan Call Centre - To harness potential of ICT in Agriculture by answer farm...
 
Grant Readiness 101 TechSoup and Remy Consulting
Grant Readiness 101 TechSoup and Remy ConsultingGrant Readiness 101 TechSoup and Remy Consulting
Grant Readiness 101 TechSoup and Remy Consulting
 
1029 - Danh muc Sach Giao Khoa 10 . pdf
1029 -  Danh muc Sach Giao Khoa 10 . pdf1029 -  Danh muc Sach Giao Khoa 10 . pdf
1029 - Danh muc Sach Giao Khoa 10 . pdf
 
Paris 2024 Olympic Geographies - an activity
Paris 2024 Olympic Geographies - an activityParis 2024 Olympic Geographies - an activity
Paris 2024 Olympic Geographies - an activity
 
Mastering the Unannounced Regulatory Inspection
Mastering the Unannounced Regulatory InspectionMastering the Unannounced Regulatory Inspection
Mastering the Unannounced Regulatory Inspection
 
1029-Danh muc Sach Giao Khoa khoi 6.pdf
1029-Danh muc Sach Giao Khoa khoi  6.pdf1029-Danh muc Sach Giao Khoa khoi  6.pdf
1029-Danh muc Sach Giao Khoa khoi 6.pdf
 
Employee wellbeing at the workplace.pptx
Employee wellbeing at the workplace.pptxEmployee wellbeing at the workplace.pptx
Employee wellbeing at the workplace.pptx
 

Apple 2015 Financial Analysis Reveals Higher Profits and Efficiency

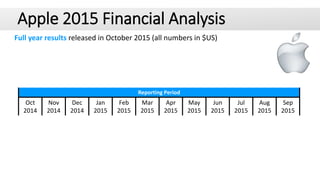
  • 1. Apple 2015 Financial Analysis Full year results released in October 2015 (all numbers in $US) Oct 2014 Nov 2014 Dec 2014 Jan 2015 Feb 2015 Mar 2015 Apr 2015 May 2015 Jun 2015 Jul 2015 Aug 2015 Sep 2015 Reporting Period Oct 2014 Nov 2014 Dec 2014 Jan 2015 Feb 2015 Mar 2015 Apr 2015 May 2015 Jun 2015 Jul 2015 Aug 2015 Sep 2015
  • 3. The Key Numbers In $millions This Period Last Period Variance Sales 233715 182795 +28% Cost of Goods Sold 140089 112258 +25% Gross Profit 93626 70537 +33% Net Profit 53394 39510 +35% Current Assets 89378 68531 +30% Non-Current Assets 201101 163308 +23% Current Liabilities 80610 63448 +27% Non-Current Liabilities 90514 56844 +59% Owner's Equity 119355 111547 +7% In $millions This Period Last Period Variance Sales 233715 182795 +28% Cost of Goods Sold 140089 112258 +25% Gross Profit 93626 70537 +33% Net Profit 53394 39510 +35% Current Assets 89378 68531 +30% Non-Current Assets 201101 163308 +23% Current Liabilities 80610 63448 +27% Non-Current Liabilities 90514 56844 +59% Owner's Equity 119355 111547 +7% In $millions This Period Last Period Variance Sales 233715 182795 +28% Cost of Goods Sold 140089 112258 +25% Gross Profit 93626 70537 +33% Net Profit 53394 39510 +35% Current Assets 89378 68531 +30% Non-Current Assets 201101 163308 +23% Current Liabilities 80610 63448 +27% Non-Current Liabilities 90514 56844 +59% Owner's Equity 119355 111547 +7% In $millions This Period Last Period Variance Sales 233715 182795 +28% Cost of Goods Sold 140089 112258 +25% Gross Profit 93626 70537 +33% Net Profit 53394 39510 +35% Current Assets 89378 68531 +30% Non-Current Assets 201101 163308 +23% Current Liabilities 80610 63448 +27% Non-Current Liabilities 90514 56844 +59% Owner's Equity 119355 111547 +7% In $millions This Period Last Period Variance Sales 233715 182795 +28% Cost of Goods Sold 140089 112258 +25% Gross Profit 93626 70537 +33% Net Profit 53394 39510 +35% Current Assets 89378 68531 +30% Non-Current Assets 201101 163308 +23% Current Liabilities 80610 63448 +27% Non-Current Liabilities 90514 56844 +59% Owner's Equity 119355 111547 +7% In $millions This Period Last Period Variance Sales 233715 182795 +28% Cost of Goods Sold 140089 112258 +25% Gross Profit 93626 70537 +33% Net Profit 53394 39510 +35% Current Assets 89378 68531 +30% Non-Current Assets 201101 163308 +23% Current Liabilities 80610 63448 +27% Non-Current Liabilities 90514 56844 +59% Owner's Equity 119355 111547 +7% In $millions This Period Last Period Variance Sales 233715 182795 +28% Cost of Goods Sold 140089 112258 +25% Gross Profit 93626 70537 +33% Net Profit 53394 39510 +35% Current Assets 89378 68531 +30% Non-Current Assets 201101 163308 +23% Current Liabilities 80610 63448 +27% Non-Current Liabilities 90514 56844 +59% Owner's Equity 119355 111547 +7% In $millions This Period Last Period Variance Sales 233715 182795 +28% Cost of Goods Sold 140089 112258 +25% Gross Profit 93626 70537 +33% Net Profit 53394 39510 +35% Current Assets 89378 68531 +30% Non-Current Assets 201101 163308 +23% Current Liabilities 80610 63448 +27% Non-Current Liabilities 90514 56844 +59% Owner's Equity 119355 111547 +7% In $millions This Period Last Period Variance Sales 233715 182795 +28% Cost of Goods Sold 140089 112258 +25% Gross Profit 93626 70537 +33% Net Profit 53394 39510 +35% Current Assets 89378 68531 +30% Non-Current Assets 201101 163308 +23% Current Liabilities 80610 63448 +27% Non-Current Liabilities 90514 56844 +59% Owner's Equity 119355 111547 +7% In $millions This Period Last Period Variance Sales 233715 182795 +28% Cost of Goods Sold 140089 112258 +25% Gross Profit 93626 70537 +33% Net Profit 53394 39510 +35% Current Assets 89378 68531 +30% Non-Current Assets 201101 163308 +23% Current Liabilities 80610 63448 +27% Non-Current Liabilities 90514 56844 +59% Owner's Equity 119355 111547 +7%
  • 4. The Key Numbers Operating Investing Financing Operating Investing Financing +81266 m ─56274 m ─17716 m Cash Balance This Period Operating Investing Financing Operating Investing Financing +59713 m ─22579 m Cash Balance Last Period ─37549 m +7276m Change in Cash Balance ─415m Change in Cash Balance
  • 5. Analysis of the Financial Reports
  • 6. Analysis of the Financial Reports Profitability Gross Profit Margin This Period Last Period Comparison 40.1% 38.6% Better Sales $1.00 Gross Profit 40.1c COGS 59.9c Income Statement What does this mean? For every $1 the firm generates in sales: • A Gross Profit of 40.1 cents is earned • Once the Cost of Goods Sold is deducted.
  • 7. Analysis of the Financial Reports Profitability Net Profit Margin This Period Last Period Comparison 22.8% 21.6% Better Income Statement $1.00 of Sales Gross Profit 40.1c COGS 59.9c Net Profit 22.8c Other Expenses 17.3c What does this mean? For every $1 the firm generates in sales an overall Net Profit of 22.8 cents is earned.
  • 8. Analysis of the Financial Reports This Period Sales $1.00 Gross Profit 40.1c COGS 59.9c Net Profit 22.8c Other Exp 17.3c ─ = ─ = Last Period Sales $1.00 Gross Profit 38.6c COGS 61.4c Net Profit 21.6c Other Exp 17.0c ─ = ─ = Lower COGS… possible causes? • Suppliers ↓ prices • Mark-ups ↑ And a better Net Profit Margin… possible causes? • But ↑ in Oth. Exp.??? • ↑ GP > ↑ in Oth. Exp .
  • 9. Analysis of the Financial Reports Profitability Return on Assets This Period Last Period Comparison 18.4% 13.6% Better What does this mean? For every $1 of Assets the firm has, the business is earning a Net Profit of 18.4 cents. Business Net Profit 18.4c Balance Sheet Assets Liabilities Owner’s Equity Balance Sheet Assets Liabilities $1 Owner’s Equity
  • 10. Analysis of the Financial Reports Return on Investment This Period Last Period Comparison 46.2% 35.4% Better What does this mean? For every $1 of Capital invested in the firm, the business is earning a Net Profit of 46.2 cents. Net Profit 46.2c Balance Sheet Assets Liabilities Owner’s Eq. $1 Business Balance Sheet Assets Liabilities Owner’s Eq. $1 Profitability
  • 11. Analysis of the Financial Reports Efficiency Asset Turnover Ratio This Period Last Period Comparison 0.80 times 0.63 times Better Business $0.80 of Sales Balance Sheet Assets Liabilities Owner’s Equity Balance Sheet Assets Liabilities $1 Owner’s Equity What does this mean? For every $1 of Assets the firm has, the business generates $0.80 of sales
  • 12. Analysis of the Financial Reports Efficiency This Period Last Period Profitability and DuPont Formula 0.80 times 0.63 times 22.8% 21.6% 18.4% 13.6% = X = X Asset Turnover Net Profit Margin Return on Assets = X Better ROA More efficient at making sales And each sale made at a higher Net Profit
  • 13. Analysis of the Financial Reports Efficiency Stock Turnover Ratio This Period Last Period Comparison 6 days 7 days Better What does this mean? The firm takes, on average, 6 days to sell all of its inventory 0 6 days Stock bought Stock sold
  • 14. Analysis of the Financial Reports Liquidity Working Capital Ratio This Period Last Period Comparison 1.11 1.08 Better What does this mean? For every $1 of Current Liabilities the firm has, there are $1.11 in Current Assets to pay them Balance Sheet Current Assets Current Liabilities $1.53 $1.00 Balance Sheet Current Assets Current Liabilities $1.53 $1.00 Balance Sheet Current Assets Current Liabilities $1.11 $1.00
  • 15. Analysis of the Financial Reports Liquidity Quick Asset Ratio This Period Last Period Comparison 1.08 1.05 Better What does this mean? For every $1 of Urgent Liabilities the firm has, there are $1.08 in Quick Assets to pay them $1.08 Quick Assets $1.00 Urgent Liabilities
  • 16. Analysis of the Financial Reports Liquidity Cash Flow Ratio This Period Last Period Comparison 1.13 0.94 Better What does this mean? For every $1 of Current Liabilities the firm has, the firm’s Operating Activities are generating $1.13 to pay them Operating Investing Financing $1.13 Cash Balance $1.00 Current Liabilities Nothing needed from here
  • 17. Analysis of the Financial Reports Stability Debt Ratio (Gearing) This Period Last Period Comparison 59% 52% Worse What does this mean? 59% of the firm’s Total Assets have been financed with debt (Liabilities) Balance Sheet Assets Liabilities $1.00 $0.60 Owner’s Equity $0.40 Balance Sheet Assets Liabilities $1.00 $0.60 Owner’s Equity $0.40 Balance Sheet Assets Liabilities $1.00 $0.59 Owner’s Equity $0.40 Balance Sheet Assets Liabilities $1.00 $0.59 Owner’s Equity $0.41
  • 19. Summary of Results This Period Last PeriodProfitability Gross Profit Margin 40.1% 38.6% Net Profit Margin 22.8% 21.6% Return on Assets 18.4% 13.6% Return on Investment 46.2% 35.4% Efficiency Asset Turnover Ratio 0.80 times 0.63 times Stock Turnover Ratio 6 days 7 days This Period Last PeriodLiquidity Working Capital Ratio 1.11 1.08 Quick Asset Ratio 1.08 1.05 Cash Flow Ratio 1.13 0.94 Debt Ratio (Gearing) 59% 52% Stability