SlideShare una empresa de Scribd logo
1 de 8
Descargar para leer sin conexión
WE’VE BEEN ACCUSED OF EXTOLLING the vir-
tues of investing in stocks that pay a growing
dividend almost to the point of hyperbole. To that we
plead guilty—sort of. We’ll explain in a moment. Part
of the reason behind our enthusiasm for dividend stocks
is the fact that our EQUITY INCOME strategy, which
focuses on investing in high-yield stocks(1) that pay a
growing dividend has done well both at growing client
income and on a total return basis. This has been done
during what has been one of the most challenging in-
vestment environments for stocks since the 1930s.
As we tend to remind folks almost on a quarterly
basis,(2) every major stock market index is still down in
price since year end 1999. Which means for every dollar
invested in the S&P 500 index in 1999, investors have
less than a dollar in their pocket today—more than a
decade later. That’s excluding any return from dividends.
After factoring in the erosion in purchasing power from
inflation, investors are down even more.
If there’s a silver lining in the dismal stock market
price performance over the last decade or so, it’s the fact
that inflation has been relatively benign, by historical
standards, which has helped hold the cost of living in
check. We doubt many NASDAQ investors still feeling
the pain from a 55% loss since 1999 would agree or
even care much about the flat inflation statistics of the
last ten years.
Our enthusiasm for dividend paying stocks, par-
ticularly those with the financial strength to raise them
on a regular basis, remains in full, ah, enthusiastic-ness,
mode in the current financial environment for one im-
portant and often overlooked reason: there simply isn’t
anywhere else to go. In other words, when you look around
for reasonable investment alternatives in the current
zero interest rate environment, there just aren’t any
viable alternatives to high yield stocks, for long-term
investment options that is. Particularly when it comes
to the income side of the investment equation to help
provide for living expenses in retirement, for example.
Beware the Long Term Bond!
Long-term bonds, as we’ve noted several times in re-
cent issues, are in the throes, in our humble opinion, of
what could well turn out to be the biggest bubble in
financial history. Why do we say that? Well for the
most obvious of reasons; interest rates have never been
this low—ever. Does that mean we know when interest
rates will begin to rise and the bond market bubble will
burst spewing bond losses all over investors in an ugly,
price deflating spiral? No, of course not, but we do
know from having gone through an interest rate spike
in the late 1970s, that buying a 10-year Treasury Note
with a current yield of less than 2.5% is simply not
worth the considerable risk.
Needless to say, hardened VIEWPOINT readers
have heard all this from us many times before. But that
doesn’t keep us from feeling compelled to remind you.
Besides, what else is there to write about? The
Cardinals? Yeah, right. Well maybe the Rams.
Investing for the Long Term
Is there any other kind of investing?
One of the many mistaken beliefs about investing is that
there is such a thing as “short-term” investing. The way
we see it, investing is long term, everything else should
be considered “savings.” We realize that we may be
arguing semantics, but it would probably help most
investors meet their long-term investment objectives if
they made a distinction between saving and investing.
When you can clearly indentify the potential use of
the money: college tuition, room addition, rainy day
fund, it should be considered savings and kept in liquid
investments like money market funds, Certificates of
Deposit or other short-term, safe and stable assets (like
treasury bills). The primary objective of savings is the
preservation of, and ready access to your capital. It
should not be put into anything that could fluctuate in
value and lose money between the time it’s socked away
(Continued on page 4)
3rd Quarter 2010
Volume 11, Issue 3
Helping You Navigate in an Uncertain Investment World
Inside this issue:
Dividend Growth Investing 1
Front Seat, Investing and the proper
attitude about stock prices
2
Chart 1: Does share price matter? 2
Table 1: If dividends are growing? 3
Chart 2: How income grows over time. 4
Demystifying Mutual Fund Fees 8
Chart 3: How Principal grows over time 5
Johnson & Johnson Review 6
Equity Income Portfolio
3rd Qrt 2010 Update
7
1) For the record, our definition of “high yield” is dividend yield more than twice the S&P 500 index average. 2) Okay, how about
every quarter.
Dividend Growth Investing: It’s About Capturing Compounding
Dividend yield and dividend growth make for a potent compounding machine.
Deschaine & Company
is an SEC registered
investment advisor,
managing approxi-
mately $70 million for
pensions, endowments,
and individuals.
WorldHeadquarters
128 South Fairway Drive
Belleville, Illinois 62223
Phone: (618) 397-1002
mark@deschaineandcompany.com
marnie@deschaineandcompany.com
MaryvilleOffice
Jason Loyd
(618) 288-2200
jason@deschaineandcompany.com
HighlandOffice
Matt Powers
(618) 654-6262
matt@deschaineandcompany.com
We’re on the Web at:
deschaineandcompany.com
Deschaine&Company,L.L.C.
A REGISTERED INVESTMENT ADVISOR
Deschaine & Company
Illinois PBE Certification
Deschaine & Company was recently
certified as a “Person with a Disabil-
ity Business Enterprise” (PBE) under
the State of Illinois Business Enter-
prise Program for Minorities, Fe-
males, and Persons with Disabilities.
For more information on our
certification, please contact Mark
Deschaine at (618) 397-1002.
Page 2
“Another word for Volatility is “Opportunity” (3)
-- Mark Deschaine,
President & Chief Investment Officer
AFTER MORE THAN 30 YEARS in the investment manage-
ment business and many hundreds, if not thousands of
conversations with investors of all stripes, sizes and sophistica-
tion, I’m convinced that prices are at the heart of their conster-
nation with the stock market. Actually, I should clarify my
previous statement, I’m convinced it’s the propensity for stock
prices to “fluctuate” that’s at the heart of most investors anxi-
ety with investing in stocks. They don’t like it when stock
prices fluctuate, although mostly they don’t like it when prices
go down. Higher prices they’re okay with, (funny how, I never
hear anyone complain about
“volatility” on the upside) as
rising stock prices tend to
have a peculiarly soothing
effect on many an inves-
tor’s psyche.
Unfortunately, that’s
not the proper way to
view prices or the stock
market—at least not if
you have any expecta-
tions of making money
consistently from invest-
ing in stocks. In fact, it’s
the exact opposite way to
view stock prices and the place
one goes to buy shares of your
favorite company, otherwise referred to as, well, the stock
“market.”
When you think about it, the stock market is certainly
appropriately named. The stock market is just that, a “market,”
for stocks. It’s nothing more than a conveniently organized
place where investors can go to buy, ah well, stocks. What else
should we call it? Yet, the fact that share prices of the thou-
sands of stocks traded on the stock market fluctuate endlessly
is without question in my mind, the reason most investors do
not do well investing in stocks. It’s fear driven by fluctuating
prices that makes investors do crazy, self-defeating things.
For all practical purposes, the stock market operates just
like your local Wal-Mart store. Again, if you stop and think
about it, Wal-Mart is a conveniently organized place where
shoppers can go to buy everything on the planet, ironically,
except publically traded stocks. But hey, give Wal-Mart time and
maybe soon you’ll be able to throw a couple of hundred shares of your
favorite stock into your shopping cart right next to motor oil, fresh
strawberries and that 46 inch flat-screen television.
The point is that the stock market is
viewed by most investors with fear and
loathing primarily because prices fluctuate.
Shoppers would probably view Wal-
Mart with fear and loathing too if they
published the daily price changes on the
merchandise they sell in their stores in the Wall Street Journal
every morning. Why I can even hear the nightly news now:
“dish-washing liquid plunged 12% today as the cleaning supplies
department dropped the price by seventy five cents a bottle. Shoppers
withdrew buying in anticipation of further price drops.”
Obviously, I’m trying (somewhat ineptly?) to use the Wal-
Mart analogy to make a point about the stock prices. But the
analogy is right on point. The stock market is just that, a
“market” of stocks. The stock “market” is open from 9:30 a.m.
to 4:00 p.m. eastern stan-
dard time, Monday
through Friday, except
national holidays.
And that’s exactly how
investors should view the
stock “market,” as nothing
more than a large, New
York based, super-market
for buying (and of course
selling) your favorite snacks,
oops, I meant “stocks.”
Smartbuyers,nomatterwhat
they’rebuying,wantlowerprices
That brings me to my next
point about investing in the
stock market. And I’ll confess, this is a point I tend to make
rather frequently, so don’t be surprised if you’ve heard it be-
fore. (But then let’s be honest, when all one does all day is talk, think and write
about one subject, and that is—repeat after me—“making money in the stock
market,” one is going to naturally have a tendency to repeat oneself, over and over
again repeatedly. Anyway, but I digress, as I often do in these pages.)
Back to my next point about investing in the stock market
and it’s this: the objective of investing is to accumulate the
largest pile of shares of stock, (of one company or multiple compa-
nies) as we possibly can. Now, as you know, I don’t profess to
be a math whiz, but I’m pretty certain that it’s better to accu-
mulate 10,000 shares of Johnson & Johnson than it is to accu-
mulate 1,000 shares and accumulating 100,000 shares of JNJ is
even better yet. (See Jason’s write up on JNJ on page 6.)
I realize I run the risk of insulting the intelligence of our
sophisticated and knowledgeable readership when I use rather
simplistic examples, but I’ve found over the years, that invest-
ing really is that simple (and are most successful) when we stick
(Continued on page 3)
3rd Quarter 2010 Viewpoint
3) Notice, I’m quoting myself now, neat huh?
VIEW FROM THE FRONT SEAT by Mark J. Deschaine
Investing Success Comes from having the proper attitude about prices!
$0.54 
$3.42 
$10.00
$2.92
$32.25
$‐
$0.50 
$1.00 
$1.50 
$2.00 
$2.50 
$3.00 
$3.50 
$-
$5.00
$10.00
$15.00
$20.00
$25.00
$30.00
$35.00
1 2 3 4 5 6 7 8 9 10 11 12 13 14 15 16 17 18 19 20 21 22 23 24 25
Chart 1: Does Share Price Even Matter?
Dividend growing at 8% a year.
Stock price going up at 5% a year.
Stock price stays flat
Stock price goes down at 5% a year.
If your dividend’s going up and you want to buy more shares, should you care about stock prices.
Yes! You should want them to go down!
Deschaine & Company, L.L.C.
to the basics. It’s when we lose sight of
the most basic objectives--like accumulat-
ing lots of shares--that we tend to under-
mine our own long-term investment ob-
jectives.
That once again brings me back to
prices. If our primary investment objec-
tive is to accumulate as many shares of
our favorite high-yield stocks as possible,
the best way to do that is for stock prices
to go down. Or barring a steady decline,
at least not have stock
prices go up a lot. What’s
that you say? Declining stock
prices are good? What are
you some kind of anti-
capitalist? Geez, everybody—
even rookie investors know
that bull markets are good
and bear markets are bad.
Talk about not understand-
ing one of the most basis in-
vestment tenets.
In the “Front Seat” column in this
year’s 1st quarter issue, I used the price
analogy of a Corvette for sale on my lawn
to make the point about how most folks
tend to view prices differently when it
comes to stocks. I included three scenar-
ios of stock prices over a 20-year period.
One included stocks dropping in half over
the first ten years, a second where prices
stayed flat and three, where prices double
over the 2o-year period. The totals after
20 years for both annual dividend income
and portfolio values confirmed that a
share price that drops over the first ten
years (before doubling) allows an investor
the ability to accumulate the largest num-
ber of shares for every dollar invested.
When combined with a growing dividend,
the compounding effect can be amazingly
powerful. I think intuitively every investor
knows that when buying stocks we want to
pay the cheapest price possible. It’s just hard to
implement in real life when share prices drop.
A longer look at prices
This time I’m going to extend the three
pricing examples to 25 years and have the
stock price either rise every year for 25
years by 5% a year, have the share price
remain flat for 25 years or the price de-
cline by 5% a year for the 25 year period.
The chart on page 2 depicts the three
scenarios. In each of the three scenarios,
the dividend increases by 8% per year
over the 25 year period, which is a reason-
able dividend growth assumption.
The question we’ve asked before in
these pages is this: if you’ve got money to
invest from dividends and interest income
or from new contributions and savings;
would you rather have stock prices go up,
stay flat, or go down? The answer when
investing $1 million in a stock with a divi-
dend that grows at 8% per year over a 25
year period is shown in table 1, below.
No, the numbers in column 3, (in red)
are not typos nor are they incorrect. I’ve
double and triple checked them. Just to be
clear, a rising dividend combined with a
declining stock price is the ideal invest-
ment environment for accumulating stocks,
growing income, and getting rich!
Lucky for us investors in buying
mode, we’re in such an environment to-
day, as many stocks are flat or have even
declined significantly since the stock mar-
ket peaked in March 2000.
What’s notable about each of the
three scenarios is that when investing in a
stock with a yield of 5% and a dividend
that’s growing at 8% a year, your total
returns (while they will vary greatly depend-
ing on what the stock price actually does) are
all exceptionally good compared to his-
torical stock market returns.
For example, the worst outcome is
when the stock price goes up 5% a year.(4)
Under that scenario, you’re forced to
chase higher prices. As a result, you’re not
able to buy as many shares with your divi-
dends. Yet the 12.30% annual com-
pounded return earned over 25 years in a
rising market environment still signifi-
cantly exceeds the long-term stock mar-
ket returns which are somewhere in the
9% neighborhood historically.
Such splendid results begs the ques-
tion; why aren’t more investors realizing
such returns? And the answer is; for a
host of reasons. Not the least of which is
that over the years, investors have given
little credence to the combined com-
pounding power of dividend yield and divi-
dend growth. And, as we mentioned ear-
lier, investors are usually scared out of
buying more shares when prices drop—
which is the exact opposite of what inves-
tors should be doing. Those two reasons
alone account for most of why investors
don’t achieve investment returns any-
where near the ones
shown here.
One important point
in case you missed it. When
it comes to reinvesting dividends
that grow at a healthy rate over a
long period of time, share price
means almost nothing.
At the end of the day,
whether the stock market
goes up, stays flat, or goes
down while we’re buying
stocks will obviously determine our an-
nual investment returns, but it really only
means the difference between earning
12%, or 14%. Or in the case of a steadily
declining stock market, some magical
compounding number like 25%! So why
sweat stock prices?
Better yet, if your dividend income
exceeds your income needs, why sweat
the stock market at all? In fact, if you’ve
got extra income to reinvest, you ought to
be rooting for prices to go down—not up!
Now, admittedly, my reasoning could
be rendered kaput if you’re forced to sell
off a sizable chunk of your portfolio to
fund some unforeseen emergency, but
except for something like that, which by
definition you can’t foresee anyway, you
shouldn’t care what the stock market does
from day to day, week to week or month
to month, other than to bargain hunt for
higher yields.
One final point about the stock mar-
ket, prices and dividend income. If your
portfolio is producing a growing income
stream from growing dividends, year in
and year out, and you’re regularly rein-
vesting your dividends, you win no mat-
ter what prices do. If prices go up, you
win with higher portfolio value, if prices
stay flat you’re able to buy shares at a
reasonable price. If they go down? You
get rich that much faster.
Now do you view stock prices differently?
(Front Seat, continued from page 2)
4) Yes, you read that correctly, the worst case scenario is when the share price in my example goes up 5% a year. What a whacky concept! The more we’ve explored the process of building wealth, the
more we’ve come to realize that a rising stock market is the enemy of investors looking to grow income and build wealth. Unfortunately, we, like every other investor on the planet have been subjected to
the endless onslaught of capital returns and the desire to get rich from latching onto a Microsoft, Wal-Mart (or now Apple?) and watch it grow 10 fold in market value. The problem with that strategy
is that it is simply extremely rare and next to impossible to find early enough in its growth cycle for an investor to catch a meaningful part of the ride up. Dividends win through relentless slow growth.
Page 3
Table 1. If your dividends are growing,
do you really want stock prices to go up? Not if you reinvesting them!
1) Stock price
goes up by
5% a year
Annual
Growth
Rate
2) Stock
price
unchanged
Annual
Growth
Rate
3) Stock price
drops by
5% per year
Annual
Growth
Rate
Annual Dividend income in year 25 $1,627,617 14.9% $6,915,014 21.8% $148,900,335 37.7%
Position Market Value in year 25 $18,183,615 12.3% $28,724,878 14.4% $286,027,048 25.1%
The results of a $1 million dollars invested in a stock with a 5% dividend yield with a dividend that grows at 8%
annually for 25 years. Under three share price scenarios: a 5% rising price, a flat price, and a share price that
declines 5% a year for 25 years. We’re always happy to send the data behind the numbers. Just let us know.
$6,915,014
$161,255 $1,344,412
$19,863,269
$-
$1,000,000
$2,000,000
$3,000,000
$4,000,000
$5,000,000
$6,000,000
$7,000,000
$8,000,000
$9,000,000
$10,000,000
$11,000,000
$12,000,000
$13,000,000
$14,000,000
$15,000,000
$16,000,000
$17,000,000
$18,000,000
$19,000,000
$20,000,000
$21,000,000
$22,000,000
1 2 3 4 5 6 7 8 9 10 11 12 13 14 15 16 17 18 19 20 21 22 23 24 25
3rd Quarter 2010 ViewpointPage 4
5) We’re realize we’re talking about investing $1,000,000, but if we can’t visualize our portfolio at that level, how can we make it happen.
Chart 2: How Income Grows over time.
Compounding $1,000,000 at 5%
Compounding $1,000,000 at 5% with a 5% annual growth in income.
Compounding $1,000,000 at 5% with an 8% annual growth in income.
Compounding $1,000,000 at 5% with an 8% annual growth in income
plus $100,000 a year in new savings/contributions
All income reinvested over 25 years.
Chart Deschaine & Company Research©
and the time you expect to need the money. Par-
ticularly in the current investment and economic
environment where capital seems more at risk
than ever. Earning an acceptable return on your
savings in today’s world is a challenge, but you
should not lose sight of your primary object of
cash, which is preserving principal in the pursuit
of a little extra (in today’s interest rate environment,
very little extra) return. You just have to get it in
your head that the trade-off between risk and
reward in today’s interest rate environment is
too great to risk the capital for any modest incre-
mental return. It’s just not worth it, period!
“There seems to be some perverse human characteristic
that likes to make easy things difficult.”
–Warren Buffett
When it comes to investing, we like to stress the
basics and nothing gets more basic than com-
pounding. Charlie Munger, Vice Chairman of
Berkshire Hathaway, says that truly understand-
ing compounding and the difficulty in getting it
consistently is the root to understanding invest-
ing. We concur. We’ll even go one step further
and suggest that having faith in the power of
money to compound over time is the very foun-
dation for investing in dividend stocks.
We recently created a series of charts and
examples in an effort to illustrate the power of
compounding, particularly the power dividend
growth too, as we like to say, “turbo charge”
returns over time.
The first thing you need to know about the
outcomes shown in the charts discussed here is
the returns do not take into account any return
from stock price change. That is, we assume
stock prices do not change. Instead, we make the
assumption that each account grows from simply
piling up dividend income that’s reinvested back
into the account. The portfolios build “at cost,”
like a savings account where the interest earned
simply accumulates in the account over time.
The value of the portfolio doesn’t change
from any change in price like a share of stock. Of
course, this assumption cuts both ways as a port-
folio would benefit if it were invested in stocks
and share prices double. Yet, as we show in the
front seat column, the portfolio would also bene-
fit more if share prices dropped over time so we
could buy more dividend producing shares at
cheaper and cheaper prices.
Dividend Growth, The Real Compounding Wonder
Let’s start with the most basic compounding
example, a bank certificate of deposit account.
Let’s say you stopped into your local bank and
your friendly banker offers to sell you a
$1,000,000 Certificate of Deposit with an annual
interest rate of 5%.(5) A bit unrealistic in today’s
interest rate environment we’ll admit, but hey,
play along. The catch is that you have to keep the
money and all the interest earned in the bank for
25 years to allow for compounding.
After 25 years, earning a positive 5% a year,
your account would grow to $3,386,355 dollars
and would be generating $161,255, in annual
income in year 25. Not too awful bad, or as the
sayinggoes,“It surebeats a sharp stickin theeye.”
The outcome is the direct result of com-
pounding from consistently positive returns of
5% per year. Most investors should do as well
because sadly most don’t.
Of course, the appeal of the stock market is
the potential to compound at a higher rate of
return than 5% thus creating a bigger pile of
money in the end. Certainly, the potential to earn
10% compounded (the long-term stock market return
often quoted in Wall Street marketing material) is a
strong incentive to invest in stocks. Consider
that $1,000,000 compounding at 10% a year
would grow to $10,834,710 in 25 years.
Here’s Where Dividend Growth Kicks In
Now let’s say this time when you walked in the
bank, your friendly banker decides he likes you so
much he’s going to cut you in on a great deal.
The bank is selling common stock in the bank at
$10 a share and they’re going to pay a cash divi-
dend of 5% a year. Your banker also offers that as
an incentive to buy shares that if you agree to
keep you stock for 25 years, they’ll raise the divi-
dend 5% a year. Under such a scenario,
$1,000,000 grows to the princely sum of
$9,681,594, and generates annual income of
$1,344,412 in year 25. Quite a jump from simply
adding a dividend that grows at a modest 5% per
year into the mix.
Next, let’s say the bank does real well and
actually increases the dividend by 8% annually. The
returns now jump to $6,915,014 in annual income in
year 25 on a portfolio value of a whopping
$28,724,878! Or more than 42 times the amount of
annual income from our basic 5% savings account
example.Thus the power of a growing dividend!
Just for grins we also calculated what would
happen if we threw an additional $100,000 in
new savings or contributions into the equation
each year. Those are the ridiculous numbers in
black or $19.8 million in annual income and a
portfolio value north of $58 million.
At this point, the question you have to ask is
(Continued from page 1)
(Continued on page 5)
Page 5
Deschaine & Company, L.L.C.
6) Of course, the contribution of interest income to total return for bonds over the long term is 100%.
$28,724,878
$3,386,355 
$9,681,594
$58,007,859 
$-
$5,000,000
$10,000,000
$15,000,000
$20,000,000
$25,000,000
$30,000,000
$35,000,000
$40,000,000
$45,000,000
$50,000,000
$55,000,000
$60,000,000
1 2 3 4 5 6 7 8 9 10 11 12 13 14 15 16 17 18 19 20 21 22 23 24 25
Chart 3: How Principal Grows over time.
Compounding $1,000,000 at 5%
Compounding $1,000,000 at 5% with a 5% annual growth in income.
Compounding $1,000,000 at 5% with an 8% annual growth in income.
Compounding $1,000,000 at 5% with an 8% annual growth in income
plus $100,000 a year in new savings/contributions.
All income reinvested over 25 years.
how reasonable are our assumptions? First, a 5%
dividend yield. Our current EQUITY INCOME
portfolio yields 5.85% as of September 30, 2010.
Its been as high as 7.05%. Second, how reason-
able is an annual dividend growth rate of 8%?
The EQUITY INCOME portfolio’s annual divi-
dend growth rate since 2000 is about 12%,
which includes 2008 and 2009 when the portfo-
lio had 13 stocks—all financial related—that cut
or eliminated their dividends. Dividend growth
so far in 2010 for the EI portfolio is about 13%.
For the record, our annual dividend growth
rate target is 8%. Anything above that we’ll
consider a bonus. We do feel dividends will
grow over the next decade despite the economic
challenges the country faces for a number of
reasons, including the fact that companies are
generating record levels of discretionary cash
from having reduced overhead during the reces-
sion. They also have a record amount of cash on
their balance sheets for the same reason. It’s our
hope and expectation the managers will do the
smart thing and increase dividends rather than
many of the other less efficient things they
might do with the extra cash.
As charts 2 and 3 show, earning 5% and
having that 5% grow at 8% a year over 25 years
will produce quite acceptable investment results.
Any boost from stock prices or dividend yields and
higher dividend growth rates will just add to our
pileofmoney in theend.
“Tax Arbitrage Feedback Theory” (Say What?)
We’ve had the privilege over our long career to
meet some truly smart folks and associated with
some genuinely nice people in the investment
management business. Two such groups are the
folks at CSFB Holt, and now just recently at
IronBridge Capital Management.
Bob Hendricks, the “H” in HOLT, taught
us much of what we know about valuing compa-
nies using economic or cash flow returns, rather
than misleading accounting data. As we extolled
before, “accounting data lies, the question is how
much, and secondly, accounting data lies differ-
ently for different companies.” Obviously, we
believe that relying on accounting data to evaluate
and select stocks is an exercise in delusion and
fraught with peril. In many ways, dividends,
because they’re paid in cash, serve as an excel-
lent proxy and a quick measure of cash flow in
the valuation of stocks.
Recently, we had the opportunity to chat
with Chris Faber, President and Chief Invest-
ment Officer of IronBridge Capital Management
a Chicago based asset manager with more than
$8 billion in assets under management. The
connection between HOLT and IronBridge is a
direct one as Chris worked at HOLT right out
of college in the 1980s just as HOLT was get-
ting going. Another HOLT alum is Sam Eddins,
who is IronBridge’s Director of Research.
After spending about 15 years at HOLT
telling investment managers like us how to use
the HOLT data to pick stocks, Chris, and Bob
Hendricks founded IronBridge to manage assets
utilizing the HOLT research. The success of
IronBridge speaks volumes about the validity of
the research and the talent and skill of Chris
Faber, Bob Hendricks and Sam Eddins.
In addition to the ground breaking work
on cash flow returns, HOLT had done extensive
research on the impact federal taxes have on
asset prices, particularly stock prices.
We take the time to note all of this in part,
to give credit where credit is due which is to the
original brain trust at HOLT but also to draw
your attention to an article Sam Eddins wrote in
2009 under the innocuous title: “Tax Arbitrage
Feedback Theory.”You can assess the article directly
at:http://ssrn.com/abstract=1356159
Quite simply, Sam argues that it was ill-
conceived U.S. federal tax policy (is there any
other kind?) going back more than 20 years that
was the direct cause of the global credit crisis.
Sam’s argument is based on the axiom that all
investors seek the highest, after-tax, rate of re-
turn when making investment decisions. Sam
explains, in plain English I might add, how the
different tax rates for different investor groups,
individuals, tax-exempt institutions, etc., produced
different incentives that contribute to instability
and boom/bust cycles in the economy and the
financial markets.
Sam’s work shows that one, if not the main
purpose, of debt securitization was tax minimiza-
tion. In other words, credit default swaps were
created simply to shift huge amounts of govern-
ment tax receipts to Wall Street bonus pools
through security losses (think Goldman Sachs)
which necessitated the creation of huge amounts
of low-quality debt designed to purposely go bad
to create losses, (think billions in bad mortgages.)
Sam notes, poignantly, that not a single dollar of
“credit default swaps” has ever been used for any
economic propose other than as a tax write-off.
We encourage anyone who wants to truly
understand the causes of the credit mess of the
last 20 years, to access the article and spend 15
minutes reading it. Just ignore the math and the
formulas. Those aren’t required reading and
weren’t meant for us mere intellectual mortals.
As always, thanks for reading. MJD
(Continued from page 4)
292%
214%
204%
75%
32%
8% 4%
0.00
0.10
0.20
0.30
0.40
0.50
0.60
0.70
0.80
0.90
1.00
1.10
1.20
1.30
1.40
1.50
1.60
1.70
1.80
1.90
2.00
2.10
2.20
2.30
0%
25%
50%
75%
100%
125%
150%
175%
200%
225%
250%
275%
300%
Dec‐79
Dec‐80
Dec‐81
Dec‐82
Dec‐83
Dec‐84
Dec‐85
Dec‐86
Dec‐87
Dec‐88
Dec‐89
Dec‐90
Dec‐91
Dec‐92
Dec‐93
Dec‐94
Dec‐95
Dec‐96
Dec‐97
Dec‐98
Dec‐99
Dec‐00
Dec‐01
Dec‐02
Dec‐03
Dec‐04
Dec‐05
Dec‐06
Dec‐07
Dec‐08
Dec‐09
OH MY-LANTA!
JNJ’S HISTORY OF SLOWLY MAKING
SHAREHOLDERS WEALTHY
By: Jason M. Loyd
Vice President & Portfolio Manager
JOHNSON & JOHNSON MAY SEEM out of
fashion in today’s frivolous, hyperactive,
and alpha starved investment environment;
but this $170 billion dollar health care and
personal product empire has been a wealth
creating, income producing, compounding
machine for well over a century.
The company was founded in 1886 by
Robert, James, and Ed Johnson. They had a
simple idea—yet utterly revolutionary for the
time—to create sterile dressings and ban-
dages. Obviously, their idea went over rather
well to the point where I couldn’t even con-
sider providing my kids with anything other
than the latest and greatest “Princess, or Buzz
Lightyear” “bandage.”
With over a hundred subsidiaries, John-
son & Johnson makes and markets thousands
of diverse health care and personal care prod-
ucts including such household medicine cabi-
net staples as Tylenol or Listerine. As well as
some of the world’s most sophisticated medi-
cal devices and diagnostic equipment.
Johnson & Johnson
A Dividend Growth Compounding Machine
JNJ has been paying a dividend since 1944 and
has increased it annually for over 47 years.
That’s as in 1963, when John F. Kennedy was
in the White House.(7) To put the power of
growing a dividend for such a long period of
time into perspective, if you invested $10,000
in JNJ back in 1970, you would’ve received
about $167 in dividends that year. If you then
held onto the stock all these years and rein-
vested all your dividends, you would now see
$138,000 in annual dividends hit your invest-
ment account each year. The annual dividend
having grown from $.01 a share to $2.16 a share
in that time or an annual growth rate of 14%
since 1970. Reinvesting all the dividends grow
total dividend income better than 18% a year.
Oh, by the way, the shares you would’ve
acquired along the way would now have a
market value in the neighborhood of $3.6 mil-
lion dollars as of September 30, 2010.
What Is “Yield on Cost”
We’ve held Johnson & Johnson in the EIP
Portfolio since March 2009. The only reason
we didn’t buy JNJ sooner was because the
stock was rarely cheap enough for us to justify
committing a significant amount of capital to
the company. For the record, we paid $52.62 a
share in March 2009, giving us a “yield on
cost” of 4.1% on our position.
So what’s “yield on cost?” As you can
imagine, it’s very much what is sounds like.
It’s the yield you’re earning on the stock based
on today’s annual dividend divided by what
you originally paid for the shares you own. In
the case of the EIP, we paid $52.62 for our
shares in March 2009. If we divided JNJ’s
current $2.16 annual dividend by our $52.62
per share cost, we get a “yield on cost” of 4.1%
on our JNJ shares.
Now a “yield on cost” of 4.1% may not
seem like a big deal, but what if we’ve bought
JNJ in January 1979 and held onto those
shares until now. JNJ’s 1979 year-end share
market price was—get this—$0.85 (as in cents)
after adjusting for three 2/1 splits along the
way. Now, if we divided JNJ’s current annual
$2.16 dividend by our 1979 cost and we get a
“yield on cost” of—drum roll please—254%. In
other words, for every share you might have
bought in 1979 at $0.85, you would now be
receiving $2.16 in annual dividends or more
than 2.5 times your initial investment—each
and every year— and growing to boot!
Going forward, you can be sure we do not
anticipate this kind of supercharged income
growth. However, our analysis indicates that
Johnson & Johnson should be able to continue
to generate positive cash flow from its stable
of products and continue to pay and increase
their dividends for years to come. As long as
that’s the case, and the price of the stock re-
mains reasonable by our valuation measures;
we’ll continue to utilize the dividend and divi-
dend growth attributes of JNJ to provide grow-
ing income to our clients.
Of course, we are always watching for
price drops allowing us to buy JNJ on the
cheap to augment the income growth process.
JML
Page 6 3rd Quarter 2010 Viewpoint
7) And Mark was a mere pup of seven years old. So that ought to give you a good idea of just how long ago 47 years is!
Ticker: JNJ
9/30/10 Price: $61.96
Current Dividend Yield: 3.5%
5-Year Dividend GR: 10.9%
40-Year Dividend GR: 19.0%
Year End “Yield on Cost” & Dollar Annual Dividend
December 1979 to 2010
Year End 2009 Viewpoint Page 7
QuarterlyReturns 3rd Qrt 2010
US MARKETS 11.63
GLOBAL EX-US 16.91
DEV MRKTS EX-US 16.78
EMERGING MRKTS 17.75
CORE BONDS 2.37
LT COMMODITY 12.14
Source: Morningstar Q210 Market Commentary
Market Summary 3rd Qrt 2010
EQUITY INCOME Portfolio
3nd Quarter 2010 Update
THE EQUITY INCOME Portfolio current
holdings as of September 30, 2010 are
shownon thetableto theleft.
The third quarter was quite a good one for
most equity investors. Investors actually invested
in equities that is. One of the notable stories of
2010 is the massive moveby investors into bonds
and bond funds of all types. For the last 30
months in a row, inflows into bond mutual funds
have topped flows into stock mutual funds. Un-
fortunately, like real estate speculators of the last
half of the decade and tech investors in the late
1990s, we think bond investors are in for a rude
awakening when rates start to tick up as they
surelywillsooner orlater.
DividendsKeepGrowing
Investors looking for income might gander at the
list of stocks to the left. Stocks are showing nice
income yields on growing dividends. Standard
and Poor’s reported that dividends showed a 6%
increase on average over the prior year period,
albeit the comparison is relative to a low quarter
fordividendsin the3rdquarter of2009.
The table to the left shows two columns
we’ve not shown before. The long term dividend
growth rate column is the annualized dividend
growth rate for each stock going back anywhere
from 3 to 20 years depending on the stock. Most
notably is the fact that the average dividend
increase for the stocks shown here is better than
17%annually.
The far right column shows the annual
return each of the stocks earned from dividends
“alone,” no capital returns factored in. Again, the
average annual return from just the dividend for
the group is a healthy 5.87%. How’s that for a
nice rate of return and from just part of the re-
turn equation. Compounding your money at just
shy of 6% while growing your annual income at a
healthy 17% from a diversified portfolio of quality
stocks. Now that sounds like a good strategy for
anystock market environment!
Note, past performance is not a guarantee of
future returns and all that.
Equity Income Portfolio Data Update  
Company  Symbol 
 Recent  
Price  
 Current  
Yield  
5‐Year  
Average 
Dividend Yield 
 Long‐term  
Dividend  
Growth Rate 
L‐T Annual  
Return from 
Dividend Only 
Abbott Laboratories  ABT  52.84  3.33  2.60  18.48  4.30 
Arthur J Gallagher & Co.  AJG  27.28  4.69  4.70  5.77  5.36 
AllianceBern Global High Inc  AWF  15.17  7.91  7.95  11.66  12.06 
B&G Foods, Inc.  BGS  11.14  6.10  5.10  9.10  6.67 
Black Hills Corporation  BKH  32.60  4.42  4.20  19.31  5.61 
Bristol‐Myers Squibb Co.  BMY  27.11  4.72  4.80  8.11  4.61 
Colgate‐Palmolive Co  CL  76.70  2.76  2.10  17.05  6.01 
Clorox Company  CLX  68.00  3.24  2.50  7.04  4.81 
ConocoPhillips  COP  61.12  3.60  2.70  11.83  3.72 
CPFL Energy Inc.  CPL  72.86  7.77  6.50  20.97  3.43 
CenturyLink, Inc.  CTL  40.47  7.17  4.00  10.11  4.73 
Chevron Corp  CVX  84.25  3.42  3.10  16.53  5.25 
Dominion Resources Inc.  D  44.74  4.09  3.80  15.01  4.24 
DuPont de Nemours & Co.  DD  47.13  3.48  3.90  14.61  4.92 
Diamond Offshore Drilling Inc.  DO  68.63  0.73  3.90  10.38  4.37 
ENI S.p.A.  E  45.26  5.67  4.70  0.90  5.61 
Consolidated Edison, Inc.  ED  48.88  4.87  5.10  20.51  13.76 
Elbit Systems Ltd.  ESLT  52.84  2.73  1.60  10.29  2.26 
Energy Transfer Partners LP  ETP  50.05  7.14  7.10  3.10  3.55 
EV Energy Partners, Units  EVEP  36.27  8.35  8.90  7.18  4.36 
Federated Investors Inc  FII  24.31  3.95  3.00  0.90  13.43 
Fifth Street Finance Corp.  FSC  11.40  13.30  8.75  11.95  3.91 
Frontier Communications Corp.  FTR  8.78  8.54  9.90  11.20  10.13 
Gladstone Investment Corp  GAIN  7.27  6.60  8.96  14.02  10.08 
General Mills Inc.  GIS  37.12  3.02  2.70  16.17  7.26 
Great Northern Iron Ore  GNI  120.50  12.45  8.90  28.07  4.41 
Genuine Parts Company  GPC  47.58  3.45  3.40  11.20  12.94 
Glaxo Smithkline ADS  GSK  40.50  4.52  4.00  12.25  7.29 
Health Care REIT Inc  HCN  50.88  5.42  5.80  9.02  3.74 
HCP, Inc.  HCP  37.18  5.00  5.80  12.41  4.04 
Coca‐Cola Company  KO  49.40  3.64  3.40  9.66  9.60 
H.J. Heinz Company  HNZ  63.99  3.38  2.60  35.12  5.81 
Johnson & Johnson  JNJ  31.82  3.65  3.60  15.24  2.73 
Kraft Foods Inc  KFT  66.86  3.95  3.40  10.48  10.38 
Kimberly‐Clark Corp.  KMB  61.47  2.86  2.80  12.44  3.83 
Leggett & Platt Inc.  LEG  22.99  4.70  4.10  9.66  7.51 
Linn Energy, LLC  LINE  32.57  7.74  6.50  11.88  5.17 
Eli Lilly & Co.  LLY  35.50  5.52  3.80  16.90  5.12 
Main Street Capital Corp  MAIN  16.69  8.99  8.70  14.11  3.98 
McDonald's Corp.  MCD  78.44  3.11  2.80  27.53  2.13 
Microchip Technology Inc  MCHP  30.68  4.47  3.30  20.03  6.48 
Mercury General Corp.  MCY  43.24  5.46  4.40  21.67  5.99 
Altria Group Inc  MO  24.95  6.09  6.80  65.65  7.21 
Middlesex Water Co.  MSEX  17.69  4.07  3.90  58.58  0.97 
MLP & Strategic Equity Fund  MTP  17.26  4.87  5.50  21.40  4.34 
Maxim Integrated Products  MXIM  19.08  4.40  2.60  27.82  4.22 
Norfolk Southern Corp  NSC  61.56  2.34  2.00  22.36  2.66 
Realty Income Corp  O  35.56  4.86  6.50  5.76  5.74 
Paychex, Inc.  PAYX  27.92  4.44  2.70  18.88  5.40 
Pitney Bowes Inc.  PBI  22.06  6.62  4.20  8.49  3.38 
Plum Creek Timber Co.  PCL  37.25  4.51  4.25  34.31  13.24 
PepsiCo, Inc.  PEP  65.18  2.95  2.30  19.45  3.50 
Procter & Gamble Co.  PG  63.51  3.03  2.50  48.32  3.61 
Progress Energy Inc  PGN  44.96  5.52  5.50  14.83  4.51 
Philip Morris Intl  PM  57.56  4.45  4.20  11.97  5.39 
Pinnacle West Capital  PNW  42.20  4.98  5.20  3.59  5.22 
Prospect Capital Corporation  PSEC  10.02  12.07  11.80  14.30  4.39 
QWest Communications  Q  6.43  4.98  3.30  9.18  3.77 
Reynolds American Inc  RAI  63.05  3.11  6.00  59.11  7.63 
Southern Company  SO  38.13  4.77  5.50  0.00  8.44 
Suburban Propane Partners LP  SPH  55.02  6.14  8.00  13.50  10.13 
AT&T Inc.  T  28.34  5.93  4.80  38.82  5.52 
Integrys Energy Group  TEG  53.35  5.10  5.20  6.05  7.29 
UIL Holdings Corp  UIL  28.40  6.08  5.40  7.71  7.48 
Unilever PLC ADR  UL  29.21  3.77  2.60  8.01  4.43 
Vector Group Ltd.  VGR  18.58  8.61  9.40  19.64  3.53 
Vectren Corporation  VVC  27.00  5.04  4.90  36.05  10.22 
Verizon Communications, Inc.  VZ  32.52  6.00  4.50  6.16  3.76 
Wayside Technology Group  WSTG  10.25  5.85  6.20  9.63  4.04 
Aqua America Inc  WTR  21.06  2.94  2.40  10.41  6.00 
World Wrestling Entertainment  WWE  13.89  10.37  7.90  51.12  5.38 
# of  
years of  
Data 
20 
17 
20 
20 
20 
20 
3 
20 
20 
20 
20 
20 
20 
20 
20 
12 
5 
13 
10 
20 
12 
20 
12 
14 
3 
12 
2 
6 
20 
20 
20 
4 
9 
20 
20 
20 
16 
20 
20 
9 
20 
4 
3 
8 
20 
14 
8 
20 
3 
20 
20 
20 
2 
17 
20 
11 
20 
10 
6 
2 
16 
6 
20 
14 
9 
11 
8 
10 
20 
7 
7 
Deschaine & Company, L.L.C.
Page 8 Deschaine & Company, L.L.C.
WorldHeadquarters
128 South Fairway Drive
Belleville, Illinois 62223
Phone: (618) 397-1002
MaryvilleOffice
(618) 288-2200
HighlandOffice
(618) 654-6262
PUBLISHER: MARK J. DESCHAINE EDITOR: JOHN H. DESCHAINE CONTRIBUTING EDITOR: TOM O’HARA STAFF CONTRIBUTORS: MATT POWERS, JASON LOYD COPY EDITOR: MARNIE E. DESCHAINE TECHNICAL ADVISOR: Joseph M. Deschaine. VIEWPOINT is a
complementary publication of Deschaine & Company, L.L.C. a registered investment advisor in Belleville, Illinois. This information has been prepared from sources deemed reliable, but its accuracy is not guaranteed. It should not be assumed that any
securities discussed will be profitable or will equal past performance, or is it an offer to buy or sell any security mentioned. Deschaine & Company and/or one or more of its clients, employees, family or friends may have a position in the securities dis-
cussed herein. © 2010. All rights reserved. Reproduction of this publication is strictly forbidden without written consent from Deschaine & Company. This issue was published on October 20, 2010. If you would like to receive a complementary copy each
quarterly, simply send us your address and the preferred method of delivery: snail-mail or email, to: 128 South Fairway Drive, Belleville, IL 62223 Or email us at mdeschaine@charter.net and we would be happy to add you to one of our mailing lists.
Deschaine&Company,L.L.C. Page 8
DEMYSTIFYING MUTUAL FUNDS
By: Matt Powers
Vice President & Portfolio Manager
EACH TIME WE PREPARE an article for
VIEWPOINT, it usually stems from a topic
we’ve received the most recent questions or
which topic we think is under-covered or not
openly discussed in polite company.
When it comes to compensating someone
for selling a mutual fund for example, it’s clear
that many investors are often caught by sur-
prise when the curtain is pulled back to reveal
the total costs they incur when buying them.
A mutual fund can be purchased in one of
two ways. 1) No-Load: Simply purchasing the
mutual fund without a commission.
Or, 2) with a Load: Which is usually
when a fund is purchased through a brokerage
firm. The load is the commission paid to the
broker or your financial advisor.
Over the years, mutual fund companies
have devised numerous and ingenious ways of
obscuring the load from investors. One way is
to break fund shares into different “classes” and
charge different fees depending on the class of
shares purchased. The three most common are
listed in the chart below.
Make no mistake, mutual fund companies
are in business to generate fees; there’s no free
lunch. Separate from the commissions and fees
a client pays the broker or advisor, is the ever
present mutual fund expenses known collec-
tively as the fund “expense ratio.” These are the
costs related to the investment management
and operating of the stock or bond fund. These
additional cost are deducted from your fund
and paid to the fund company. The average
stock fund’s annual expense ratio, for example
is somewhere in the neighborhood of 1.15% of
the fund’s total value. Remember, that is in
addition to the loads and 12b-1 fees you’re
charged just to buy the fund.
Mutual Fund Advisory
Accounts
Mutual fund advisory
accounts allow you to
purchase mutual funds
without a load or sales
charge through an advi-
sor, while paying an
annual advisory fee.
(We’ve seen this fee as high
as 1.75%!).
The “advisor” fee is
to compensate the advi-
sor for selecting the best
funds for the client, while at the same time
being charged an annual management fee by
the advisor, right?
While this is correct, let’ not forget about
what was left unstated in the previous para-
graph. The mutual fund company also has their
fund management fees and expenses. So, in
order to get an accurate tally on the total an-
nual cost an investor incurs to own a fund
through an advisor, the client will need to com-
bine the two ex-
penses (the advi-
sor’s fee for selecting
the funds, and the
mutual fund fees for
managing the fund)
in order to under-
stand their true
overall costs.
Here’s a typical
combined annual
advisory & mutual fund advisory account fee
example we’ve seen from a number of broker-
age and advisory firms over the years.
The bottom line is this. While we’re in a
low interest rate, highly volatile stock market
environment, fully understanding the costs
associated with your investments and your
managers is crucial. One of the reasons we
work to keep it simple in our fee and commis-
sion structure here at D&C, so you know ex-
actly what you are being charged.
To help better understand the expenses
involved with your mutual funds you can visit
FINRA’s mutual fund analyzer, which can be
found at: http://apps.finra.org/
fundanalyzer/1/fa.aspx. MTP
Fund Shares
Classes
Front Load
(commission)
Back End
Load
12b-1 fees
(ongoing
commission)
Class A
Usually 5.75% of
the purchase value None
.25%
annually
Class B None
Typically begins at
6% in year 1, and
reduces 1% each year
.25%
annually
Class C None None
1.0%
annually
Mutual Fund Share Class Loads
Fee For: Fee Rate
Advisory Fee 1.75%
Mutual Fund
Expense Ratio
1.15%
Total Annual
Account Expenses
2.90%
Combined Annual
Advisor & Mutual Fund Fees

Más contenido relacionado

La actualidad más candente

TaxCharit€TM 22apr16
TaxCharit€TM 22apr16TaxCharit€TM 22apr16
TaxCharit€TM 22apr16Hans Goetze
 
BookBuilderTM 30oct15
BookBuilderTM 30oct15BookBuilderTM 30oct15
BookBuilderTM 30oct15Hans Goetze
 
BookBuilderTM is yours to keep it yours 30nov13
BookBuilderTM is yours to keep it yours 30nov13BookBuilderTM is yours to keep it yours 30nov13
BookBuilderTM is yours to keep it yours 30nov13Hans Goetze
 
Book buildertm 31dec15
Book buildertm 31dec15Book buildertm 31dec15
Book buildertm 31dec15Hans Goetze
 
Book buildertm 30sep15
Book buildertm 30sep15Book buildertm 30sep15
Book buildertm 30sep15Hans Goetze
 
How to-invest-in-the-philippine-market-for-newbies 1-
How to-invest-in-the-philippine-market-for-newbies  1-How to-invest-in-the-philippine-market-for-newbies  1-
How to-invest-in-the-philippine-market-for-newbies 1-tarpmike
 
BookBuilderTM 30apr14
BookBuilderTM 30apr14BookBuilderTM 30apr14
BookBuilderTM 30apr14Hans Goetze
 
BookBuilderTM 31jul14
BookBuilderTM 31jul14BookBuilderTM 31jul14
BookBuilderTM 31jul14Hans Goetze
 
BookBuilderTM 30nov16
BookBuilderTM 30nov16BookBuilderTM 30nov16
BookBuilderTM 30nov16Hans Goetze
 
BookBuilderTM 30sep16
BookBuilderTM 30sep16BookBuilderTM 30sep16
BookBuilderTM 30sep16Hans Goetze
 
BookBuilderTM 31oct16
BookBuilderTM 31oct16BookBuilderTM 31oct16
BookBuilderTM 31oct16Hans Goetze
 
Quarterly report for our investors - Second Quarter 2019
Quarterly report for our investors - Second Quarter 2019Quarterly report for our investors - Second Quarter 2019
Quarterly report for our investors - Second Quarter 2019BESTINVER
 
BookBuilderTM 31may15
BookBuilderTM 31may15BookBuilderTM 31may15
BookBuilderTM 31may15Hans Goetze
 
Commodity Futures Trading For Beginners
Commodity Futures Trading For BeginnersCommodity Futures Trading For Beginners
Commodity Futures Trading For BeginnersJawad Hussain Juddy
 
BookBuilderTM 30jun14
BookBuilderTM 30jun14BookBuilderTM 30jun14
BookBuilderTM 30jun14Hans Goetze
 
TaxCharitytm 15mar2015
TaxCharitytm 15mar2015TaxCharitytm 15mar2015
TaxCharitytm 15mar2015Hans Goetze
 
BookBuildeTM keeping it yours 31mar14
BookBuildeTM keeping it yours   31mar14BookBuildeTM keeping it yours   31mar14
BookBuildeTM keeping it yours 31mar14Hans Goetze
 
BookBuilderTM 31aug15
BookBuilderTM 31aug15BookBuilderTM 31aug15
BookBuilderTM 31aug15Hans Goetze
 
Master-Investor-Magazine-18-low-res
Master-Investor-Magazine-18-low-resMaster-Investor-Magazine-18-low-res
Master-Investor-Magazine-18-low-resFrankie Mendoza
 
BookBuilderTM 31jul16
BookBuilderTM 31jul16BookBuilderTM 31jul16
BookBuilderTM 31jul16Hans Goetze
 

La actualidad más candente (20)

TaxCharit€TM 22apr16
TaxCharit€TM 22apr16TaxCharit€TM 22apr16
TaxCharit€TM 22apr16
 
BookBuilderTM 30oct15
BookBuilderTM 30oct15BookBuilderTM 30oct15
BookBuilderTM 30oct15
 
BookBuilderTM is yours to keep it yours 30nov13
BookBuilderTM is yours to keep it yours 30nov13BookBuilderTM is yours to keep it yours 30nov13
BookBuilderTM is yours to keep it yours 30nov13
 
Book buildertm 31dec15
Book buildertm 31dec15Book buildertm 31dec15
Book buildertm 31dec15
 
Book buildertm 30sep15
Book buildertm 30sep15Book buildertm 30sep15
Book buildertm 30sep15
 
How to-invest-in-the-philippine-market-for-newbies 1-
How to-invest-in-the-philippine-market-for-newbies  1-How to-invest-in-the-philippine-market-for-newbies  1-
How to-invest-in-the-philippine-market-for-newbies 1-
 
BookBuilderTM 30apr14
BookBuilderTM 30apr14BookBuilderTM 30apr14
BookBuilderTM 30apr14
 
BookBuilderTM 31jul14
BookBuilderTM 31jul14BookBuilderTM 31jul14
BookBuilderTM 31jul14
 
BookBuilderTM 30nov16
BookBuilderTM 30nov16BookBuilderTM 30nov16
BookBuilderTM 30nov16
 
BookBuilderTM 30sep16
BookBuilderTM 30sep16BookBuilderTM 30sep16
BookBuilderTM 30sep16
 
BookBuilderTM 31oct16
BookBuilderTM 31oct16BookBuilderTM 31oct16
BookBuilderTM 31oct16
 
Quarterly report for our investors - Second Quarter 2019
Quarterly report for our investors - Second Quarter 2019Quarterly report for our investors - Second Quarter 2019
Quarterly report for our investors - Second Quarter 2019
 
BookBuilderTM 31may15
BookBuilderTM 31may15BookBuilderTM 31may15
BookBuilderTM 31may15
 
Commodity Futures Trading For Beginners
Commodity Futures Trading For BeginnersCommodity Futures Trading For Beginners
Commodity Futures Trading For Beginners
 
BookBuilderTM 30jun14
BookBuilderTM 30jun14BookBuilderTM 30jun14
BookBuilderTM 30jun14
 
TaxCharitytm 15mar2015
TaxCharitytm 15mar2015TaxCharitytm 15mar2015
TaxCharitytm 15mar2015
 
BookBuildeTM keeping it yours 31mar14
BookBuildeTM keeping it yours   31mar14BookBuildeTM keeping it yours   31mar14
BookBuildeTM keeping it yours 31mar14
 
BookBuilderTM 31aug15
BookBuilderTM 31aug15BookBuilderTM 31aug15
BookBuilderTM 31aug15
 
Master-Investor-Magazine-18-low-res
Master-Investor-Magazine-18-low-resMaster-Investor-Magazine-18-low-res
Master-Investor-Magazine-18-low-res
 
BookBuilderTM 31jul16
BookBuilderTM 31jul16BookBuilderTM 31jul16
BookBuilderTM 31jul16
 

Destacado

Short Version Making Money In A Lt Bear Market
Short Version Making Money In A Lt Bear MarketShort Version Making Money In A Lt Bear Market
Short Version Making Money In A Lt Bear Marketmjdeschaine
 
2nd Qrt 2010 8 Page Final
2nd Qrt 2010 8 Page Final2nd Qrt 2010 8 Page Final
2nd Qrt 2010 8 Page Finalmjdeschaine
 
Economic Concerns Slide Show 2 09
Economic Concerns Slide Show 2 09Economic Concerns Slide Show 2 09
Economic Concerns Slide Show 2 09mjdeschaine
 
YE 2008 Special Veiwpoint Insert
YE 2008 Special Veiwpoint InsertYE 2008 Special Veiwpoint Insert
YE 2008 Special Veiwpoint Insertmjdeschaine
 
Year End 2009 Viewpoint
Year End 2009 ViewpointYear End 2009 Viewpoint
Year End 2009 Viewpointmjdeschaine
 
Current Master Material Sept 30, 2009
Current Master Material   Sept 30, 2009Current Master Material   Sept 30, 2009
Current Master Material Sept 30, 2009mjdeschaine
 
4th Qrt 2010 8 Page Final
4th Qrt 2010 8 Page Final4th Qrt 2010 8 Page Final
4th Qrt 2010 8 Page Finalmjdeschaine
 
Year end 2011 12 page final
Year end 2011 12 page finalYear end 2011 12 page final
Year end 2011 12 page finalmjdeschaine
 
Ye 2008 8 Page Print Final
Ye 2008 8 Page Print FinalYe 2008 8 Page Print Final
Ye 2008 8 Page Print Finalmjdeschaine
 

Destacado (9)

Short Version Making Money In A Lt Bear Market
Short Version Making Money In A Lt Bear MarketShort Version Making Money In A Lt Bear Market
Short Version Making Money In A Lt Bear Market
 
2nd Qrt 2010 8 Page Final
2nd Qrt 2010 8 Page Final2nd Qrt 2010 8 Page Final
2nd Qrt 2010 8 Page Final
 
Economic Concerns Slide Show 2 09
Economic Concerns Slide Show 2 09Economic Concerns Slide Show 2 09
Economic Concerns Slide Show 2 09
 
YE 2008 Special Veiwpoint Insert
YE 2008 Special Veiwpoint InsertYE 2008 Special Veiwpoint Insert
YE 2008 Special Veiwpoint Insert
 
Year End 2009 Viewpoint
Year End 2009 ViewpointYear End 2009 Viewpoint
Year End 2009 Viewpoint
 
Current Master Material Sept 30, 2009
Current Master Material   Sept 30, 2009Current Master Material   Sept 30, 2009
Current Master Material Sept 30, 2009
 
4th Qrt 2010 8 Page Final
4th Qrt 2010 8 Page Final4th Qrt 2010 8 Page Final
4th Qrt 2010 8 Page Final
 
Year end 2011 12 page final
Year end 2011 12 page finalYear end 2011 12 page final
Year end 2011 12 page final
 
Ye 2008 8 Page Print Final
Ye 2008 8 Page Print FinalYe 2008 8 Page Print Final
Ye 2008 8 Page Print Final
 

Similar a 3rd Qrt 2010 8 Page

Secrets to Smart trading with Binary.com
Secrets to Smart trading with Binary.comSecrets to Smart trading with Binary.com
Secrets to Smart trading with Binary.comVince Stanzione
 
SAVA Сapital Inc Philosophy.pdf
SAVA Сapital Inc Philosophy.pdfSAVA Сapital Inc Philosophy.pdf
SAVA Сapital Inc Philosophy.pdfAlekseyKuchin3
 
Little book of investing.pdf
Little book of investing.pdfLittle book of investing.pdf
Little book of investing.pdfSumni Uchiha
 
Introduction to Investing 07-05-2015
Introduction to Investing 07-05-2015Introduction to Investing 07-05-2015
Introduction to Investing 07-05-2015Richard Myden
 
Introduction to Investing
Introduction to InvestingIntroduction to Investing
Introduction to InvestingAdam Humphries
 
Introduction to Investing 07-05-2015
Introduction to Investing 07-05-2015Introduction to Investing 07-05-2015
Introduction to Investing 07-05-2015Ruben Gonzales
 
Introduction to Investing - Infinity
Introduction to Investing - InfinityIntroduction to Investing - Infinity
Introduction to Investing - InfinityDupré Quentin
 
Jeff saut-secular-bull-market
Jeff saut-secular-bull-marketJeff saut-secular-bull-market
Jeff saut-secular-bull-marketFrank Ragol
 
Katalyst wealth a guide to grow your wealth by 190 times
Katalyst wealth   a guide to grow your wealth by 190 timesKatalyst wealth   a guide to grow your wealth by 190 times
Katalyst wealth a guide to grow your wealth by 190 timesKatalyst Wealth
 
TaxCharitEtm 23feb16
TaxCharitEtm 23feb16TaxCharitEtm 23feb16
TaxCharitEtm 23feb16Hans Goetze
 
How to Make Money Investing in Stocks in Any Market.pdf
How to Make Money Investing in Stocks in Any Market.pdfHow to Make Money Investing in Stocks in Any Market.pdf
How to Make Money Investing in Stocks in Any Market.pdfMuhammad Waqas
 
Definition of a stock
Definition of a stockDefinition of a stock
Definition of a stocklabibmouri
 
TaxCharit€tm 22jun16
TaxCharit€tm 22jun16TaxCharit€tm 22jun16
TaxCharit€tm 22jun16Hans Goetze
 
Stocks GUIDE.pdf
Stocks GUIDE.pdfStocks GUIDE.pdf
Stocks GUIDE.pdfSonamGulzar
 

Similar a 3rd Qrt 2010 8 Page (20)

The Stock Market Essay
The Stock Market EssayThe Stock Market Essay
The Stock Market Essay
 
Financial Synergies | Q3 2018 Newsletter
Financial Synergies | Q3 2018 NewsletterFinancial Synergies | Q3 2018 Newsletter
Financial Synergies | Q3 2018 Newsletter
 
Secrets to Smart trading with Binary.com
Secrets to Smart trading with Binary.comSecrets to Smart trading with Binary.com
Secrets to Smart trading with Binary.com
 
SAVA Сapital Inc Philosophy.pdf
SAVA Сapital Inc Philosophy.pdfSAVA Сapital Inc Philosophy.pdf
SAVA Сapital Inc Philosophy.pdf
 
Little book of investing.pdf
Little book of investing.pdfLittle book of investing.pdf
Little book of investing.pdf
 
Introduction to Investing 07-05-2015
Introduction to Investing 07-05-2015Introduction to Investing 07-05-2015
Introduction to Investing 07-05-2015
 
Introduction to Investing
Introduction to InvestingIntroduction to Investing
Introduction to Investing
 
Introduction to Investing 07-05-2015
Introduction to Investing 07-05-2015Introduction to Investing 07-05-2015
Introduction to Investing 07-05-2015
 
Introduction to Investing - Infinity
Introduction to Investing - InfinityIntroduction to Investing - Infinity
Introduction to Investing - Infinity
 
Ninja trading system
Ninja trading systemNinja trading system
Ninja trading system
 
Jeff saut-secular-bull-market
Jeff saut-secular-bull-marketJeff saut-secular-bull-market
Jeff saut-secular-bull-market
 
Katalyst wealth a guide to grow your wealth by 190 times
Katalyst wealth   a guide to grow your wealth by 190 timesKatalyst wealth   a guide to grow your wealth by 190 times
Katalyst wealth a guide to grow your wealth by 190 times
 
TaxCharitEtm 23feb16
TaxCharitEtm 23feb16TaxCharitEtm 23feb16
TaxCharitEtm 23feb16
 
How to Make Money Investing in Stocks in Any Market.pdf
How to Make Money Investing in Stocks in Any Market.pdfHow to Make Money Investing in Stocks in Any Market.pdf
How to Make Money Investing in Stocks in Any Market.pdf
 
Design build-protect-clients (notes)
Design build-protect-clients (notes)Design build-protect-clients (notes)
Design build-protect-clients (notes)
 
Definition of a stock
Definition of a stockDefinition of a stock
Definition of a stock
 
Stock-Market-Essay
Stock-Market-EssayStock-Market-Essay
Stock-Market-Essay
 
TaxCharit€tm 22jun16
TaxCharit€tm 22jun16TaxCharit€tm 22jun16
TaxCharit€tm 22jun16
 
Stocks GUIDE.pdf
Stocks GUIDE.pdfStocks GUIDE.pdf
Stocks GUIDE.pdf
 
2015.10 IceCap Global Market Outlook
2015.10 IceCap Global Market Outlook2015.10 IceCap Global Market Outlook
2015.10 IceCap Global Market Outlook
 

3rd Qrt 2010 8 Page

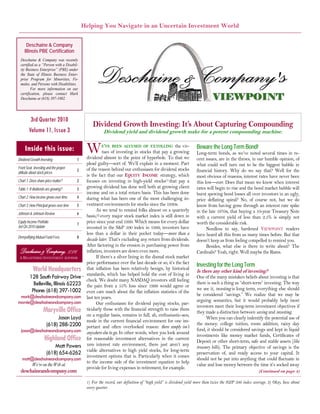
  • 1. WE’VE BEEN ACCUSED OF EXTOLLING the vir- tues of investing in stocks that pay a growing dividend almost to the point of hyperbole. To that we plead guilty—sort of. We’ll explain in a moment. Part of the reason behind our enthusiasm for dividend stocks is the fact that our EQUITY INCOME strategy, which focuses on investing in high-yield stocks(1) that pay a growing dividend has done well both at growing client income and on a total return basis. This has been done during what has been one of the most challenging in- vestment environments for stocks since the 1930s. As we tend to remind folks almost on a quarterly basis,(2) every major stock market index is still down in price since year end 1999. Which means for every dollar invested in the S&P 500 index in 1999, investors have less than a dollar in their pocket today—more than a decade later. That’s excluding any return from dividends. After factoring in the erosion in purchasing power from inflation, investors are down even more. If there’s a silver lining in the dismal stock market price performance over the last decade or so, it’s the fact that inflation has been relatively benign, by historical standards, which has helped hold the cost of living in check. We doubt many NASDAQ investors still feeling the pain from a 55% loss since 1999 would agree or even care much about the flat inflation statistics of the last ten years. Our enthusiasm for dividend paying stocks, par- ticularly those with the financial strength to raise them on a regular basis, remains in full, ah, enthusiastic-ness, mode in the current financial environment for one im- portant and often overlooked reason: there simply isn’t anywhere else to go. In other words, when you look around for reasonable investment alternatives in the current zero interest rate environment, there just aren’t any viable alternatives to high yield stocks, for long-term investment options that is. Particularly when it comes to the income side of the investment equation to help provide for living expenses in retirement, for example. Beware the Long Term Bond! Long-term bonds, as we’ve noted several times in re- cent issues, are in the throes, in our humble opinion, of what could well turn out to be the biggest bubble in financial history. Why do we say that? Well for the most obvious of reasons; interest rates have never been this low—ever. Does that mean we know when interest rates will begin to rise and the bond market bubble will burst spewing bond losses all over investors in an ugly, price deflating spiral? No, of course not, but we do know from having gone through an interest rate spike in the late 1970s, that buying a 10-year Treasury Note with a current yield of less than 2.5% is simply not worth the considerable risk. Needless to say, hardened VIEWPOINT readers have heard all this from us many times before. But that doesn’t keep us from feeling compelled to remind you. Besides, what else is there to write about? The Cardinals? Yeah, right. Well maybe the Rams. Investing for the Long Term Is there any other kind of investing? One of the many mistaken beliefs about investing is that there is such a thing as “short-term” investing. The way we see it, investing is long term, everything else should be considered “savings.” We realize that we may be arguing semantics, but it would probably help most investors meet their long-term investment objectives if they made a distinction between saving and investing. When you can clearly indentify the potential use of the money: college tuition, room addition, rainy day fund, it should be considered savings and kept in liquid investments like money market funds, Certificates of Deposit or other short-term, safe and stable assets (like treasury bills). The primary objective of savings is the preservation of, and ready access to your capital. It should not be put into anything that could fluctuate in value and lose money between the time it’s socked away (Continued on page 4) 3rd Quarter 2010 Volume 11, Issue 3 Helping You Navigate in an Uncertain Investment World Inside this issue: Dividend Growth Investing 1 Front Seat, Investing and the proper attitude about stock prices 2 Chart 1: Does share price matter? 2 Table 1: If dividends are growing? 3 Chart 2: How income grows over time. 4 Demystifying Mutual Fund Fees 8 Chart 3: How Principal grows over time 5 Johnson & Johnson Review 6 Equity Income Portfolio 3rd Qrt 2010 Update 7 1) For the record, our definition of “high yield” is dividend yield more than twice the S&P 500 index average. 2) Okay, how about every quarter. Dividend Growth Investing: It’s About Capturing Compounding Dividend yield and dividend growth make for a potent compounding machine. Deschaine & Company is an SEC registered investment advisor, managing approxi- mately $70 million for pensions, endowments, and individuals. WorldHeadquarters 128 South Fairway Drive Belleville, Illinois 62223 Phone: (618) 397-1002 mark@deschaineandcompany.com marnie@deschaineandcompany.com MaryvilleOffice Jason Loyd (618) 288-2200 jason@deschaineandcompany.com HighlandOffice Matt Powers (618) 654-6262 matt@deschaineandcompany.com We’re on the Web at: deschaineandcompany.com Deschaine&Company,L.L.C. A REGISTERED INVESTMENT ADVISOR Deschaine & Company Illinois PBE Certification Deschaine & Company was recently certified as a “Person with a Disabil- ity Business Enterprise” (PBE) under the State of Illinois Business Enter- prise Program for Minorities, Fe- males, and Persons with Disabilities. For more information on our certification, please contact Mark Deschaine at (618) 397-1002.
  • 2. Page 2 “Another word for Volatility is “Opportunity” (3) -- Mark Deschaine, President & Chief Investment Officer AFTER MORE THAN 30 YEARS in the investment manage- ment business and many hundreds, if not thousands of conversations with investors of all stripes, sizes and sophistica- tion, I’m convinced that prices are at the heart of their conster- nation with the stock market. Actually, I should clarify my previous statement, I’m convinced it’s the propensity for stock prices to “fluctuate” that’s at the heart of most investors anxi- ety with investing in stocks. They don’t like it when stock prices fluctuate, although mostly they don’t like it when prices go down. Higher prices they’re okay with, (funny how, I never hear anyone complain about “volatility” on the upside) as rising stock prices tend to have a peculiarly soothing effect on many an inves- tor’s psyche. Unfortunately, that’s not the proper way to view prices or the stock market—at least not if you have any expecta- tions of making money consistently from invest- ing in stocks. In fact, it’s the exact opposite way to view stock prices and the place one goes to buy shares of your favorite company, otherwise referred to as, well, the stock “market.” When you think about it, the stock market is certainly appropriately named. The stock market is just that, a “market,” for stocks. It’s nothing more than a conveniently organized place where investors can go to buy, ah well, stocks. What else should we call it? Yet, the fact that share prices of the thou- sands of stocks traded on the stock market fluctuate endlessly is without question in my mind, the reason most investors do not do well investing in stocks. It’s fear driven by fluctuating prices that makes investors do crazy, self-defeating things. For all practical purposes, the stock market operates just like your local Wal-Mart store. Again, if you stop and think about it, Wal-Mart is a conveniently organized place where shoppers can go to buy everything on the planet, ironically, except publically traded stocks. But hey, give Wal-Mart time and maybe soon you’ll be able to throw a couple of hundred shares of your favorite stock into your shopping cart right next to motor oil, fresh strawberries and that 46 inch flat-screen television. The point is that the stock market is viewed by most investors with fear and loathing primarily because prices fluctuate. Shoppers would probably view Wal- Mart with fear and loathing too if they published the daily price changes on the merchandise they sell in their stores in the Wall Street Journal every morning. Why I can even hear the nightly news now: “dish-washing liquid plunged 12% today as the cleaning supplies department dropped the price by seventy five cents a bottle. Shoppers withdrew buying in anticipation of further price drops.” Obviously, I’m trying (somewhat ineptly?) to use the Wal- Mart analogy to make a point about the stock prices. But the analogy is right on point. The stock market is just that, a “market” of stocks. The stock “market” is open from 9:30 a.m. to 4:00 p.m. eastern stan- dard time, Monday through Friday, except national holidays. And that’s exactly how investors should view the stock “market,” as nothing more than a large, New York based, super-market for buying (and of course selling) your favorite snacks, oops, I meant “stocks.” Smartbuyers,nomatterwhat they’rebuying,wantlowerprices That brings me to my next point about investing in the stock market. And I’ll confess, this is a point I tend to make rather frequently, so don’t be surprised if you’ve heard it be- fore. (But then let’s be honest, when all one does all day is talk, think and write about one subject, and that is—repeat after me—“making money in the stock market,” one is going to naturally have a tendency to repeat oneself, over and over again repeatedly. Anyway, but I digress, as I often do in these pages.) Back to my next point about investing in the stock market and it’s this: the objective of investing is to accumulate the largest pile of shares of stock, (of one company or multiple compa- nies) as we possibly can. Now, as you know, I don’t profess to be a math whiz, but I’m pretty certain that it’s better to accu- mulate 10,000 shares of Johnson & Johnson than it is to accu- mulate 1,000 shares and accumulating 100,000 shares of JNJ is even better yet. (See Jason’s write up on JNJ on page 6.) I realize I run the risk of insulting the intelligence of our sophisticated and knowledgeable readership when I use rather simplistic examples, but I’ve found over the years, that invest- ing really is that simple (and are most successful) when we stick (Continued on page 3) 3rd Quarter 2010 Viewpoint 3) Notice, I’m quoting myself now, neat huh? VIEW FROM THE FRONT SEAT by Mark J. Deschaine Investing Success Comes from having the proper attitude about prices! $0.54  $3.42  $10.00 $2.92 $32.25 $‐ $0.50  $1.00  $1.50  $2.00  $2.50  $3.00  $3.50  $- $5.00 $10.00 $15.00 $20.00 $25.00 $30.00 $35.00 1 2 3 4 5 6 7 8 9 10 11 12 13 14 15 16 17 18 19 20 21 22 23 24 25 Chart 1: Does Share Price Even Matter? Dividend growing at 8% a year. Stock price going up at 5% a year. Stock price stays flat Stock price goes down at 5% a year. If your dividend’s going up and you want to buy more shares, should you care about stock prices. Yes! You should want them to go down!
  • 3. Deschaine & Company, L.L.C. to the basics. It’s when we lose sight of the most basic objectives--like accumulat- ing lots of shares--that we tend to under- mine our own long-term investment ob- jectives. That once again brings me back to prices. If our primary investment objec- tive is to accumulate as many shares of our favorite high-yield stocks as possible, the best way to do that is for stock prices to go down. Or barring a steady decline, at least not have stock prices go up a lot. What’s that you say? Declining stock prices are good? What are you some kind of anti- capitalist? Geez, everybody— even rookie investors know that bull markets are good and bear markets are bad. Talk about not understand- ing one of the most basis in- vestment tenets. In the “Front Seat” column in this year’s 1st quarter issue, I used the price analogy of a Corvette for sale on my lawn to make the point about how most folks tend to view prices differently when it comes to stocks. I included three scenar- ios of stock prices over a 20-year period. One included stocks dropping in half over the first ten years, a second where prices stayed flat and three, where prices double over the 2o-year period. The totals after 20 years for both annual dividend income and portfolio values confirmed that a share price that drops over the first ten years (before doubling) allows an investor the ability to accumulate the largest num- ber of shares for every dollar invested. When combined with a growing dividend, the compounding effect can be amazingly powerful. I think intuitively every investor knows that when buying stocks we want to pay the cheapest price possible. It’s just hard to implement in real life when share prices drop. A longer look at prices This time I’m going to extend the three pricing examples to 25 years and have the stock price either rise every year for 25 years by 5% a year, have the share price remain flat for 25 years or the price de- cline by 5% a year for the 25 year period. The chart on page 2 depicts the three scenarios. In each of the three scenarios, the dividend increases by 8% per year over the 25 year period, which is a reason- able dividend growth assumption. The question we’ve asked before in these pages is this: if you’ve got money to invest from dividends and interest income or from new contributions and savings; would you rather have stock prices go up, stay flat, or go down? The answer when investing $1 million in a stock with a divi- dend that grows at 8% per year over a 25 year period is shown in table 1, below. No, the numbers in column 3, (in red) are not typos nor are they incorrect. I’ve double and triple checked them. Just to be clear, a rising dividend combined with a declining stock price is the ideal invest- ment environment for accumulating stocks, growing income, and getting rich! Lucky for us investors in buying mode, we’re in such an environment to- day, as many stocks are flat or have even declined significantly since the stock mar- ket peaked in March 2000. What’s notable about each of the three scenarios is that when investing in a stock with a yield of 5% and a dividend that’s growing at 8% a year, your total returns (while they will vary greatly depend- ing on what the stock price actually does) are all exceptionally good compared to his- torical stock market returns. For example, the worst outcome is when the stock price goes up 5% a year.(4) Under that scenario, you’re forced to chase higher prices. As a result, you’re not able to buy as many shares with your divi- dends. Yet the 12.30% annual com- pounded return earned over 25 years in a rising market environment still signifi- cantly exceeds the long-term stock mar- ket returns which are somewhere in the 9% neighborhood historically. Such splendid results begs the ques- tion; why aren’t more investors realizing such returns? And the answer is; for a host of reasons. Not the least of which is that over the years, investors have given little credence to the combined com- pounding power of dividend yield and divi- dend growth. And, as we mentioned ear- lier, investors are usually scared out of buying more shares when prices drop— which is the exact opposite of what inves- tors should be doing. Those two reasons alone account for most of why investors don’t achieve investment returns any- where near the ones shown here. One important point in case you missed it. When it comes to reinvesting dividends that grow at a healthy rate over a long period of time, share price means almost nothing. At the end of the day, whether the stock market goes up, stays flat, or goes down while we’re buying stocks will obviously determine our an- nual investment returns, but it really only means the difference between earning 12%, or 14%. Or in the case of a steadily declining stock market, some magical compounding number like 25%! So why sweat stock prices? Better yet, if your dividend income exceeds your income needs, why sweat the stock market at all? In fact, if you’ve got extra income to reinvest, you ought to be rooting for prices to go down—not up! Now, admittedly, my reasoning could be rendered kaput if you’re forced to sell off a sizable chunk of your portfolio to fund some unforeseen emergency, but except for something like that, which by definition you can’t foresee anyway, you shouldn’t care what the stock market does from day to day, week to week or month to month, other than to bargain hunt for higher yields. One final point about the stock mar- ket, prices and dividend income. If your portfolio is producing a growing income stream from growing dividends, year in and year out, and you’re regularly rein- vesting your dividends, you win no mat- ter what prices do. If prices go up, you win with higher portfolio value, if prices stay flat you’re able to buy shares at a reasonable price. If they go down? You get rich that much faster. Now do you view stock prices differently? (Front Seat, continued from page 2) 4) Yes, you read that correctly, the worst case scenario is when the share price in my example goes up 5% a year. What a whacky concept! The more we’ve explored the process of building wealth, the more we’ve come to realize that a rising stock market is the enemy of investors looking to grow income and build wealth. Unfortunately, we, like every other investor on the planet have been subjected to the endless onslaught of capital returns and the desire to get rich from latching onto a Microsoft, Wal-Mart (or now Apple?) and watch it grow 10 fold in market value. The problem with that strategy is that it is simply extremely rare and next to impossible to find early enough in its growth cycle for an investor to catch a meaningful part of the ride up. Dividends win through relentless slow growth. Page 3 Table 1. If your dividends are growing, do you really want stock prices to go up? Not if you reinvesting them! 1) Stock price goes up by 5% a year Annual Growth Rate 2) Stock price unchanged Annual Growth Rate 3) Stock price drops by 5% per year Annual Growth Rate Annual Dividend income in year 25 $1,627,617 14.9% $6,915,014 21.8% $148,900,335 37.7% Position Market Value in year 25 $18,183,615 12.3% $28,724,878 14.4% $286,027,048 25.1% The results of a $1 million dollars invested in a stock with a 5% dividend yield with a dividend that grows at 8% annually for 25 years. Under three share price scenarios: a 5% rising price, a flat price, and a share price that declines 5% a year for 25 years. We’re always happy to send the data behind the numbers. Just let us know.
  • 4. $6,915,014 $161,255 $1,344,412 $19,863,269 $- $1,000,000 $2,000,000 $3,000,000 $4,000,000 $5,000,000 $6,000,000 $7,000,000 $8,000,000 $9,000,000 $10,000,000 $11,000,000 $12,000,000 $13,000,000 $14,000,000 $15,000,000 $16,000,000 $17,000,000 $18,000,000 $19,000,000 $20,000,000 $21,000,000 $22,000,000 1 2 3 4 5 6 7 8 9 10 11 12 13 14 15 16 17 18 19 20 21 22 23 24 25 3rd Quarter 2010 ViewpointPage 4 5) We’re realize we’re talking about investing $1,000,000, but if we can’t visualize our portfolio at that level, how can we make it happen. Chart 2: How Income Grows over time. Compounding $1,000,000 at 5% Compounding $1,000,000 at 5% with a 5% annual growth in income. Compounding $1,000,000 at 5% with an 8% annual growth in income. Compounding $1,000,000 at 5% with an 8% annual growth in income plus $100,000 a year in new savings/contributions All income reinvested over 25 years. Chart Deschaine & Company Research© and the time you expect to need the money. Par- ticularly in the current investment and economic environment where capital seems more at risk than ever. Earning an acceptable return on your savings in today’s world is a challenge, but you should not lose sight of your primary object of cash, which is preserving principal in the pursuit of a little extra (in today’s interest rate environment, very little extra) return. You just have to get it in your head that the trade-off between risk and reward in today’s interest rate environment is too great to risk the capital for any modest incre- mental return. It’s just not worth it, period! “There seems to be some perverse human characteristic that likes to make easy things difficult.” –Warren Buffett When it comes to investing, we like to stress the basics and nothing gets more basic than com- pounding. Charlie Munger, Vice Chairman of Berkshire Hathaway, says that truly understand- ing compounding and the difficulty in getting it consistently is the root to understanding invest- ing. We concur. We’ll even go one step further and suggest that having faith in the power of money to compound over time is the very foun- dation for investing in dividend stocks. We recently created a series of charts and examples in an effort to illustrate the power of compounding, particularly the power dividend growth too, as we like to say, “turbo charge” returns over time. The first thing you need to know about the outcomes shown in the charts discussed here is the returns do not take into account any return from stock price change. That is, we assume stock prices do not change. Instead, we make the assumption that each account grows from simply piling up dividend income that’s reinvested back into the account. The portfolios build “at cost,” like a savings account where the interest earned simply accumulates in the account over time. The value of the portfolio doesn’t change from any change in price like a share of stock. Of course, this assumption cuts both ways as a port- folio would benefit if it were invested in stocks and share prices double. Yet, as we show in the front seat column, the portfolio would also bene- fit more if share prices dropped over time so we could buy more dividend producing shares at cheaper and cheaper prices. Dividend Growth, The Real Compounding Wonder Let’s start with the most basic compounding example, a bank certificate of deposit account. Let’s say you stopped into your local bank and your friendly banker offers to sell you a $1,000,000 Certificate of Deposit with an annual interest rate of 5%.(5) A bit unrealistic in today’s interest rate environment we’ll admit, but hey, play along. The catch is that you have to keep the money and all the interest earned in the bank for 25 years to allow for compounding. After 25 years, earning a positive 5% a year, your account would grow to $3,386,355 dollars and would be generating $161,255, in annual income in year 25. Not too awful bad, or as the sayinggoes,“It surebeats a sharp stickin theeye.” The outcome is the direct result of com- pounding from consistently positive returns of 5% per year. Most investors should do as well because sadly most don’t. Of course, the appeal of the stock market is the potential to compound at a higher rate of return than 5% thus creating a bigger pile of money in the end. Certainly, the potential to earn 10% compounded (the long-term stock market return often quoted in Wall Street marketing material) is a strong incentive to invest in stocks. Consider that $1,000,000 compounding at 10% a year would grow to $10,834,710 in 25 years. Here’s Where Dividend Growth Kicks In Now let’s say this time when you walked in the bank, your friendly banker decides he likes you so much he’s going to cut you in on a great deal. The bank is selling common stock in the bank at $10 a share and they’re going to pay a cash divi- dend of 5% a year. Your banker also offers that as an incentive to buy shares that if you agree to keep you stock for 25 years, they’ll raise the divi- dend 5% a year. Under such a scenario, $1,000,000 grows to the princely sum of $9,681,594, and generates annual income of $1,344,412 in year 25. Quite a jump from simply adding a dividend that grows at a modest 5% per year into the mix. Next, let’s say the bank does real well and actually increases the dividend by 8% annually. The returns now jump to $6,915,014 in annual income in year 25 on a portfolio value of a whopping $28,724,878! Or more than 42 times the amount of annual income from our basic 5% savings account example.Thus the power of a growing dividend! Just for grins we also calculated what would happen if we threw an additional $100,000 in new savings or contributions into the equation each year. Those are the ridiculous numbers in black or $19.8 million in annual income and a portfolio value north of $58 million. At this point, the question you have to ask is (Continued from page 1) (Continued on page 5)
  • 5. Page 5 Deschaine & Company, L.L.C. 6) Of course, the contribution of interest income to total return for bonds over the long term is 100%. $28,724,878 $3,386,355  $9,681,594 $58,007,859  $- $5,000,000 $10,000,000 $15,000,000 $20,000,000 $25,000,000 $30,000,000 $35,000,000 $40,000,000 $45,000,000 $50,000,000 $55,000,000 $60,000,000 1 2 3 4 5 6 7 8 9 10 11 12 13 14 15 16 17 18 19 20 21 22 23 24 25 Chart 3: How Principal Grows over time. Compounding $1,000,000 at 5% Compounding $1,000,000 at 5% with a 5% annual growth in income. Compounding $1,000,000 at 5% with an 8% annual growth in income. Compounding $1,000,000 at 5% with an 8% annual growth in income plus $100,000 a year in new savings/contributions. All income reinvested over 25 years. how reasonable are our assumptions? First, a 5% dividend yield. Our current EQUITY INCOME portfolio yields 5.85% as of September 30, 2010. Its been as high as 7.05%. Second, how reason- able is an annual dividend growth rate of 8%? The EQUITY INCOME portfolio’s annual divi- dend growth rate since 2000 is about 12%, which includes 2008 and 2009 when the portfo- lio had 13 stocks—all financial related—that cut or eliminated their dividends. Dividend growth so far in 2010 for the EI portfolio is about 13%. For the record, our annual dividend growth rate target is 8%. Anything above that we’ll consider a bonus. We do feel dividends will grow over the next decade despite the economic challenges the country faces for a number of reasons, including the fact that companies are generating record levels of discretionary cash from having reduced overhead during the reces- sion. They also have a record amount of cash on their balance sheets for the same reason. It’s our hope and expectation the managers will do the smart thing and increase dividends rather than many of the other less efficient things they might do with the extra cash. As charts 2 and 3 show, earning 5% and having that 5% grow at 8% a year over 25 years will produce quite acceptable investment results. Any boost from stock prices or dividend yields and higher dividend growth rates will just add to our pileofmoney in theend. “Tax Arbitrage Feedback Theory” (Say What?) We’ve had the privilege over our long career to meet some truly smart folks and associated with some genuinely nice people in the investment management business. Two such groups are the folks at CSFB Holt, and now just recently at IronBridge Capital Management. Bob Hendricks, the “H” in HOLT, taught us much of what we know about valuing compa- nies using economic or cash flow returns, rather than misleading accounting data. As we extolled before, “accounting data lies, the question is how much, and secondly, accounting data lies differ- ently for different companies.” Obviously, we believe that relying on accounting data to evaluate and select stocks is an exercise in delusion and fraught with peril. In many ways, dividends, because they’re paid in cash, serve as an excel- lent proxy and a quick measure of cash flow in the valuation of stocks. Recently, we had the opportunity to chat with Chris Faber, President and Chief Invest- ment Officer of IronBridge Capital Management a Chicago based asset manager with more than $8 billion in assets under management. The connection between HOLT and IronBridge is a direct one as Chris worked at HOLT right out of college in the 1980s just as HOLT was get- ting going. Another HOLT alum is Sam Eddins, who is IronBridge’s Director of Research. After spending about 15 years at HOLT telling investment managers like us how to use the HOLT data to pick stocks, Chris, and Bob Hendricks founded IronBridge to manage assets utilizing the HOLT research. The success of IronBridge speaks volumes about the validity of the research and the talent and skill of Chris Faber, Bob Hendricks and Sam Eddins. In addition to the ground breaking work on cash flow returns, HOLT had done extensive research on the impact federal taxes have on asset prices, particularly stock prices. We take the time to note all of this in part, to give credit where credit is due which is to the original brain trust at HOLT but also to draw your attention to an article Sam Eddins wrote in 2009 under the innocuous title: “Tax Arbitrage Feedback Theory.”You can assess the article directly at:http://ssrn.com/abstract=1356159 Quite simply, Sam argues that it was ill- conceived U.S. federal tax policy (is there any other kind?) going back more than 20 years that was the direct cause of the global credit crisis. Sam’s argument is based on the axiom that all investors seek the highest, after-tax, rate of re- turn when making investment decisions. Sam explains, in plain English I might add, how the different tax rates for different investor groups, individuals, tax-exempt institutions, etc., produced different incentives that contribute to instability and boom/bust cycles in the economy and the financial markets. Sam’s work shows that one, if not the main purpose, of debt securitization was tax minimiza- tion. In other words, credit default swaps were created simply to shift huge amounts of govern- ment tax receipts to Wall Street bonus pools through security losses (think Goldman Sachs) which necessitated the creation of huge amounts of low-quality debt designed to purposely go bad to create losses, (think billions in bad mortgages.) Sam notes, poignantly, that not a single dollar of “credit default swaps” has ever been used for any economic propose other than as a tax write-off. We encourage anyone who wants to truly understand the causes of the credit mess of the last 20 years, to access the article and spend 15 minutes reading it. Just ignore the math and the formulas. Those aren’t required reading and weren’t meant for us mere intellectual mortals. As always, thanks for reading. MJD (Continued from page 4)
  • 6. 292% 214% 204% 75% 32% 8% 4% 0.00 0.10 0.20 0.30 0.40 0.50 0.60 0.70 0.80 0.90 1.00 1.10 1.20 1.30 1.40 1.50 1.60 1.70 1.80 1.90 2.00 2.10 2.20 2.30 0% 25% 50% 75% 100% 125% 150% 175% 200% 225% 250% 275% 300% Dec‐79 Dec‐80 Dec‐81 Dec‐82 Dec‐83 Dec‐84 Dec‐85 Dec‐86 Dec‐87 Dec‐88 Dec‐89 Dec‐90 Dec‐91 Dec‐92 Dec‐93 Dec‐94 Dec‐95 Dec‐96 Dec‐97 Dec‐98 Dec‐99 Dec‐00 Dec‐01 Dec‐02 Dec‐03 Dec‐04 Dec‐05 Dec‐06 Dec‐07 Dec‐08 Dec‐09 OH MY-LANTA! JNJ’S HISTORY OF SLOWLY MAKING SHAREHOLDERS WEALTHY By: Jason M. Loyd Vice President & Portfolio Manager JOHNSON & JOHNSON MAY SEEM out of fashion in today’s frivolous, hyperactive, and alpha starved investment environment; but this $170 billion dollar health care and personal product empire has been a wealth creating, income producing, compounding machine for well over a century. The company was founded in 1886 by Robert, James, and Ed Johnson. They had a simple idea—yet utterly revolutionary for the time—to create sterile dressings and ban- dages. Obviously, their idea went over rather well to the point where I couldn’t even con- sider providing my kids with anything other than the latest and greatest “Princess, or Buzz Lightyear” “bandage.” With over a hundred subsidiaries, John- son & Johnson makes and markets thousands of diverse health care and personal care prod- ucts including such household medicine cabi- net staples as Tylenol or Listerine. As well as some of the world’s most sophisticated medi- cal devices and diagnostic equipment. Johnson & Johnson A Dividend Growth Compounding Machine JNJ has been paying a dividend since 1944 and has increased it annually for over 47 years. That’s as in 1963, when John F. Kennedy was in the White House.(7) To put the power of growing a dividend for such a long period of time into perspective, if you invested $10,000 in JNJ back in 1970, you would’ve received about $167 in dividends that year. If you then held onto the stock all these years and rein- vested all your dividends, you would now see $138,000 in annual dividends hit your invest- ment account each year. The annual dividend having grown from $.01 a share to $2.16 a share in that time or an annual growth rate of 14% since 1970. Reinvesting all the dividends grow total dividend income better than 18% a year. Oh, by the way, the shares you would’ve acquired along the way would now have a market value in the neighborhood of $3.6 mil- lion dollars as of September 30, 2010. What Is “Yield on Cost” We’ve held Johnson & Johnson in the EIP Portfolio since March 2009. The only reason we didn’t buy JNJ sooner was because the stock was rarely cheap enough for us to justify committing a significant amount of capital to the company. For the record, we paid $52.62 a share in March 2009, giving us a “yield on cost” of 4.1% on our position. So what’s “yield on cost?” As you can imagine, it’s very much what is sounds like. It’s the yield you’re earning on the stock based on today’s annual dividend divided by what you originally paid for the shares you own. In the case of the EIP, we paid $52.62 for our shares in March 2009. If we divided JNJ’s current $2.16 annual dividend by our $52.62 per share cost, we get a “yield on cost” of 4.1% on our JNJ shares. Now a “yield on cost” of 4.1% may not seem like a big deal, but what if we’ve bought JNJ in January 1979 and held onto those shares until now. JNJ’s 1979 year-end share market price was—get this—$0.85 (as in cents) after adjusting for three 2/1 splits along the way. Now, if we divided JNJ’s current annual $2.16 dividend by our 1979 cost and we get a “yield on cost” of—drum roll please—254%. In other words, for every share you might have bought in 1979 at $0.85, you would now be receiving $2.16 in annual dividends or more than 2.5 times your initial investment—each and every year— and growing to boot! Going forward, you can be sure we do not anticipate this kind of supercharged income growth. However, our analysis indicates that Johnson & Johnson should be able to continue to generate positive cash flow from its stable of products and continue to pay and increase their dividends for years to come. As long as that’s the case, and the price of the stock re- mains reasonable by our valuation measures; we’ll continue to utilize the dividend and divi- dend growth attributes of JNJ to provide grow- ing income to our clients. Of course, we are always watching for price drops allowing us to buy JNJ on the cheap to augment the income growth process. JML Page 6 3rd Quarter 2010 Viewpoint 7) And Mark was a mere pup of seven years old. So that ought to give you a good idea of just how long ago 47 years is! Ticker: JNJ 9/30/10 Price: $61.96 Current Dividend Yield: 3.5% 5-Year Dividend GR: 10.9% 40-Year Dividend GR: 19.0% Year End “Yield on Cost” & Dollar Annual Dividend December 1979 to 2010
  • 7. Year End 2009 Viewpoint Page 7 QuarterlyReturns 3rd Qrt 2010 US MARKETS 11.63 GLOBAL EX-US 16.91 DEV MRKTS EX-US 16.78 EMERGING MRKTS 17.75 CORE BONDS 2.37 LT COMMODITY 12.14 Source: Morningstar Q210 Market Commentary Market Summary 3rd Qrt 2010 EQUITY INCOME Portfolio 3nd Quarter 2010 Update THE EQUITY INCOME Portfolio current holdings as of September 30, 2010 are shownon thetableto theleft. The third quarter was quite a good one for most equity investors. Investors actually invested in equities that is. One of the notable stories of 2010 is the massive moveby investors into bonds and bond funds of all types. For the last 30 months in a row, inflows into bond mutual funds have topped flows into stock mutual funds. Un- fortunately, like real estate speculators of the last half of the decade and tech investors in the late 1990s, we think bond investors are in for a rude awakening when rates start to tick up as they surelywillsooner orlater. DividendsKeepGrowing Investors looking for income might gander at the list of stocks to the left. Stocks are showing nice income yields on growing dividends. Standard and Poor’s reported that dividends showed a 6% increase on average over the prior year period, albeit the comparison is relative to a low quarter fordividendsin the3rdquarter of2009. The table to the left shows two columns we’ve not shown before. The long term dividend growth rate column is the annualized dividend growth rate for each stock going back anywhere from 3 to 20 years depending on the stock. Most notably is the fact that the average dividend increase for the stocks shown here is better than 17%annually. The far right column shows the annual return each of the stocks earned from dividends “alone,” no capital returns factored in. Again, the average annual return from just the dividend for the group is a healthy 5.87%. How’s that for a nice rate of return and from just part of the re- turn equation. Compounding your money at just shy of 6% while growing your annual income at a healthy 17% from a diversified portfolio of quality stocks. Now that sounds like a good strategy for anystock market environment! Note, past performance is not a guarantee of future returns and all that. Equity Income Portfolio Data Update   Company  Symbol   Recent   Price    Current   Yield   5‐Year   Average  Dividend Yield   Long‐term   Dividend   Growth Rate  L‐T Annual   Return from  Dividend Only  Abbott Laboratories  ABT  52.84  3.33  2.60  18.48  4.30  Arthur J Gallagher & Co.  AJG  27.28  4.69  4.70  5.77  5.36  AllianceBern Global High Inc  AWF  15.17  7.91  7.95  11.66  12.06  B&G Foods, Inc.  BGS  11.14  6.10  5.10  9.10  6.67  Black Hills Corporation  BKH  32.60  4.42  4.20  19.31  5.61  Bristol‐Myers Squibb Co.  BMY  27.11  4.72  4.80  8.11  4.61  Colgate‐Palmolive Co  CL  76.70  2.76  2.10  17.05  6.01  Clorox Company  CLX  68.00  3.24  2.50  7.04  4.81  ConocoPhillips  COP  61.12  3.60  2.70  11.83  3.72  CPFL Energy Inc.  CPL  72.86  7.77  6.50  20.97  3.43  CenturyLink, Inc.  CTL  40.47  7.17  4.00  10.11  4.73  Chevron Corp  CVX  84.25  3.42  3.10  16.53  5.25  Dominion Resources Inc.  D  44.74  4.09  3.80  15.01  4.24  DuPont de Nemours & Co.  DD  47.13  3.48  3.90  14.61  4.92  Diamond Offshore Drilling Inc.  DO  68.63  0.73  3.90  10.38  4.37  ENI S.p.A.  E  45.26  5.67  4.70  0.90  5.61  Consolidated Edison, Inc.  ED  48.88  4.87  5.10  20.51  13.76  Elbit Systems Ltd.  ESLT  52.84  2.73  1.60  10.29  2.26  Energy Transfer Partners LP  ETP  50.05  7.14  7.10  3.10  3.55  EV Energy Partners, Units  EVEP  36.27  8.35  8.90  7.18  4.36  Federated Investors Inc  FII  24.31  3.95  3.00  0.90  13.43  Fifth Street Finance Corp.  FSC  11.40  13.30  8.75  11.95  3.91  Frontier Communications Corp.  FTR  8.78  8.54  9.90  11.20  10.13  Gladstone Investment Corp  GAIN  7.27  6.60  8.96  14.02  10.08  General Mills Inc.  GIS  37.12  3.02  2.70  16.17  7.26  Great Northern Iron Ore  GNI  120.50  12.45  8.90  28.07  4.41  Genuine Parts Company  GPC  47.58  3.45  3.40  11.20  12.94  Glaxo Smithkline ADS  GSK  40.50  4.52  4.00  12.25  7.29  Health Care REIT Inc  HCN  50.88  5.42  5.80  9.02  3.74  HCP, Inc.  HCP  37.18  5.00  5.80  12.41  4.04  Coca‐Cola Company  KO  49.40  3.64  3.40  9.66  9.60  H.J. Heinz Company  HNZ  63.99  3.38  2.60  35.12  5.81  Johnson & Johnson  JNJ  31.82  3.65  3.60  15.24  2.73  Kraft Foods Inc  KFT  66.86  3.95  3.40  10.48  10.38  Kimberly‐Clark Corp.  KMB  61.47  2.86  2.80  12.44  3.83  Leggett & Platt Inc.  LEG  22.99  4.70  4.10  9.66  7.51  Linn Energy, LLC  LINE  32.57  7.74  6.50  11.88  5.17  Eli Lilly & Co.  LLY  35.50  5.52  3.80  16.90  5.12  Main Street Capital Corp  MAIN  16.69  8.99  8.70  14.11  3.98  McDonald's Corp.  MCD  78.44  3.11  2.80  27.53  2.13  Microchip Technology Inc  MCHP  30.68  4.47  3.30  20.03  6.48  Mercury General Corp.  MCY  43.24  5.46  4.40  21.67  5.99  Altria Group Inc  MO  24.95  6.09  6.80  65.65  7.21  Middlesex Water Co.  MSEX  17.69  4.07  3.90  58.58  0.97  MLP & Strategic Equity Fund  MTP  17.26  4.87  5.50  21.40  4.34  Maxim Integrated Products  MXIM  19.08  4.40  2.60  27.82  4.22  Norfolk Southern Corp  NSC  61.56  2.34  2.00  22.36  2.66  Realty Income Corp  O  35.56  4.86  6.50  5.76  5.74  Paychex, Inc.  PAYX  27.92  4.44  2.70  18.88  5.40  Pitney Bowes Inc.  PBI  22.06  6.62  4.20  8.49  3.38  Plum Creek Timber Co.  PCL  37.25  4.51  4.25  34.31  13.24  PepsiCo, Inc.  PEP  65.18  2.95  2.30  19.45  3.50  Procter & Gamble Co.  PG  63.51  3.03  2.50  48.32  3.61  Progress Energy Inc  PGN  44.96  5.52  5.50  14.83  4.51  Philip Morris Intl  PM  57.56  4.45  4.20  11.97  5.39  Pinnacle West Capital  PNW  42.20  4.98  5.20  3.59  5.22  Prospect Capital Corporation  PSEC  10.02  12.07  11.80  14.30  4.39  QWest Communications  Q  6.43  4.98  3.30  9.18  3.77  Reynolds American Inc  RAI  63.05  3.11  6.00  59.11  7.63  Southern Company  SO  38.13  4.77  5.50  0.00  8.44  Suburban Propane Partners LP  SPH  55.02  6.14  8.00  13.50  10.13  AT&T Inc.  T  28.34  5.93  4.80  38.82  5.52  Integrys Energy Group  TEG  53.35  5.10  5.20  6.05  7.29  UIL Holdings Corp  UIL  28.40  6.08  5.40  7.71  7.48  Unilever PLC ADR  UL  29.21  3.77  2.60  8.01  4.43  Vector Group Ltd.  VGR  18.58  8.61  9.40  19.64  3.53  Vectren Corporation  VVC  27.00  5.04  4.90  36.05  10.22  Verizon Communications, Inc.  VZ  32.52  6.00  4.50  6.16  3.76  Wayside Technology Group  WSTG  10.25  5.85  6.20  9.63  4.04  Aqua America Inc  WTR  21.06  2.94  2.40  10.41  6.00  World Wrestling Entertainment  WWE  13.89  10.37  7.90  51.12  5.38  # of   years of   Data  20  17  20  20  20  20  3  20  20  20  20  20  20  20  20  12  5  13  10  20  12  20  12  14  3  12  2  6  20  20  20  4  9  20  20  20  16  20  20  9  20  4  3  8  20  14  8  20  3  20  20  20  2  17  20  11  20  10  6  2  16  6  20  14  9  11  8  10  20  7  7  Deschaine & Company, L.L.C.
  • 8. Page 8 Deschaine & Company, L.L.C. WorldHeadquarters 128 South Fairway Drive Belleville, Illinois 62223 Phone: (618) 397-1002 MaryvilleOffice (618) 288-2200 HighlandOffice (618) 654-6262 PUBLISHER: MARK J. DESCHAINE EDITOR: JOHN H. DESCHAINE CONTRIBUTING EDITOR: TOM O’HARA STAFF CONTRIBUTORS: MATT POWERS, JASON LOYD COPY EDITOR: MARNIE E. DESCHAINE TECHNICAL ADVISOR: Joseph M. Deschaine. VIEWPOINT is a complementary publication of Deschaine & Company, L.L.C. a registered investment advisor in Belleville, Illinois. This information has been prepared from sources deemed reliable, but its accuracy is not guaranteed. It should not be assumed that any securities discussed will be profitable or will equal past performance, or is it an offer to buy or sell any security mentioned. Deschaine & Company and/or one or more of its clients, employees, family or friends may have a position in the securities dis- cussed herein. © 2010. All rights reserved. Reproduction of this publication is strictly forbidden without written consent from Deschaine & Company. This issue was published on October 20, 2010. If you would like to receive a complementary copy each quarterly, simply send us your address and the preferred method of delivery: snail-mail or email, to: 128 South Fairway Drive, Belleville, IL 62223 Or email us at mdeschaine@charter.net and we would be happy to add you to one of our mailing lists. Deschaine&Company,L.L.C. Page 8 DEMYSTIFYING MUTUAL FUNDS By: Matt Powers Vice President & Portfolio Manager EACH TIME WE PREPARE an article for VIEWPOINT, it usually stems from a topic we’ve received the most recent questions or which topic we think is under-covered or not openly discussed in polite company. When it comes to compensating someone for selling a mutual fund for example, it’s clear that many investors are often caught by sur- prise when the curtain is pulled back to reveal the total costs they incur when buying them. A mutual fund can be purchased in one of two ways. 1) No-Load: Simply purchasing the mutual fund without a commission. Or, 2) with a Load: Which is usually when a fund is purchased through a brokerage firm. The load is the commission paid to the broker or your financial advisor. Over the years, mutual fund companies have devised numerous and ingenious ways of obscuring the load from investors. One way is to break fund shares into different “classes” and charge different fees depending on the class of shares purchased. The three most common are listed in the chart below. Make no mistake, mutual fund companies are in business to generate fees; there’s no free lunch. Separate from the commissions and fees a client pays the broker or advisor, is the ever present mutual fund expenses known collec- tively as the fund “expense ratio.” These are the costs related to the investment management and operating of the stock or bond fund. These additional cost are deducted from your fund and paid to the fund company. The average stock fund’s annual expense ratio, for example is somewhere in the neighborhood of 1.15% of the fund’s total value. Remember, that is in addition to the loads and 12b-1 fees you’re charged just to buy the fund. Mutual Fund Advisory Accounts Mutual fund advisory accounts allow you to purchase mutual funds without a load or sales charge through an advi- sor, while paying an annual advisory fee. (We’ve seen this fee as high as 1.75%!). The “advisor” fee is to compensate the advi- sor for selecting the best funds for the client, while at the same time being charged an annual management fee by the advisor, right? While this is correct, let’ not forget about what was left unstated in the previous para- graph. The mutual fund company also has their fund management fees and expenses. So, in order to get an accurate tally on the total an- nual cost an investor incurs to own a fund through an advisor, the client will need to com- bine the two ex- penses (the advi- sor’s fee for selecting the funds, and the mutual fund fees for managing the fund) in order to under- stand their true overall costs. Here’s a typical combined annual advisory & mutual fund advisory account fee example we’ve seen from a number of broker- age and advisory firms over the years. The bottom line is this. While we’re in a low interest rate, highly volatile stock market environment, fully understanding the costs associated with your investments and your managers is crucial. One of the reasons we work to keep it simple in our fee and commis- sion structure here at D&C, so you know ex- actly what you are being charged. To help better understand the expenses involved with your mutual funds you can visit FINRA’s mutual fund analyzer, which can be found at: http://apps.finra.org/ fundanalyzer/1/fa.aspx. MTP Fund Shares Classes Front Load (commission) Back End Load 12b-1 fees (ongoing commission) Class A Usually 5.75% of the purchase value None .25% annually Class B None Typically begins at 6% in year 1, and reduces 1% each year .25% annually Class C None None 1.0% annually Mutual Fund Share Class Loads Fee For: Fee Rate Advisory Fee 1.75% Mutual Fund Expense Ratio 1.15% Total Annual Account Expenses 2.90% Combined Annual Advisor & Mutual Fund Fees