Más contenido relacionado
Similar a Mississauga Weekly Market Report (20)
Mississauga Weekly Market Report
- 1. Mississauga Homes | Mar 26th, 2022 P1 :: Weekly Overview
Dan Mehta, REALTOR®
dan@danmehta.ca
647-955-6119
Toronto Regional Real Estate Board (TRREB) assumes no responsibility for the accuracy of any information shown. Copyright © TRREB 2022
This software program is Copyright © 2022 Trenlii Inc.
Page 1/9
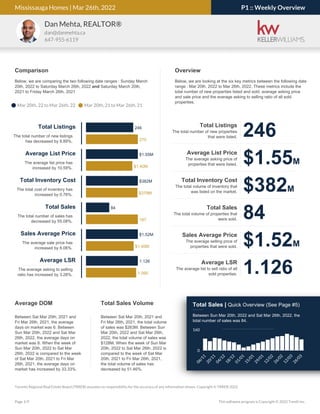
Comparison
Below, we are comparing the two following date ranges : Sunday March
20th, 2022 to Saturday March 26th, 2022 and Saturday March 20th,
2021 to Friday March 26th, 2021
Overview
Below, we are looking at the six key metrics between the following date
range : Mar 20th, 2022 to Mar 26th, 2022. These metrics include the
total number of new properties listed and sold, average asking price
and sale price and the average asking to selling ratio of all sold
properties.
Mar 20th, 21 to Mar 26th, 21
Mar 20th, 22 to Mar 26th, 22
Total Listings
The total number of new listings
has decreased by 8.89%.
246
270
Average List Price
The average list price has
increased by 10.59%.
$1.55M
$1.40M
Total Inventory Cost
The total cost of inventory has
increased by 0.76%.
$382M
$379M
Total Sales
The total number of sales has
decreased by 55.08%.
84
187
Sales Average Price
The average sale price has
increased by 8.06%.
$1.52M
$1.40M
Average LSR
The average asking to selling
ratio has increased by 3.28%.
1.126
1.090
246
Total Listings
The total number of new properties
that were listed.
$1.55M
Average List Price
The average asking price of
properties that were listed.
$382M
Total Inventory Cost
The total volume of inventory that
was listed on the market.
84
Total Sales
The total volume of properties that
were sold.
$1.52M
Sales Average Price
The average selling price of
properties that were sold.
1.126
Average LSR
The average list to sell ratio of all
sold properties.
Average DOM
Between Sat Mar 20th, 2021 and
Fri Mar 26th, 2021, the average
days on market was 6. Between
Sun Mar 20th, 2022 and Sat Mar
26th, 2022, the average days on
market was 8. When the week of
Sun Mar 20th, 2022 to Sat Mar
26th, 2022 is compared to the week
of Sat Mar 20th, 2021 to Fri Mar
26th, 2021, the average days on
market has increased by 33.33%.
Total Sales Volume
Between Sat Mar 20th, 2021 and
Fri Mar 26th, 2021, the total volume
of sales was $263M. Between Sun
Mar 20th, 2022 and Sat Mar 26th,
2022, the total volume of sales was
$128M. When the week of Sun Mar
20th, 2022 to Sat Mar 26th, 2022 is
compared to the week of Sat Mar
20th, 2021 to Fri Mar 26th, 2021,
the total volume of sales has
decreased by 51.46%.
Total Sales | Quick Overview (See Page #5)
Between Sun Mar 20th, 2022 and Sat Mar 26th, 2022, the
total number of sales was 84.
0
6
/
1
1
2
0
/
1
1
0
4
/
1
2
1
8
/
1
2
0
1
/
0
1
1
5
/
0
1
2
9
/
0
1
1
2
/
0
2
2
6
/
0
2
1
2
/
0
3
2
6
/
0
3
0
160
- 2. Mississauga Homes | Mar 26th, 2022 P2 :: Total Listings
Dan Mehta, REALTOR®
dan@danmehta.ca
647-955-6119
Toronto Regional Real Estate Board (TRREB) assumes no responsibility for the accuracy of any information shown. Copyright © TRREB 2022
This software program is Copyright © 2022 Trenlii Inc.
Page 2/9
Total Listings
Between Sun Mar 20th, 2022 and Sat Mar 26th, 2022, the total number of new listings was 246. Between Sat Mar 20th, 2021 and Fri Mar 26th, 2021, the
total number of new listings was 270. When the week of Sunday March 20th, 2022 to Saturday March 26th, 2022 is compared to the week of Saturday
March 20th, 2021 to Friday March 26th, 2021, the total number of new listings has decreased by 8.89%.
8.89%
Decrease
Mar 20th, 2022 - Mar 26th, 2022 vs Mar 20th, 2021 - Mar 26th, 2021
Between Sat Mar 20th, 2021 and Fri Mar 26th, 2021, the total number of new listings was 270. When
the week of Sunday March 20th, 2022 to Saturday March 26th, 2022 is compared to the week of
Saturday March 20th, 2021 to Friday March 26th, 2021, the total number of new listings has decreased
by 8.89%.
55.70%
Increase
Mar 20th, 2022 - Mar 26th, 2022 vs Mar 20th, 2020 - Mar 26th, 2020
Between Fri Mar 20th, 2020 and Thu Mar 26th, 2020, the total number of new listings was 158. When
the week of Sunday March 20th, 2022 to Saturday March 26th, 2022 is compared to the week of Friday
March 20th, 2020 to Thursday March 26th, 2020, the total number of new listings has increased by
55.70%.
12.84%
Increase
Mar 20th, 2022 - Mar 26th, 2022 vs Mar 20th, 2019 - Mar 26th, 2019
Between Wed Mar 20th, 2019 and Tue Mar 26th, 2019, the total number of new listings was 218. When
the week of Sunday March 20th, 2022 to Saturday March 26th, 2022 is compared to the week of
Wednesday March 20th, 2019 to Tuesday March 26th, 2019, the total number of new listings has
increased by 12.84%.
7
7
22
22
52
52 54
54
59
59
34
34
18
18
Sunday Monday Tuesday Wednesday Thursday Friday Saturday
0
25
50
Overview
The bar graph to the left provides an overview
of the last 7 days of the week broken down by
each individual week day leading up to
Saturday March 26th, 2022. Between Sunday
March 20th, 2022 and Saturday March 26th,
2022, we have seen a total volume of 246 new
properties that have been listed.
81
81 85
85
61
61 59
59
22
22 12
12
48
48
62
62
75
75 86
86
129
129
146
146
162
162
193
193 204
204
184
184
168
168
246
246
N
o
v
2
7
,
2
1
D
e
c
0
4
,
2
1
D
e
c
1
1
,
2
1
D
e
c
1
8
,
2
1
D
e
c
2
5
,
2
1
J
a
n
0
1
,
2
2
J
a
n
0
8
,
2
2
J
a
n
1
5
,
2
2
J
a
n
2
2
,
2
2
J
a
n
2
9
,
2
2
F
e
b
0
5
,
2
2
F
e
b
1
2
,
2
2
F
e
b
1
9
,
2
2
F
e
b
2
6
,
2
2
M
a
r
0
5
,
2
2
M
a
r
1
2
,
2
2
M
a
r
1
9
,
2
2
M
a
r
2
6
,
2
2
0
100
200
300
Analysis
The line graph to the right,
outlines and details the
changes in week-to-week (on a
weekly interval) trends for all
properties that have been listed
over the last 4 months as of
Saturday March 26th, 2022.
- 3. Mississauga Homes | Mar 26th, 2022 P3 :: Average List Price
Dan Mehta, REALTOR®
dan@danmehta.ca
647-955-6119
Toronto Regional Real Estate Board (TRREB) assumes no responsibility for the accuracy of any information shown. Copyright © TRREB 2022
This software program is Copyright © 2022 Trenlii Inc.
Page 3/9
Average List Price
Between Sun Mar 20th, 2022 and Sat Mar 26th, 2022, the average list price was $1.55M. Between Sat Mar 20th, 2021 and Fri Mar 26th, 2021, the average
list price was $1.40M. When the week of Sunday March 20th, 2022 to Saturday March 26th, 2022 is compared to the week of Saturday March 20th, 2021 to
Friday March 26th, 2021, the average list price has increased by 10.59%.
10.59%
Increase
Mar 20th, 2022 - Mar 26th, 2022 vs Mar 20th, 2021 - Mar 26th, 2021
Between Sat Mar 20th, 2021 and Fri Mar 26th, 2021, the average list price was $1.40M. When the week
of Sunday March 20th, 2022 to Saturday March 26th, 2022 is compared to the week of Saturday March
20th, 2021 to Friday March 26th, 2021, the average list price has increased by 10.59%.
32.68%
Increase
Mar 20th, 2022 - Mar 26th, 2022 vs Mar 20th, 2020 - Mar 26th, 2020
Between Fri Mar 20th, 2020 and Thu Mar 26th, 2020, the average list price was $1.17M. When the
week of Sunday March 20th, 2022 to Saturday March 26th, 2022 is compared to the week of Friday
March 20th, 2020 to Thursday March 26th, 2020, the average list price has increased by 32.68%.
22.40%
Increase
Mar 20th, 2022 - Mar 26th, 2022 vs Mar 20th, 2019 - Mar 26th, 2019
Between Wed Mar 20th, 2019 and Tue Mar 26th, 2019, the average list price was $1.27M. When the
week of Sunday March 20th, 2022 to Saturday March 26th, 2022 is compared to the week of
Wednesday March 20th, 2019 to Tuesday March 26th, 2019, the average list price has increased by
22.40%.
$1.60M
$1.60M
$1.52M
$1.52M
$1.65M
$1.65M
$1.53M
$1.53M $1.51M
$1.51M
$1.60M
$1.60M
$1.38M
$1.38M
Sunday Monday Tuesday Wednesday Thursday Friday Saturday
0
1M
Overview
The bar graph to the left provides an overview
of the last 7 days of the week broken down by
each individual week day leading up to
Saturday March 26th, 2022. Between Sunday
March 20th, 2022 and Saturday March 26th,
2022, we have seen an average list price of
$1.55M for all new properties that have been
listed.
$1.70M
$1.70M
$1.42M
$1.42M $1.41M
$1.41M
$1.84M
$1.84M
$1.25M
$1.25M
$1.63M
$1.63M
$1.50M
$1.50M
$1.75M
$1.75M
$1.60M
$1.60M
$1.66M
$1.66M
$1.49M
$1.49M
$1.43M
$1.43M
$1.55M
$1.55M
N
o
v
2
7
,
2
1
D
e
c
0
4
,
2
1
D
e
c
1
1
,
2
1
D
e
c
1
8
,
2
1
D
e
c
2
5
,
2
1
J
a
n
0
1
,
2
2
J
a
n
0
8
,
2
2
J
a
n
1
5
,
2
2
J
a
n
2
2
,
2
2
J
a
n
2
9
,
2
2
F
e
b
0
5
,
2
2
F
e
b
1
2
,
2
2
F
e
b
1
9
,
2
2
F
e
b
2
6
,
2
2
M
a
r
0
5
,
2
2
M
a
r
1
2
,
2
2
M
a
r
1
9
,
2
2
M
a
r
2
6
,
2
2
1,000K
1,500K
2,000K
Analysis
The line graph to the right,
outlines and details the
changes in week-to-week (on a
weekly interval) trends in the
average list price of all
properties listed over the last 4
months as of Saturday March
26th, 2022.
- 4. Mississauga Homes | Mar 26th, 2022 P4 :: Total Inventory Cost
Dan Mehta, REALTOR®
dan@danmehta.ca
647-955-6119
Toronto Regional Real Estate Board (TRREB) assumes no responsibility for the accuracy of any information shown. Copyright © TRREB 2022
This software program is Copyright © 2022 Trenlii Inc.
Page 4/9
Total Inventory Cost
Between Sun Mar 20th, 2022 and Sat Mar 26th, 2022, the total cost of inventory was $382M. Between Sat Mar 20th, 2021 and Fri Mar 26th, 2021, the total
cost of inventory was $379M. When the week of Sunday March 20th, 2022 to Saturday March 26th, 2022 is compared to the week of Saturday March 20th,
2021 to Friday March 26th, 2021, the total cost of inventory has increased by 0.76%.
0.76%
Increase
Mar 20th, 2022 - Mar 26th, 2022 vs Mar 20th, 2021 - Mar 26th, 2021
Between Sat Mar 20th, 2021 and Fri Mar 26th, 2021, the total cost of inventory was $379M. When the
week of Sunday March 20th, 2022 to Saturday March 26th, 2022 is compared to the week of Saturday
March 20th, 2021 to Friday March 26th, 2021, the total cost of inventory has increased by 0.76%.
106.57%
Increase
Mar 20th, 2022 - Mar 26th, 2022 vs Mar 20th, 2020 - Mar 26th, 2020
Between Fri Mar 20th, 2020 and Thu Mar 26th, 2020, the total cost of inventory was $185M. When the
week of Sunday March 20th, 2022 to Saturday March 26th, 2022 is compared to the week of Friday
March 20th, 2020 to Thursday March 26th, 2020, the total cost of inventory has increased by 106.57%.
38.12%
Increase
Mar 20th, 2022 - Mar 26th, 2022 vs Mar 20th, 2019 - Mar 26th, 2019
Between Wed Mar 20th, 2019 and Tue Mar 26th, 2019, the total cost of inventory was $276M. When
the week of Sunday March 20th, 2022 to Saturday March 26th, 2022 is compared to the week of
Wednesday March 20th, 2019 to Tuesday March 26th, 2019, the total cost of inventory has increased
by 38.12%.
$11.2M
$11.2M
$33.4M
$33.4M
$86.0M
$86.0M
$82.5M
$82.5M
$89.3M
$89.3M
$54.3M
$54.3M
$24.9M
$24.9M
Sunday Monday Tuesday Wednesday Thursday Friday Saturday
0
50M
100M
Overview
The bar graph to the left provides an overview
of the last 7 days of the week broken down by
each individual week day leading up to
Saturday March 26th, 2022. Between Sunday
March 20th, 2022 and Saturday March 26th,
2022, we have seen a total inventory volume of
$382M for all new properties that have been
listed.
$138M
$138M
$88.7M
$88.7M
$40.6M
$40.6M
$78.4M
$78.4M
$112M
$112M
$226M
$226M
$266M
$266M
$320M
$320M
$284M
$284M
$240M
$240M
$382M
$382M
N
o
v
2
7
,
2
1
D
e
c
0
4
,
2
1
D
e
c
1
1
,
2
1
D
e
c
1
8
,
2
1
D
e
c
2
5
,
2
1
J
a
n
0
1
,
2
2
J
a
n
0
8
,
2
2
J
a
n
1
5
,
2
2
J
a
n
2
2
,
2
2
J
a
n
2
9
,
2
2
F
e
b
0
5
,
2
2
F
e
b
1
2
,
2
2
F
e
b
1
9
,
2
2
F
e
b
2
6
,
2
2
M
a
r
0
5
,
2
2
M
a
r
1
2
,
2
2
M
a
r
1
9
,
2
2
M
a
r
2
6
,
2
2
0
200M
400M
Analysis
The line graph to the right,
outlines and details the
changes in week-to-week (on a
weekly interval) trends for the
total cost of all new inventory
over the last 4 months as of
Saturday March 26th, 2022.
- 5. Mississauga Homes | Mar 26th, 2022 P5 :: Total Sales
Dan Mehta, REALTOR®
dan@danmehta.ca
647-955-6119
Toronto Regional Real Estate Board (TRREB) assumes no responsibility for the accuracy of any information shown. Copyright © TRREB 2022
This software program is Copyright © 2022 Trenlii Inc.
Page 5/9
Total Sales
Between Sun Mar 20th, 2022 and Sat Mar 26th, 2022, the total number of sales was 84. Between Sat Mar 20th, 2021 and Fri Mar 26th, 2021, the total
number of sales was 187. When the week of Sunday March 20th, 2022 to Saturday March 26th, 2022 is compared to the week of Saturday March 20th,
2021 to Friday March 26th, 2021, the total number of sales has decreased by 55.08%.
55.08%
Decrease
Mar 20th, 2022 - Mar 26th, 2022 vs Mar 20th, 2021 - Mar 26th, 2021
Between Sat Mar 20th, 2021 and Fri Mar 26th, 2021, the total number of sales was 187. When the week
of Sunday March 20th, 2022 to Saturday March 26th, 2022 is compared to the week of Saturday March
20th, 2021 to Friday March 26th, 2021, the total number of sales has decreased by 55.08%.
42.37%
Increase
Mar 20th, 2022 - Mar 26th, 2022 vs Mar 20th, 2020 - Mar 26th, 2020
Between Fri Mar 20th, 2020 and Thu Mar 26th, 2020, the total number of sales was 59. When the week
of Sunday March 20th, 2022 to Saturday March 26th, 2022 is compared to the week of Friday March
20th, 2020 to Thursday March 26th, 2020, the total number of sales has increased by 42.37%.
5.62%
Decrease
Mar 20th, 2022 - Mar 26th, 2022 vs Mar 20th, 2019 - Mar 26th, 2019
Between Wed Mar 20th, 2019 and Tue Mar 26th, 2019, the total number of sales was 89. When the
week of Sunday March 20th, 2022 to Saturday March 26th, 2022 is compared to the week of
Wednesday March 20th, 2019 to Tuesday March 26th, 2019, the total number of sales has decreased
by 5.62%.
13
13
17
17
12
12
14
14
9
9
13
13
6
6
Sunday Monday Tuesday Wednesday Thursday Friday Saturday
0
10
20
Overview
The bar graph to the left provides an overview
of the last 7 days of the week broken down by
each individual week day leading up to
Saturday March 26th, 2022. Between Sunday
March 20th, 2022 and Saturday March 26th,
2022, we have seen a total volume of 84
properties that have been sold.
89
89
73
73
65
65 61
61
43
43
19
19
29
29
44
44
55
55
67
67
79
79
91
91
107
107 109
109
126
126
115
115
101
101
84
84
N
o
v
2
7
,
2
1
D
e
c
0
4
,
2
1
D
e
c
1
1
,
2
1
D
e
c
1
8
,
2
1
D
e
c
2
5
,
2
1
J
a
n
0
1
,
2
2
J
a
n
0
8
,
2
2
J
a
n
1
5
,
2
2
J
a
n
2
2
,
2
2
J
a
n
2
9
,
2
2
F
e
b
0
5
,
2
2
F
e
b
1
2
,
2
2
F
e
b
1
9
,
2
2
F
e
b
2
6
,
2
2
M
a
r
0
5
,
2
2
M
a
r
1
2
,
2
2
M
a
r
1
9
,
2
2
M
a
r
2
6
,
2
2
0
50
100
150
Analysis
The line graph to the right,
outlines and details the
changes in week-to-week (on a
weekly interval) trends for all
properties that have been sold
over the last 4 months as of
Saturday March 26th, 2022.
- 6. Mississauga Homes | Mar 26th, 2022 P6 :: Sales Average Price
Dan Mehta, REALTOR®
dan@danmehta.ca
647-955-6119
Toronto Regional Real Estate Board (TRREB) assumes no responsibility for the accuracy of any information shown. Copyright © TRREB 2022
This software program is Copyright © 2022 Trenlii Inc.
Page 6/9
Sales Average Price
Between Sun Mar 20th, 2022 and Sat Mar 26th, 2022, the average sale price was $1.52M. Between Sat Mar 20th, 2021 and Fri Mar 26th, 2021, the average
sale price was $1.40M. When the week of Sunday March 20th, 2022 to Saturday March 26th, 2022 is compared to the week of Saturday March 20th, 2021 to
Friday March 26th, 2021, the average sale price has increased by 8.06%.
8.06%
Increase
Mar 20th, 2022 - Mar 26th, 2022 vs Mar 20th, 2021 - Mar 26th, 2021
Between Sat Mar 20th, 2021 and Fri Mar 26th, 2021, the average sale price was $1.40M. When the
week of Sunday March 20th, 2022 to Saturday March 26th, 2022 is compared to the week of Saturday
March 20th, 2021 to Friday March 26th, 2021, the average sale price has increased by 8.06%.
29.27%
Increase
Mar 20th, 2022 - Mar 26th, 2022 vs Mar 20th, 2020 - Mar 26th, 2020
Between Fri Mar 20th, 2020 and Thu Mar 26th, 2020, the average sale price was $1.17M. When the
week of Sunday March 20th, 2022 to Saturday March 26th, 2022 is compared to the week of Friday
March 20th, 2020 to Thursday March 26th, 2020, the average sale price has increased by 29.27%.
54.14%
Increase
Mar 20th, 2022 - Mar 26th, 2022 vs Mar 20th, 2019 - Mar 26th, 2019
Between Wed Mar 20th, 2019 and Tue Mar 26th, 2019, the average sale price was $985K. When the
week of Sunday March 20th, 2022 to Saturday March 26th, 2022 is compared to the week of
Wednesday March 20th, 2019 to Tuesday March 26th, 2019, the average sale price has increased by
54.14%.
$1.68M
$1.68M
$1.35M
$1.35M
$1.56M
$1.56M
$1.42M
$1.42M
$1.64M
$1.64M
$1.57M
$1.57M
$1.47M
$1.47M
Sunday Monday Tuesday Wednesday Thursday Friday Saturday
0
1M
2M
Overview
The bar graph to the left provides an overview
of the last 7 days of the week broken down by
each individual week day leading up to
Saturday March 26th, 2022. Between Sunday
March 20th, 2022 and Saturday March 26th,
2022, we have seen an average sale price of
$1.52M for all properties that have been sold.
$1.49M
$1.49M
$1.65M
$1.65M
$1.51M
$1.51M $1.52M
$1.52M
$1.65M
$1.65M
$1.82M
$1.82M
$1.72M
$1.72M
$1.65M
$1.65M
$1.74M
$1.74M
$1.64M
$1.64M
$1.55M
$1.55M
N
o
v
2
7
,
2
1
D
e
c
0
4
,
2
1
D
e
c
1
1
,
2
1
D
e
c
1
8
,
2
1
D
e
c
2
5
,
2
1
J
a
n
0
1
,
2
2
J
a
n
0
8
,
2
2
J
a
n
1
5
,
2
2
J
a
n
2
2
,
2
2
J
a
n
2
9
,
2
2
F
e
b
0
5
,
2
2
F
e
b
1
2
,
2
2
F
e
b
1
9
,
2
2
F
e
b
2
6
,
2
2
M
a
r
0
5
,
2
2
M
a
r
1
2
,
2
2
M
a
r
1
9
,
2
2
M
a
r
2
6
,
2
2
2,000K
1,250K
1,500K
1,750K
Analysis
The line graph to the right,
outlines and details the
changes in week-to-week (on a
weekly interval) trends in the
average sale price of all sold
properties over the last 4
months as of Saturday March
26th, 2022.
- 7. Mississauga Homes | Mar 26th, 2022 P7 :: Average List to Sell Ratio
Dan Mehta, REALTOR®
dan@danmehta.ca
647-955-6119
Toronto Regional Real Estate Board (TRREB) assumes no responsibility for the accuracy of any information shown. Copyright © TRREB 2022
This software program is Copyright © 2022 Trenlii Inc.
Page 7/9
Average List to Sell Ratio
Between Sun Mar 20th, 2022 and Sat Mar 26th, 2022, the average asking to selling ratio was 1.126. Between Sat Mar 20th, 2021 and Fri Mar 26th, 2021,
the average asking to selling ratio was 1.090. When the week of Sunday March 20th, 2022 to Saturday March 26th, 2022 is compared to the week of
Saturday March 20th, 2021 to Friday March 26th, 2021, the average asking to selling ratio has increased by 3.28%.
3.28%
Increase
Mar 20th, 2022 - Mar 26th, 2022 vs Mar 20th, 2021 - Mar 26th, 2021
Between Sat Mar 20th, 2021 and Fri Mar 26th, 2021, the average asking to selling ratio was 1.090.
When the week of Sunday March 20th, 2022 to Saturday March 26th, 2022 is compared to the week of
Saturday March 20th, 2021 to Friday March 26th, 2021, the average asking to selling ratio has
increased by 3.28%.
11.26%
Increase
Mar 20th, 2022 - Mar 26th, 2022 vs Mar 20th, 2020 - Mar 26th, 2020
Between Fri Mar 20th, 2020 and Thu Mar 26th, 2020, the average asking to selling ratio was 1.012.
When the week of Sunday March 20th, 2022 to Saturday March 26th, 2022 is compared to the week of
Friday March 20th, 2020 to Thursday March 26th, 2020, the average asking to selling ratio has
increased by 11.26%.
14.21%
Increase
Mar 20th, 2022 - Mar 26th, 2022 vs Mar 20th, 2019 - Mar 26th, 2019
Between Wed Mar 20th, 2019 and Tue Mar 26th, 2019, the average asking to selling ratio was 0.986.
When the week of Sunday March 20th, 2022 to Saturday March 26th, 2022 is compared to the week of
Wednesday March 20th, 2019 to Tuesday March 26th, 2019, the average asking to selling ratio has
increased by 14.21%.
1.121
1.121
1.173
1.173
1.115
1.115 1.110
1.110 1.130
1.130 1.103
1.103 1.106
1.106
Sunday Monday Tuesday Wednesday Thursday Friday Saturday
0
0.5
1
Overview
The bar graph to the left provides an overview
of the last 7 days of the week broken down by
each individual week day leading up to
Saturday March 26th, 2022. Between Sunday
March 20th, 2022 and Saturday March 26th,
2022, we have seen an average ask to sell
price ratio of 1.126 for all properties that have
been sold.
1.095
1.095
1.115
1.115
1.131
1.131 1.131
1.131
1.174
1.174
1.078
1.078
1.127
1.127
1.189
1.189
1.166
1.166
1.182
1.182
1.172
1.172
1.195
1.195 1.199
1.199 1.192
1.192
1.174
1.174
1.153
1.153 1.157
1.157
1.126
1.126
N
o
v
2
7
,
2
1
D
e
c
0
4
,
2
1
D
e
c
1
1
,
2
1
D
e
c
1
8
,
2
1
D
e
c
2
5
,
2
1
J
a
n
0
1
,
2
2
J
a
n
0
8
,
2
2
J
a
n
1
5
,
2
2
J
a
n
2
2
,
2
2
J
a
n
2
9
,
2
2
F
e
b
0
5
,
2
2
F
e
b
1
2
,
2
2
F
e
b
1
9
,
2
2
F
e
b
2
6
,
2
2
M
a
r
0
5
,
2
2
M
a
r
1
2
,
2
2
M
a
r
1
9
,
2
2
M
a
r
2
6
,
2
2
1.05
1.1
1.15
1.2
1.25
Analysis
The line graph to the right,
outlines and details the
changes in week-to-week (on a
weekly interval) trends in the
average ask to sell price ratio of
all sold properties over the last
4 months as of Saturday March
26th, 2022.
- 8. Mississauga Homes | Mar 26th, 2022 P8 :: Average Days on Market
Dan Mehta, REALTOR®
dan@danmehta.ca
647-955-6119
Toronto Regional Real Estate Board (TRREB) assumes no responsibility for the accuracy of any information shown. Copyright © TRREB 2022
This software program is Copyright © 2022 Trenlii Inc.
Page 8/9
Average Days on Market
Between Sun Mar 20th, 2022 and Sat Mar 26th, 2022, the average days on market was 8. Between Sat Mar 20th, 2021 and Fri Mar 26th, 2021, the average
days on market was 6. When the week of Sunday March 20th, 2022 to Saturday March 26th, 2022 is compared to the week of Saturday March 20th, 2021 to
Friday March 26th, 2021, the average days on market has increased by 33.33%.
33.33%
Increase
Mar 20th, 2022 - Mar 26th, 2022 vs Mar 20th, 2021 - Mar 26th, 2021
Between Sat Mar 20th, 2021 and Fri Mar 26th, 2021, the average days on market was 6. When the
week of Sunday March 20th, 2022 to Saturday March 26th, 2022 is compared to the week of Saturday
March 20th, 2021 to Friday March 26th, 2021, the average days on market has increased by 33.33%.
20.00%
Decrease
Mar 20th, 2022 - Mar 26th, 2022 vs Mar 20th, 2020 - Mar 26th, 2020
Between Fri Mar 20th, 2020 and Thu Mar 26th, 2020, the average days on market was 10. When the
week of Sunday March 20th, 2022 to Saturday March 26th, 2022 is compared to the week of Friday
March 20th, 2020 to Thursday March 26th, 2020, the average days on market has decreased by
20.00%.
42.86%
Decrease
Mar 20th, 2022 - Mar 26th, 2022 vs Mar 20th, 2019 - Mar 26th, 2019
Between Wed Mar 20th, 2019 and Tue Mar 26th, 2019, the average days on market was 14. When the
week of Sunday March 20th, 2022 to Saturday March 26th, 2022 is compared to the week of
Wednesday March 20th, 2019 to Tuesday March 26th, 2019, the average days on market has
decreased by 42.86%.
8
8
7
7 7
7 7
7
18
18
7
7 7
7
Sunday Monday Tuesday Wednesday Thursday Friday Saturday
0
10
20 Overview
The bar graph to the left provides an overview
of the last 7 days of the week broken down by
each individual week day leading up to
Saturday March 26th, 2022. Between Sunday
March 20th, 2022 and Saturday March 26th,
2022, we have seen an average days on
market of 8 for all properties that have been
sold.
12
12 12
12 11
11 10
10 9
9
27
27
13
13
11
11 12
12
9
9 10
10
8
8
6
6
8
8 7
7 7
7 7
7 8
8
N
o
v
2
7
,
2
1
D
e
c
0
4
,
2
1
D
e
c
1
1
,
2
1
D
e
c
1
8
,
2
1
D
e
c
2
5
,
2
1
J
a
n
0
1
,
2
2
J
a
n
0
8
,
2
2
J
a
n
1
5
,
2
2
J
a
n
2
2
,
2
2
J
a
n
2
9
,
2
2
F
e
b
0
5
,
2
2
F
e
b
1
2
,
2
2
F
e
b
1
9
,
2
2
F
e
b
2
6
,
2
2
M
a
r
0
5
,
2
2
M
a
r
1
2
,
2
2
M
a
r
1
9
,
2
2
M
a
r
2
6
,
2
2
0
10
20
30
Analysis
The line graph to the right,
outlines and details the
changes in week-to-week (on a
weekly interval) trends in the
average days on market of all
sold properties over the last 4
months as of Saturday March
26th, 2022.
- 9. Mississauga Homes | Mar 26th, 2022 P9 :: Total Sales Volume
Dan Mehta, REALTOR®
dan@danmehta.ca
647-955-6119
Toronto Regional Real Estate Board (TRREB) assumes no responsibility for the accuracy of any information shown. Copyright © TRREB 2022
This software program is Copyright © 2022 Trenlii Inc.
Page 9/9
Total Sales Volume
Between Sun Mar 20th, 2022 and Sat Mar 26th, 2022, the total volume of sales was $128M. Between Sat Mar 20th, 2021 and Fri Mar 26th, 2021, the total
volume of sales was $263M. When the week of Sunday March 20th, 2022 to Saturday March 26th, 2022 is compared to the week of Saturday March 20th,
2021 to Friday March 26th, 2021, the total volume of sales has decreased by 51.46%.
51.46%
Decrease
Mar 20th, 2022 - Mar 26th, 2022 vs Mar 20th, 2021 - Mar 26th, 2021
Between Sat Mar 20th, 2021 and Fri Mar 26th, 2021, the total volume of sales was $263M. When the
week of Sunday March 20th, 2022 to Saturday March 26th, 2022 is compared to the week of Saturday
March 20th, 2021 to Friday March 26th, 2021, the total volume of sales has decreased by 51.46%.
84.05%
Increase
Mar 20th, 2022 - Mar 26th, 2022 vs Mar 20th, 2020 - Mar 26th, 2020
Between Fri Mar 20th, 2020 and Thu Mar 26th, 2020, the total volume of sales was $69.3M. When the
week of Sunday March 20th, 2022 to Saturday March 26th, 2022 is compared to the week of Friday
March 20th, 2020 to Thursday March 26th, 2020, the total volume of sales has increased by 84.05%.
45.48%
Increase
Mar 20th, 2022 - Mar 26th, 2022 vs Mar 20th, 2019 - Mar 26th, 2019
Between Wed Mar 20th, 2019 and Tue Mar 26th, 2019, the total volume of sales was $87.7M. When the
week of Sunday March 20th, 2022 to Saturday March 26th, 2022 is compared to the week of
Wednesday March 20th, 2019 to Tuesday March 26th, 2019, the total volume of sales has increased by
45.48%.
$21.9M
$21.9M
$23.0M
$23.0M
$18.7M
$18.7M
$19.9M
$19.9M
$14.8M
$14.8M
$20.5M
$20.5M
$8.80M
$8.80M
Sunday Monday Tuesday Wednesday Thursday Friday Saturday
0
10M
20M
Overview
The bar graph to the left provides an overview
of the last 7 days of the week broken down by
each individual week day leading up to
Saturday March 26th, 2022. Between Sunday
March 20th, 2022 and Saturday March 26th,
2022, we have seen a total sales volume of
$128M for all new properties that have been
listed.
$132M
$132M
$98.1M
$98.1M
$65.3M
$65.3M
$31.4M
$31.4M
$80.2M
$80.2M
$115M
$115M
$150M
$150M
$183M
$183M
$212M
$212M
$157M
$157M
N
o
v
2
7
,
2
1
D
e
c
0
4
,
2
1
D
e
c
1
1
,
2
1
D
e
c
1
8
,
2
1
D
e
c
2
5
,
2
1
J
a
n
0
1
,
2
2
J
a
n
0
8
,
2
2
J
a
n
1
5
,
2
2
J
a
n
2
2
,
2
2
J
a
n
2
9
,
2
2
F
e
b
0
5
,
2
2
F
e
b
1
2
,
2
2
F
e
b
1
9
,
2
2
F
e
b
2
6
,
2
2
M
a
r
0
5
,
2
2
M
a
r
1
2
,
2
2
M
a
r
1
9
,
2
2
M
a
r
2
6
,
2
2
0
100M
200M
300M
Analysis
The line graph to the right,
outlines and details the
changes in week-to-week (on a
weekly interval) trends for the
total cost of all sold properties
over the last 4 months as of
Saturday March 26th, 2022.
Powered by TCPDF (www.tcpdf.org)