SlideShare una empresa de Scribd logo
1 de 2
Descargar para leer sin conexión
10/9/2019 Gantt chart
https://searchsoftwarequality.techtarget.com/definition/Gantt-chart?vgnextfmt=print 1/2
SearchSoftwareQuality.com
Gantt chart
By Margaret Rouse
A Gantt chart is a horizontal bar chart developed as a production control tool in 1917 by Henry L. Gantt, an
American engineer and social scientist. Frequently used in project management, a Gantt chart provides a
graphical illustration of a schedule that helps to plan, coordinate, and track specific tasks in a project.
Gantt charts may be simple versions created on graph paper or more complex automated versions created using
project management applications such as Microsoft Project or Excel.
A Gantt chart is constructed with a horizontal axis representing the total time span of the project, broken down
into increments (for example, days, weeks, or months) and a vertical axis representing the tasks that make up the
project (for example, if the project is outfitting your computer with new software, the major tasks involved
might be: conduct research, choose software, install software). Horizontal bars of varying lengths represent the
sequences, timing, and time span for each task. Using the same example, you would put "conduct research" at
the top of the verticle axis and draw a bar on the graph that represents the amount of time you expect to spend on
the research, and then enter the other tasks below the first one and representative bars at the points in time when
you expect to undertake them. The bar spans may overlap, as, for example, you may conduct research and
choose software during the same time span. As the project progresses, secondary bars, arrowheads, or darkened
bars may be added to indicate completed tasks, or the portions of tasks that have been completed. A vertical line
is used to represent the report date.
10/9/2019 Gantt chart
https://searchsoftwarequality.techtarget.com/definition/Gantt-chart?vgnextfmt=print 2/2
Gantt charts give a clear illustration of project status, but one problem with them is that they don't indicate task
dependencies - you cannot tell how one task falling behind schedule affects other tasks. The PERT chart, another
popular project management charting method, is designed to do this. Automated Gantt charts store more
information about tasks, such as the individuals assigned to specific tasks, and notes about the procedures. They
also offer the benefit of being easy to change, which is helpful. Charts may be adjusted frequently to reflect the
actual status of project tasks as, almost inevitably, they diverge from the original plan.
03 May 2007
All Rights Reserved, Copyright 2006 - 2019, TechTarget | Read our Privacy Statement

Más contenido relacionado

La actualidad más candente

Apps4.Pro Planner Gantt chart (Chrome extension)
Apps4.Pro Planner Gantt chart (Chrome extension)Apps4.Pro Planner Gantt chart (Chrome extension)
Apps4.Pro Planner Gantt chart (Chrome extension)sanbss
 
Gantt chart cpm
Gantt chart cpmGantt chart cpm
Gantt chart cpmMimin Adam
 
Benchmarking and Gantt chart
Benchmarking and Gantt chartBenchmarking and Gantt chart
Benchmarking and Gantt chartAbhijeet Malkar
 
Mba ii pmom_unit-4.3 scheduling-gantt chart a
Mba ii pmom_unit-4.3 scheduling-gantt chart aMba ii pmom_unit-4.3 scheduling-gantt chart a
Mba ii pmom_unit-4.3 scheduling-gantt chart aRai University
 
Lecture5---Gantt Chart
Lecture5---Gantt ChartLecture5---Gantt Chart
Lecture5---Gantt Chartdanishrafiq
 
The gantt Chart
The gantt Chart The gantt Chart
The gantt Chart Nicola2903
 
Gantt Chart Templates by Creately
Gantt Chart Templates by CreatelyGantt Chart Templates by Creately
Gantt Chart Templates by CreatelyCreately
 
PERT & Gantt Chart
PERT & Gantt Chart PERT & Gantt Chart
PERT & Gantt Chart Anju George
 
Software project management tools
Software project management toolsSoftware project management tools
Software project management toolsChethanMp7
 
Lab 2 create a gantt chart and pert chart using ms project
Lab 2 create a gantt chart and pert chart using ms projectLab 2 create a gantt chart and pert chart using ms project
Lab 2 create a gantt chart and pert chart using ms projectFarah Ahmed
 
Modelingprogramstructure
ModelingprogramstructureModelingprogramstructure
Modelingprogramstructurelearnt
 

La actualidad más candente (20)

Gantt
GanttGantt
Gantt
 
Lec 12 gantt chart
Lec 12 gantt chartLec 12 gantt chart
Lec 12 gantt chart
 
Apps4.Pro Planner Gantt chart (Chrome extension)
Apps4.Pro Planner Gantt chart (Chrome extension)Apps4.Pro Planner Gantt chart (Chrome extension)
Apps4.Pro Planner Gantt chart (Chrome extension)
 
Gantt chart cpm
Gantt chart cpmGantt chart cpm
Gantt chart cpm
 
Gantt Charts
Gantt ChartsGantt Charts
Gantt Charts
 
Ghant chart
Ghant chartGhant chart
Ghant chart
 
Gantt and PERT chart
Gantt and PERT chartGantt and PERT chart
Gantt and PERT chart
 
Gantt chart
Gantt chartGantt chart
Gantt chart
 
Benchmarking and Gantt chart
Benchmarking and Gantt chartBenchmarking and Gantt chart
Benchmarking and Gantt chart
 
Mba ii pmom_unit-4.3 scheduling-gantt chart a
Mba ii pmom_unit-4.3 scheduling-gantt chart aMba ii pmom_unit-4.3 scheduling-gantt chart a
Mba ii pmom_unit-4.3 scheduling-gantt chart a
 
Lecture5---Gantt Chart
Lecture5---Gantt ChartLecture5---Gantt Chart
Lecture5---Gantt Chart
 
The gantt Chart
The gantt Chart The gantt Chart
The gantt Chart
 
Pert and gantt chart
Pert and gantt chartPert and gantt chart
Pert and gantt chart
 
Gantt Chart Templates by Creately
Gantt Chart Templates by CreatelyGantt Chart Templates by Creately
Gantt Chart Templates by Creately
 
PERT & Gantt Chart
PERT & Gantt Chart PERT & Gantt Chart
PERT & Gantt Chart
 
Software project management tools
Software project management toolsSoftware project management tools
Software project management tools
 
Lab 2 create a gantt chart and pert chart using ms project
Lab 2 create a gantt chart and pert chart using ms projectLab 2 create a gantt chart and pert chart using ms project
Lab 2 create a gantt chart and pert chart using ms project
 
Gantt chart & pert chart
Gantt chart & pert chartGantt chart & pert chart
Gantt chart & pert chart
 
Modelingprogramstructure
ModelingprogramstructureModelingprogramstructure
Modelingprogramstructure
 
Gantt pert
Gantt pertGantt pert
Gantt pert
 

Similar a Gantt chart discuss 1

Gantt Charts and PERT# Charts: Different But Not So Different
Gantt Charts and PERT# Charts: Different But Not So DifferentGantt Charts and PERT# Charts: Different But Not So Different
Gantt Charts and PERT# Charts: Different But Not So DifferentAnkitGrewal14
 
Brief tutorial on gantt charts
Brief tutorial on gantt chartsBrief tutorial on gantt charts
Brief tutorial on gantt chartsDr Ghaiath Hussein
 
Events Planning - Midterm 2 quiz.docx
Events Planning - Midterm 2 quiz.docxEvents Planning - Midterm 2 quiz.docx
Events Planning - Midterm 2 quiz.docxMIkeBryanjoaquin
 
WBS Gantt chart and project management for Jira users
WBS Gantt chart and project management for Jira usersWBS Gantt chart and project management for Jira users
WBS Gantt chart and project management for Jira usersTam Nguyen, PMP, CSM
 
Are Gantt charts your worst nightmares well, not anymore!
Are Gantt charts your worst nightmares well, not anymore!Are Gantt charts your worst nightmares well, not anymore!
Are Gantt charts your worst nightmares well, not anymore!Wilsonlarasuper
 
Choosing the Right Visualization Tool- Gantt Chart vs. Timeline - Slideshare....
Choosing the Right Visualization Tool- Gantt Chart vs. Timeline - Slideshare....Choosing the Right Visualization Tool- Gantt Chart vs. Timeline - Slideshare....
Choosing the Right Visualization Tool- Gantt Chart vs. Timeline - Slideshare....Yoroflow
 
TID Chapter 6 Introduction To Microsoft Project
TID Chapter 6 Introduction To Microsoft ProjectTID Chapter 6 Introduction To Microsoft Project
TID Chapter 6 Introduction To Microsoft ProjectWanBK Leo
 
GANTT CHART nursing Management for Msc nursing
GANTT CHART nursing Management for Msc nursingGANTT CHART nursing Management for Msc nursing
GANTT CHART nursing Management for Msc nursingThangamjayarani
 
Gantt template ws Assignment Help
Gantt template ws Assignment HelpGantt template ws Assignment Help
Gantt template ws Assignment HelpGlobal Web Tutors
 
Gantt Chart Description
Gantt Chart DescriptionGantt Chart Description
Gantt Chart DescriptionAsraHafeez
 
Creating and Using a Gannt Chart A Gantt chart is a t.docx
Creating and Using a Gannt Chart  A Gantt chart is a t.docxCreating and Using a Gannt Chart  A Gantt chart is a t.docx
Creating and Using a Gannt Chart A Gantt chart is a t.docxwillcoxjanay
 
An Introduction to Gantt Charts
An Introduction to Gantt Charts An Introduction to Gantt Charts
An Introduction to Gantt Charts Litunya Laurean
 
Project Management Techniques ( WBS & Critical Path Method )
Project Management Techniques ( WBS & Critical Path Method )Project Management Techniques ( WBS & Critical Path Method )
Project Management Techniques ( WBS & Critical Path Method )Surajkumar Sonar
 
Programme evaluation and review technique &Gantt Chart
Programme evaluation and review technique &Gantt ChartProgramme evaluation and review technique &Gantt Chart
Programme evaluation and review technique &Gantt ChartMathew Varghese V
 
Mobile App Part 21Mobile App Part 2Vladimir MileticStray.docx
Mobile App Part 21Mobile App Part 2Vladimir MileticStray.docxMobile App Part 21Mobile App Part 2Vladimir MileticStray.docx
Mobile App Part 21Mobile App Part 2Vladimir MileticStray.docxannandleola
 
Gantt Chart.pptx
Gantt Chart.pptxGantt Chart.pptx
Gantt Chart.pptxAyan974999
 

Similar a Gantt chart discuss 1 (20)

What is a Gantt chart
What is a Gantt chartWhat is a Gantt chart
What is a Gantt chart
 
Gantt charts
Gantt chartsGantt charts
Gantt charts
 
Gantt Charts and PERT# Charts: Different But Not So Different
Gantt Charts and PERT# Charts: Different But Not So DifferentGantt Charts and PERT# Charts: Different But Not So Different
Gantt Charts and PERT# Charts: Different But Not So Different
 
Brief tutorial on gantt charts
Brief tutorial on gantt chartsBrief tutorial on gantt charts
Brief tutorial on gantt charts
 
Events Planning - Midterm 2 quiz.docx
Events Planning - Midterm 2 quiz.docxEvents Planning - Midterm 2 quiz.docx
Events Planning - Midterm 2 quiz.docx
 
WBS Gantt chart and project management for Jira users
WBS Gantt chart and project management for Jira usersWBS Gantt chart and project management for Jira users
WBS Gantt chart and project management for Jira users
 
Are Gantt charts your worst nightmares well, not anymore!
Are Gantt charts your worst nightmares well, not anymore!Are Gantt charts your worst nightmares well, not anymore!
Are Gantt charts your worst nightmares well, not anymore!
 
Choosing the Right Visualization Tool- Gantt Chart vs. Timeline - Slideshare....
Choosing the Right Visualization Tool- Gantt Chart vs. Timeline - Slideshare....Choosing the Right Visualization Tool- Gantt Chart vs. Timeline - Slideshare....
Choosing the Right Visualization Tool- Gantt Chart vs. Timeline - Slideshare....
 
TID Chapter 6 Introduction To Microsoft Project
TID Chapter 6 Introduction To Microsoft ProjectTID Chapter 6 Introduction To Microsoft Project
TID Chapter 6 Introduction To Microsoft Project
 
GANTT CHART nursing Management for Msc nursing
GANTT CHART nursing Management for Msc nursingGANTT CHART nursing Management for Msc nursing
GANTT CHART nursing Management for Msc nursing
 
Gantt template ws Assignment Help
Gantt template ws Assignment HelpGantt template ws Assignment Help
Gantt template ws Assignment Help
 
Gantt Chart Description
Gantt Chart DescriptionGantt Chart Description
Gantt Chart Description
 
Creating and Using a Gannt Chart A Gantt chart is a t.docx
Creating and Using a Gannt Chart  A Gantt chart is a t.docxCreating and Using a Gannt Chart  A Gantt chart is a t.docx
Creating and Using a Gannt Chart A Gantt chart is a t.docx
 
An Introduction to Gantt Charts
An Introduction to Gantt Charts An Introduction to Gantt Charts
An Introduction to Gantt Charts
 
Project Management Techniques ( WBS & Critical Path Method )
Project Management Techniques ( WBS & Critical Path Method )Project Management Techniques ( WBS & Critical Path Method )
Project Management Techniques ( WBS & Critical Path Method )
 
Programme evaluation and review technique &Gantt Chart
Programme evaluation and review technique &Gantt ChartProgramme evaluation and review technique &Gantt Chart
Programme evaluation and review technique &Gantt Chart
 
Gantt Chart
Gantt ChartGantt Chart
Gantt Chart
 
Mobile App Part 21Mobile App Part 2Vladimir MileticStray.docx
Mobile App Part 21Mobile App Part 2Vladimir MileticStray.docxMobile App Part 21Mobile App Part 2Vladimir MileticStray.docx
Mobile App Part 21Mobile App Part 2Vladimir MileticStray.docx
 
Gantt Chart.pptx
Gantt Chart.pptxGantt Chart.pptx
Gantt Chart.pptx
 
Unit II.pptx
Unit II.pptxUnit II.pptx
Unit II.pptx
 

Más de Makati Science High School

Types of graphs and charts and their uses with examples and pics
Types of graphs and charts and their uses  with examples and picsTypes of graphs and charts and their uses  with examples and pics
Types of graphs and charts and their uses with examples and picsMakati Science High School
 

Más de Makati Science High School (20)

Writing a Scientific Paper
Writing a Scientific PaperWriting a Scientific Paper
Writing a Scientific Paper
 
Research Paper Rubrics 2020
Research Paper Rubrics 2020Research Paper Rubrics 2020
Research Paper Rubrics 2020
 
Statistical test discuss 5
Statistical test discuss 5Statistical test discuss 5
Statistical test discuss 5
 
Measures of variation discuss 2.1
Measures of variation discuss  2.1Measures of variation discuss  2.1
Measures of variation discuss 2.1
 
Measures of dispersion discuss 2.2
Measures of dispersion discuss 2.2Measures of dispersion discuss 2.2
Measures of dispersion discuss 2.2
 
Materials and methods discuss
Materials and methods  discussMaterials and methods  discuss
Materials and methods discuss
 
Inferential stat tests samples discuss 4
Inferential stat tests samples discuss 4Inferential stat tests samples discuss 4
Inferential stat tests samples discuss 4
 
Ds vs Is discuss 3.1
Ds vs Is discuss 3.1Ds vs Is discuss 3.1
Ds vs Is discuss 3.1
 
Descriptive inferential-discuss 1
Descriptive  inferential-discuss 1Descriptive  inferential-discuss 1
Descriptive inferential-discuss 1
 
Central tendency m,m,m 1.2
Central tendency m,m,m 1.2Central tendency m,m,m 1.2
Central tendency m,m,m 1.2
 
Central tendency discuss 2
Central tendency  discuss 2Central tendency  discuss 2
Central tendency discuss 2
 
Types of graphs and charts and their uses with examples and pics
Types of graphs and charts and their uses  with examples and picsTypes of graphs and charts and their uses  with examples and pics
Types of graphs and charts and their uses with examples and pics
 
Levels of measurement discuss
Levels of measurement   discussLevels of measurement   discuss
Levels of measurement discuss
 
Research Designs -9 experimental Designs
Research Designs -9 experimental DesignsResearch Designs -9 experimental Designs
Research Designs -9 experimental Designs
 
Research designs Pt 1
Research designs Pt 1Research designs Pt 1
Research designs Pt 1
 
Identifying variables
Identifying variablesIdentifying variables
Identifying variables
 
Kinds and classifications of research
Kinds and classifications of researchKinds and classifications of research
Kinds and classifications of research
 
Research Ethical Issues
Research Ethical IssuesResearch Ethical Issues
Research Ethical Issues
 
BSR I Course Outline 2019-2020
BSR I Course Outline 2019-2020BSR I Course Outline 2019-2020
BSR I Course Outline 2019-2020
 
Research Ethics
Research EthicsResearch Ethics
Research Ethics
 

Último

SECOND SEMESTER TOPIC COVERAGE SY 2023-2024 Trends, Networks, and Critical Th...
SECOND SEMESTER TOPIC COVERAGE SY 2023-2024 Trends, Networks, and Critical Th...SECOND SEMESTER TOPIC COVERAGE SY 2023-2024 Trends, Networks, and Critical Th...
SECOND SEMESTER TOPIC COVERAGE SY 2023-2024 Trends, Networks, and Critical Th...KokoStevan
 
Ecological Succession. ( ECOSYSTEM, B. Pharmacy, 1st Year, Sem-II, Environmen...
Ecological Succession. ( ECOSYSTEM, B. Pharmacy, 1st Year, Sem-II, Environmen...Ecological Succession. ( ECOSYSTEM, B. Pharmacy, 1st Year, Sem-II, Environmen...
Ecological Succession. ( ECOSYSTEM, B. Pharmacy, 1st Year, Sem-II, Environmen...Shubhangi Sonawane
 
Unit-IV- Pharma. Marketing Channels.pptx
Unit-IV- Pharma. Marketing Channels.pptxUnit-IV- Pharma. Marketing Channels.pptx
Unit-IV- Pharma. Marketing Channels.pptxVishalSingh1417
 
psychiatric nursing HISTORY COLLECTION .docx
psychiatric  nursing HISTORY  COLLECTION  .docxpsychiatric  nursing HISTORY  COLLECTION  .docx
psychiatric nursing HISTORY COLLECTION .docxPoojaSen20
 
This PowerPoint helps students to consider the concept of infinity.
This PowerPoint helps students to consider the concept of infinity.This PowerPoint helps students to consider the concept of infinity.
This PowerPoint helps students to consider the concept of infinity.christianmathematics
 
Making and Justifying Mathematical Decisions.pdf
Making and Justifying Mathematical Decisions.pdfMaking and Justifying Mathematical Decisions.pdf
Making and Justifying Mathematical Decisions.pdfChris Hunter
 
Introduction to Nonprofit Accounting: The Basics
Introduction to Nonprofit Accounting: The BasicsIntroduction to Nonprofit Accounting: The Basics
Introduction to Nonprofit Accounting: The BasicsTechSoup
 
SOCIAL AND HISTORICAL CONTEXT - LFTVD.pptx
SOCIAL AND HISTORICAL CONTEXT - LFTVD.pptxSOCIAL AND HISTORICAL CONTEXT - LFTVD.pptx
SOCIAL AND HISTORICAL CONTEXT - LFTVD.pptxiammrhaywood
 
microwave assisted reaction. General introduction
microwave assisted reaction. General introductionmicrowave assisted reaction. General introduction
microwave assisted reaction. General introductionMaksud Ahmed
 
APM Welcome, APM North West Network Conference, Synergies Across Sectors
APM Welcome, APM North West Network Conference, Synergies Across SectorsAPM Welcome, APM North West Network Conference, Synergies Across Sectors
APM Welcome, APM North West Network Conference, Synergies Across SectorsAssociation for Project Management
 
Activity 01 - Artificial Culture (1).pdf
Activity 01 - Artificial Culture (1).pdfActivity 01 - Artificial Culture (1).pdf
Activity 01 - Artificial Culture (1).pdfciinovamais
 
Russian Escort Service in Delhi 11k Hotel Foreigner Russian Call Girls in Delhi
Russian Escort Service in Delhi 11k Hotel Foreigner Russian Call Girls in DelhiRussian Escort Service in Delhi 11k Hotel Foreigner Russian Call Girls in Delhi
Russian Escort Service in Delhi 11k Hotel Foreigner Russian Call Girls in Delhikauryashika82
 
Z Score,T Score, Percential Rank and Box Plot Graph
Z Score,T Score, Percential Rank and Box Plot GraphZ Score,T Score, Percential Rank and Box Plot Graph
Z Score,T Score, Percential Rank and Box Plot GraphThiyagu K
 
Grant Readiness 101 TechSoup and Remy Consulting
Grant Readiness 101 TechSoup and Remy ConsultingGrant Readiness 101 TechSoup and Remy Consulting
Grant Readiness 101 TechSoup and Remy ConsultingTechSoup
 
Gardella_PRCampaignConclusion Pitch Letter
Gardella_PRCampaignConclusion Pitch LetterGardella_PRCampaignConclusion Pitch Letter
Gardella_PRCampaignConclusion Pitch LetterMateoGardella
 
PROCESS RECORDING FORMAT.docx
PROCESS      RECORDING        FORMAT.docxPROCESS      RECORDING        FORMAT.docx
PROCESS RECORDING FORMAT.docxPoojaSen20
 
1029-Danh muc Sach Giao Khoa khoi 6.pdf
1029-Danh muc Sach Giao Khoa khoi  6.pdf1029-Danh muc Sach Giao Khoa khoi  6.pdf
1029-Danh muc Sach Giao Khoa khoi 6.pdfQucHHunhnh
 

Último (20)

SECOND SEMESTER TOPIC COVERAGE SY 2023-2024 Trends, Networks, and Critical Th...
SECOND SEMESTER TOPIC COVERAGE SY 2023-2024 Trends, Networks, and Critical Th...SECOND SEMESTER TOPIC COVERAGE SY 2023-2024 Trends, Networks, and Critical Th...
SECOND SEMESTER TOPIC COVERAGE SY 2023-2024 Trends, Networks, and Critical Th...
 
Ecological Succession. ( ECOSYSTEM, B. Pharmacy, 1st Year, Sem-II, Environmen...
Ecological Succession. ( ECOSYSTEM, B. Pharmacy, 1st Year, Sem-II, Environmen...Ecological Succession. ( ECOSYSTEM, B. Pharmacy, 1st Year, Sem-II, Environmen...
Ecological Succession. ( ECOSYSTEM, B. Pharmacy, 1st Year, Sem-II, Environmen...
 
Código Creativo y Arte de Software | Unidad 1
Código Creativo y Arte de Software | Unidad 1Código Creativo y Arte de Software | Unidad 1
Código Creativo y Arte de Software | Unidad 1
 
Unit-IV- Pharma. Marketing Channels.pptx
Unit-IV- Pharma. Marketing Channels.pptxUnit-IV- Pharma. Marketing Channels.pptx
Unit-IV- Pharma. Marketing Channels.pptx
 
psychiatric nursing HISTORY COLLECTION .docx
psychiatric  nursing HISTORY  COLLECTION  .docxpsychiatric  nursing HISTORY  COLLECTION  .docx
psychiatric nursing HISTORY COLLECTION .docx
 
This PowerPoint helps students to consider the concept of infinity.
This PowerPoint helps students to consider the concept of infinity.This PowerPoint helps students to consider the concept of infinity.
This PowerPoint helps students to consider the concept of infinity.
 
Making and Justifying Mathematical Decisions.pdf
Making and Justifying Mathematical Decisions.pdfMaking and Justifying Mathematical Decisions.pdf
Making and Justifying Mathematical Decisions.pdf
 
Introduction to Nonprofit Accounting: The Basics
Introduction to Nonprofit Accounting: The BasicsIntroduction to Nonprofit Accounting: The Basics
Introduction to Nonprofit Accounting: The Basics
 
SOCIAL AND HISTORICAL CONTEXT - LFTVD.pptx
SOCIAL AND HISTORICAL CONTEXT - LFTVD.pptxSOCIAL AND HISTORICAL CONTEXT - LFTVD.pptx
SOCIAL AND HISTORICAL CONTEXT - LFTVD.pptx
 
microwave assisted reaction. General introduction
microwave assisted reaction. General introductionmicrowave assisted reaction. General introduction
microwave assisted reaction. General introduction
 
APM Welcome, APM North West Network Conference, Synergies Across Sectors
APM Welcome, APM North West Network Conference, Synergies Across SectorsAPM Welcome, APM North West Network Conference, Synergies Across Sectors
APM Welcome, APM North West Network Conference, Synergies Across Sectors
 
Activity 01 - Artificial Culture (1).pdf
Activity 01 - Artificial Culture (1).pdfActivity 01 - Artificial Culture (1).pdf
Activity 01 - Artificial Culture (1).pdf
 
Mehran University Newsletter Vol-X, Issue-I, 2024
Mehran University Newsletter Vol-X, Issue-I, 2024Mehran University Newsletter Vol-X, Issue-I, 2024
Mehran University Newsletter Vol-X, Issue-I, 2024
 
Russian Escort Service in Delhi 11k Hotel Foreigner Russian Call Girls in Delhi
Russian Escort Service in Delhi 11k Hotel Foreigner Russian Call Girls in DelhiRussian Escort Service in Delhi 11k Hotel Foreigner Russian Call Girls in Delhi
Russian Escort Service in Delhi 11k Hotel Foreigner Russian Call Girls in Delhi
 
Z Score,T Score, Percential Rank and Box Plot Graph
Z Score,T Score, Percential Rank and Box Plot GraphZ Score,T Score, Percential Rank and Box Plot Graph
Z Score,T Score, Percential Rank and Box Plot Graph
 
Mattingly "AI & Prompt Design: Structured Data, Assistants, & RAG"
Mattingly "AI & Prompt Design: Structured Data, Assistants, & RAG"Mattingly "AI & Prompt Design: Structured Data, Assistants, & RAG"
Mattingly "AI & Prompt Design: Structured Data, Assistants, & RAG"
 
Grant Readiness 101 TechSoup and Remy Consulting
Grant Readiness 101 TechSoup and Remy ConsultingGrant Readiness 101 TechSoup and Remy Consulting
Grant Readiness 101 TechSoup and Remy Consulting
 
Gardella_PRCampaignConclusion Pitch Letter
Gardella_PRCampaignConclusion Pitch LetterGardella_PRCampaignConclusion Pitch Letter
Gardella_PRCampaignConclusion Pitch Letter
 
PROCESS RECORDING FORMAT.docx
PROCESS      RECORDING        FORMAT.docxPROCESS      RECORDING        FORMAT.docx
PROCESS RECORDING FORMAT.docx
 
1029-Danh muc Sach Giao Khoa khoi 6.pdf
1029-Danh muc Sach Giao Khoa khoi  6.pdf1029-Danh muc Sach Giao Khoa khoi  6.pdf
1029-Danh muc Sach Giao Khoa khoi 6.pdf
 

Gantt chart discuss 1

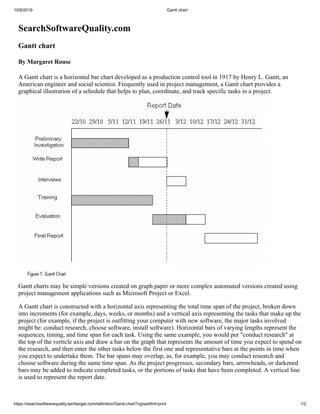
  • 1. 10/9/2019 Gantt chart https://searchsoftwarequality.techtarget.com/definition/Gantt-chart?vgnextfmt=print 1/2 SearchSoftwareQuality.com Gantt chart By Margaret Rouse A Gantt chart is a horizontal bar chart developed as a production control tool in 1917 by Henry L. Gantt, an American engineer and social scientist. Frequently used in project management, a Gantt chart provides a graphical illustration of a schedule that helps to plan, coordinate, and track specific tasks in a project. Gantt charts may be simple versions created on graph paper or more complex automated versions created using project management applications such as Microsoft Project or Excel. A Gantt chart is constructed with a horizontal axis representing the total time span of the project, broken down into increments (for example, days, weeks, or months) and a vertical axis representing the tasks that make up the project (for example, if the project is outfitting your computer with new software, the major tasks involved might be: conduct research, choose software, install software). Horizontal bars of varying lengths represent the sequences, timing, and time span for each task. Using the same example, you would put "conduct research" at the top of the verticle axis and draw a bar on the graph that represents the amount of time you expect to spend on the research, and then enter the other tasks below the first one and representative bars at the points in time when you expect to undertake them. The bar spans may overlap, as, for example, you may conduct research and choose software during the same time span. As the project progresses, secondary bars, arrowheads, or darkened bars may be added to indicate completed tasks, or the portions of tasks that have been completed. A vertical line is used to represent the report date.
  • 2. 10/9/2019 Gantt chart https://searchsoftwarequality.techtarget.com/definition/Gantt-chart?vgnextfmt=print 2/2 Gantt charts give a clear illustration of project status, but one problem with them is that they don't indicate task dependencies - you cannot tell how one task falling behind schedule affects other tasks. The PERT chart, another popular project management charting method, is designed to do this. Automated Gantt charts store more information about tasks, such as the individuals assigned to specific tasks, and notes about the procedures. They also offer the benefit of being easy to change, which is helpful. Charts may be adjusted frequently to reflect the actual status of project tasks as, almost inevitably, they diverge from the original plan. 03 May 2007 All Rights Reserved, Copyright 2006 - 2019, TechTarget | Read our Privacy Statement