

Recomendados
Recomendados
Más contenido relacionado
La actualidad más candente
La actualidad más candente (8)
Similar a Sail Corpoate Valuation
Similar a Sail Corpoate Valuation (20)
Más de Navin Bafna
Más de Navin Bafna (20)
Último
Último (20)
Sail Corpoate Valuation
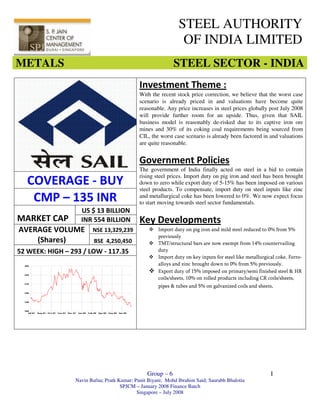
- 1. STEEL AUTHORITY OF INDIA LIMITED METALS STEEL SECTOR - INDIA Investment Theme : With the recent stock price correction, we believe that the worst case scenario is already priced in and valuations have become quite reasonable. Any price increases in steel prices globally post July 2008 will provide further room for an upside. Thus, given that SAIL business model is reasonably de-risked due to its captive iron ore mines and 30% of its coking coal requirements being sourced from CIL, the worst case scenario is already been factored in and valuations are quite reasonable. Government Policies The government of India finally acted on steel in a bid to contain rising steel prices. Import duty on pig iron and steel has been brought COVERAGE - BUY down to zero while export duty of 5-15% has been imposed on various steel products. To compensate, import duty on steel inputs like zinc CMP – 135 INR and metallurgical coke has been lowered to 0%. We now expect focus to start moving towards steel sector fundamentals. US $ 13 BILLION MARKET CAP INR 554 BILLION Key Developments AVERAGE VOLUME NSE 13,329,239 Import duty on pig iron and mild steel reduced to 0% from 5% previously (Shares) BSE 4,250,450 TMT/structural bars are now exempt from 14% countervailing 52 WEEK: HIGH – 293 / LOW - 117.35 duty Import duty on key inputs for steel like metallurgical coke, Ferro- s alloys and zinc brought down to 0% from 5% previously. Export duty of 15% imposed on primary/semi finished steel & HR coils/sheets, 10% on rolled products including CR coils/sheets, pipes & tubes and 5% on galvanized coils and sheets. ARANEGON Telecom 470 CLP Group – 6 I Navin Bafna; Pratk Kumar; Punit Biyani; Mohd Ibrahim Said; Saurabh Bhalotia SPJCM – January 2008 Finance Batch Singapore – July 2008
- 2. METALS STEEL SECTOR - INDIA SECTOR OUTLOOK A US$ 200 per ton increase in the price of coking coal will erode the profits of the non-integrated producers. Consequently, an increase in steel prices is imminent. In the international market, steel billet and HR coil prices have risen by about US$ 150/tonne to reach more than US$ 1000/tonne. In India, steel producers will make zero profits as the rise in contract coking coal prices will eliminate profits for the non-integrated producers. Only Tata Steel (Indian operations) and SAIL have captive iron ore, and these two account for only one third of total industry volume. Currently, based on the last three quarter’s financials, on an average the industry makes blended PBT of USD 200/ ton. A price increase in Jan-March 2008 will be neutralized by a sharp rise in iron ore cost for non-integrated producers. The Indian government has urged the steel industry not to raise prices and further given inflationary concerns. We believe the industry has a strong case to raise prices in order to restore profitability and invest in the long-term interests of the industry. We believe controlling steel prices would be the worst possible outcome since the industry would make no profits and government revenues would fall as a result. Allowing steel price to increase based on free market factors is the ideal case. However, given inflationary concerns, we believe that fiscal measures would probably be in the best interest of everyone concerned. Top Steel Producing Companies 2006 Rank Capacity Company 1 117.2 ArcelorMittal 2 32.7 Nippon Steel 3 32.0 JFE 4 30.1 Posco 5 22.5 Bao Steel SAIL TATA STEEL JSW INDIA Group – 6 II Navin Bafna; Pratk Kumar; Punit Biyani; Mohd Ibrahim Said; Saurabh Bhalotia SPJCM – January 2008 Finance Batch Singapore – July 2008
- 3. METALS STEEL SECTOR - INDIA IMPACT ON OTHER Focus on Fundamentals With the near-term uncertainty of government action now out of STEEL PLAYERS the way, we expect attention to once again start moving towards steel sector fundamentals. With domestic steel prices 10% lower If inflation continues to rise, drastic steps could happen going than landed price of imports, we see forward; but the fact that the government has not taken these steps little chance of steel companies now after a lot of internal deliberation indicates its reluctance and cutting prices due to cut in import thought process on the same. duty to 0% from 5% Steel pricing environment has improved in most regions with HRC . steel prices now approaching US$1,100/ton. Moreover, with China JSW Steel: JSW gets impacted most by likely to implement a quota system on steel exports, steel price the imposition of 5-15% export duty strength could extend into 2HFY09 & FY10 too. on steel but benefits to some extent The most benefited stock still remains Tata Steel, which will benefit from the cut in import duty on zinc from a robust pricing environment in Europe and is relatively less and coke. impacted by government action. VALUATIONS Other stocks: The import duty cut on 2008 EPS P/E RATIO P/BV zinc to 0% hits Hindustan Zinc and consequently Sterlite. Gujarat NRE SAIL 18 7.4 3.32 Coke gets impacted due to cut in TATA STEEL 200 3.1 2.61 import duty on coke to 0%. JSW 83 9.40 1.92 Tata Steel: Exports from India constitute just 2-3% of total volumes. SAIL EPS P/E RATIO P/BV EV/EBITDA 2007 18.00 7.44 3.32 4.40 Sail: Exports from India constitute just 2008E 18.60 7.20 2.61 5.60 1-2% of total volumes. 2009E 23.70 5.65 1.92 4.10 2010E 25.50 5.25 1.86 3.70 Group – 6 III Navin Bafna; Pratk Kumar; Punit Biyani; Mohd Ibrahim Said; Saurabh Bhalotia SPJCM – January 2008 Finance Batch Singapore – July 2008
- 4. METALS STEEL SECTOR - INDIA EXPANSION PLANS SAIL plans to increase its saleable steel capacity from the current 13mn tonnes to 23mn tonnes by FY12. It has also embarked on a modernization plan to drive internal margin expansion. The company plans to achieve entire production through BOF steel making (currently at 78% of production) and continuous casting route (currently at 64% of production). Further, it plans to enable full application of coal dust injection fuel and de-sulphurisation of hot metal; this will enable it to lower the coke rate in its blast furnaces and produce low content sulphur steel respectively. SHORT TERM EARNINGS GROWTH To improve realizations, over a period of 4-5 years, SAIL plans to increase the proportion of value-added steel and completely eliminate semi-finished steel from its product portfolio. The company also plans to increase the production of auto grade CR products, galvanized coils/sheets, plates, pipes, universal beams/heavy beams, rails and wheels, and achieve a significant jump in rounds and structural production to consume the entire semi-finished steel. This expansion and modernization plan, expected to now cost above Rs540bn due to high business inflation, is likely to be funded in a manner that the company’s debt-equity ratio remains within 1:1. At the current steel prices, the company is self sufficient in meeting the equity contribution for the expansion through internal accruals. LONG TERM EARNINGS GROWTH Group – 6 IV Navin Bafna; Pratk Kumar; Punit Biyani; Mohd Ibrahim Said; Saurabh Bhalotia SPJCM – January 2008 Finance Batch Singapore – July 2008
- 5. METALS STEEL SECTOR - INDIA 2007-08 2008-09 2009-10 2010-11 2011-12 2012 onwards Terminal values NOPAT 1538.06 1941.94 2744.55 3736.51 5923.44 9690.31 Return on NOA (RNOA) 6.21% 7.17% 9.15% 11.06% 14.98% 19.75% Growth Rate 5.50% 5.50% 5.50% 5.50% 5.50% 4.00% Reinvestment Ratio (RR) 88.55% 76.74% 60.09% 49.73% 36.71% 20.25% Risk Free Rate (Rf) 7.00% 7.00% 7.00% 7.00% 7.00% 5.50% Market Return (Rm) 12.00% 12.00% 12.00% 12.00% 12.00% 11.50% Cost of Equity (Ke) 14.40% 14.40% 14.40% 14.40% 14.40% 14.38% WaCC ( same as Ke, no debt) 14.40% 14.40% 14.40% 14.40% 14.40% 14.38% Return on Equity (ROE) 10.19% 10.62% 12.49% 14.21% 18.63% 24.43% Published Beta 1.48 1.48 1.48 1.48 1.48 1.48 FCFF 4640.23 4698.23 4756.96 4816.42 4876.63 4937.59 VALUATIONS FCFF Method 2007-08 2008-09 2009-10 2010-11 2011-12 2012 onwards Terminal values FCFF 4640 4698 4757 4816 4877 4938 Discounting Factor 1 1 1 1 1 10 Present Value of FCFF 4056 3590 3177 2812 2489 47568 TOTAL VALUE OF EQUITY (In Cr) 63692 No of Shares (crore) 413 Value of Equity Per Share 154 Group – 6 V Navin Bafna; Pratk Kumar; Punit Biyani; Mohd Ibrahim Said; Saurabh Bhalotia SPJCM – January 2008 Finance Batch Singapore – July 2008
- 6. METALS STEEL SECTOR - INDIA Residual Income Method 2007-08 2008-09 2009-10 2010-11 2011-12 2012 onwards Terminal values Book values (BV) 17606.95 21113.48 25151.33 30027.10 36910.06 47428.42 Residual Earnings (RE)= (ROE- KE)*BV -740.87 -799.00 -479.92 -57.45 1560.03 4768.30 Discounting Factor 0.8741 0.7641 0.6679 0.5838 0.5104 9.6339 Present Value of RE -647.62 -610.51 -320.55 -33.54 796.17 45937.38 Book Value (Base Year-2006-07) = 17467.02 TOTAL VALUE OF EQUITY (In Cr) 62588.35 No of Shares (in crores) 413.04 Value of Equity Per Share 151.53 Group – 6 VI Navin Bafna; Pratk Kumar; Punit Biyani; Mohd Ibrahim Said; Saurabh Bhalotia SPJCM – January 2008 Finance Batch Singapore – July 2008
- 7. METALS STEEL SECTOR - INDIA Consolidated Profit & Loss Account Projections (All Years) 2007-08 2008-09 2009-10 2010-11 2011-12 2012 onwards INCOME Terminal values Sales 46227 54086 64903 77883 97354 102222 Less : Excise Duty 8321 9735 11682 14019 17524 17378 37906 44350 53220 63864 79830 84844 Finished products internally consumed 493 577 692 830 1038 1103 Interest earned 4 4 5 5 6 7 Other revenues 831 856 881 908 935 963 Provisions no longer required written back 54 49 44 39 34 29 39288 45836 54843 65647 81844 86946 EXPENDITURE Depletion to stocks 223 227 230 233 237 241 Raw materials consumed 22189 25961 31153 37384 46730 42933 Purchase of semi/finished products and others 231 270 325 389 487 307 Employees’ Remuneration & Benefits 5917 6804 7825 8999 10349 11694 Stores & Spares consumed 3455 3973 4569 5254 6042 6707 Power & Fuel 3477 4380 5519 6954 8762 10340 Repairs & Maintenance 440 462 485 509 535 561 Freight outward 717 742 768 794 822 851 Other expenses 1823 2005 2206 2427 2669 2883 Interest & finance charges 371 349 328 308 290 272 Depreciation 1077 1070 1146 1227 1315 783 Total 39919 46244 54553 64480 78238 77572 Less : Transferred to Inter Account 2595 3006 3546 4191 5085 5042 37325 43238 51007 60288 73152 72529 Adjustments Loss for the year 1963 2598 3836 5359 8691 14417 Net Loss for the year 1963 2598 3836 5359 8691 14417 Provision for current tax -668 -883 -1304 -1822 -2955 -4902 Profit / Loss (-) after tax 1296 1715 2531 3537 5736 9515 Minority Interest 0 0 0 0 0 0 1296 1715 2531 3537 5736 9515 Balance brought forward from previous year (Net) 10955 9409 8546 8510 9253 11507 Amount available for Appropriation 12250 11123 11077 12046 14989 21022 Group – 6 VII Navin Bafna; Pratk Kumar; Punit Biyani; Mohd Ibrahim Said; Saurabh Bhalotia SPJCM – January 2008 Finance Batch Singapore – July 2008
- 8. METALS STEEL SECTOR - INDIA APPROPRIATIONS Provision towards long term service awrds -15 -15 -15 -15 -15 -15 Amount transferred from Bonds Redemption Reserve(Net) 38 38 38 38 38 38 Transferred to General reserve -1225 -1112 -1108 -1205 -1499 -2102 Interim Dividend -1225 -1112 -1108 -1205 -1499 -2102 Proposed dividend -368 -334 -332 -361 -450 -631 Tax on Dividend -48 -43 -43 -47 -58 -82 Loss carried over to Balance Sheet 9409 8546 8510 9253 11507 16128 Re-Formative Profit & Loss Statement 2007-08 2008-09 2009-10 2010-11 2011-12 2012 onwards Terminal values Operating Revenue 39284 45832 54838 65642 81837 86939 Operating Expense 36954 42889 50679 59980 72863 72257 Operating Income (Before tax) 2330 2942 4158 5661 8975 14682 Taxes -668 -883 -1304 -1822 -2955 -4902 Add: Tax on financial items -125 -117 -110 -103 -96 -90 Operating Income (After tax) 1538 1942 2745 3736 5923 9690 Financial Income 4 4 5 5 6 7 Financial Expense 371 349 328 308 290 272 Less: Tax on financial items -125 -117 -110 -103 -96 -90 Net Financial Expense 242 227 213 200 187 175 Net Earnings 1780 2169 2958 3936 6111 9866 Group – 6 VIII Navin Bafna; Pratk Kumar; Punit Biyani; Mohd Ibrahim Said; Saurabh Bhalotia SPJCM – January 2008 Finance Batch Singapore – July 2008
- 9. METALS STEEL SECTOR - INDIA Consolidated Balance Sheet Projections (All Years) SOURCES OF FUNDS 2007-08 2008-09 2009-10 2010-11 2011-12 2012 < Shareholders’ Funds Terminal values Share Capital 4130 4130 4130 4130 4130 4130 Reserves and Surplus 16303 19546 23573 28676 36247 48177 20434 23677 27704 32806 40377 52307 Share Application Money Loan Funds Secured Loans 1893 1779 1673 1572 1478 1389 Unsecured Loans 2468 2320 2180 2050 1927 1811 24794 27776 31557 36428 43782 55507 APPLICATION OF FUNDS Fixed Assets Gross Block 32153 34726 37504 40504 43744 49869 Less: Depreciation -20260 -21996 -23872 -25897 -28084 -30577 Net Block 11893 12729 13632 14607 15660 19291 Capital Work-in-Progress 3550 5405 6612 8442 11786 21977 15444 18135 20244 23049 27446 41268 Investments 41 45 49 54 60 66 Current Assets, Loans & Advances Inventories 12481 13521 16226 19471 24338 27600 Sundry Debtors 1895 2218 2661 3193 3992 4242 Cash & Bank Balances 3791 4435 5322 6386 7983 10181 Loans & Advances 1503 1551 1606 1718 1790 1802 19670 21725 25814 30768 38103 43825 Less: Current Liabilities & Provisions Current Liabilities 6726 7869 9443 11332 14165 21620 Provisions 3791 4435 5322 6386 7983 8484 10517 12304 14765 17718 22148 30104 Net Current Assets 9153 9421 11049 13050 15955 13721 Miscellaneous Expenditure 157 176 214 275 322 453 (to the extent not written off or adjusted) 24794 27776 31557 36428 43782 55507 Group – 6 IX Navin Bafna; Pratk Kumar; Punit Biyani; Mohd Ibrahim Said; Saurabh Bhalotia SPJCM – January 2008 Finance Batch Singapore – July 2008
- 10. METALS STEEL SECTOR - INDIA Re-Formulation of Balance Sheet 2007-08 2008-09 2009-10 2010-11 2011-12 2012 onwards Operating Assets Terminal values Net Block 11893.30 12729.29 13632.16 14607.26 15660.37 19291.15 Capital Work-in-Progress 3550.29 5405.48 6612.02 8442.07 11785.86 21976.69 Inventories 12481.28 13521.39 16225.67 19470.80 24338.50 27599.86 Sundry Debtors 1895.31 2217.51 2661.01 3193.21 3991.51 4242.20 Cash & Bank balances 3800.00 3800.00 3800.00 3800.00 3800.00 3800.00 Interest Receivable/Accrued 0.00 0.00 0.00 0.00 0.00 0.00 Loans & Advances 1502.76 1551.14 1605.60 1717.89 1789.65 1801.54 Miscellaneous Expenditure 156.69 175.66 214.43 274.78 321.55 453.21 Deferred Tax Assets 0.00 0.00 0.00 0.00 0.00 0.00 Total Operating Assets 35279.64 39400.47 44750.89 51506.02 61687.44 79164.65 Operating Liabilities Current Liabilities 6726.02 7869.45 9443.34 11332.01 14165.01 21619.89 Provisions 3790.61 4435.02 5322.02 6386.42 7983.03 8484.40 Deferred Tax Liability 0.00 0.00 0.00 0.00 0.00 0.00 Total Operating Liabilities 10516.64 12304.46 14765.36 17718.43 22148.03 30104.29 Net Operating Assets 24763.00 27096.01 29985.54 33787.59 39539.41 49060.36 Financial Assets Excess Cash & Cash Equivalents -9.39 635.02 1522.02 2586.42 4183.03 6381.28 Investments 40.69 44.76 49.23 54.16 59.57 65.53 Financial Obligations Share application Money 0.00 0.00 0.00 0.00 0.00 0.00 Loan Funds 0.00 0.00 0.00 0.00 0.00 0.00 Secured Loans 1892.93 1779.36 1672.60 1572.24 1477.91 1389.23 Unsecured Loans 2467.64 2319.58 2180.41 2049.58 1926.61 1811.01 Net Financial Asset -4329.27 -3419.17 -2281.75 -981.24 838.09 3246.57 Total Net Assets 20433.73 23676.84 27703.78 32806.34 40377.49 52306.93 Common Shareholder's Equity Share Capital 4130.40 4130.40 4130.40 4130.40 4130.40 4130.40 Reserves and Surplus 16303.33 19546.44 23573.38 28675.94 36247.09 48176.53 Minority Interest 0 0 0 0 0 0 Profit & Loss Account Debit Balance 0 0 0 0 0 0 Total Common Shareholder's Equity 20433.73 23676.84 27703.78 32806.34 40377.49 52306.93 Group – 6 X Navin Bafna; Pratk Kumar; Punit Biyani; Mohd Ibrahim Said; Saurabh Bhalotia SPJCM – January 2008 Finance Batch Singapore – July 2008
- 11. METALS STEEL SECTOR - INDIA Certification of Research Analyst We hereby certify that the views expressed in the attached research report accurately reflect our personal views about SAIL and its securities, related to the specific views or recommendations expressed in the research report. Disclaimer Clause The information and opinions contained herein have been compiled or arrived at based upon information obtained in good faith from sources believed to be reliable. Such information has not been independently verified and no guarantee, representation or warranty, express or implied is made as to its accuracy, completeness or correctness. All such information and opinions are subject to change without notice. This report has been produced independently of any company or companies mentioned herein, and forward looking statements, opinions and expectations contained herein are entirely those of researchers and given as part of its normal research activity. This document is for information purposes only and is provided on an “as is” basis. Descriptions of any company or companies or their securities mentioned herein are not intended to be complete and this document is not, and should not be construed as an offer, or solicitation of an offer, to buy or sell any securities or other financial instruments. We are not soliciting any action based on this research report. Sources • www.wikipedia.com • www.equitymaster.com • www.bseindia.com • www.nseindia.com • www.worldsteel.org • http://indiabudget.nic.in/ http://indiabudget.nic.in/ • http://finmin.nic.in/ • http://www.worldsteel.org/ • http://www.worldsteeldynamics.com/ Group – 6 XI Navin Bafna; Pratk Kumar; Punit Biyani; Mohd Ibrahim Said; Saurabh Bhalotia SPJCM – January 2008 Finance Batch Singapore – July 2008