Noiseken electromagnetic field visualization system - denkei

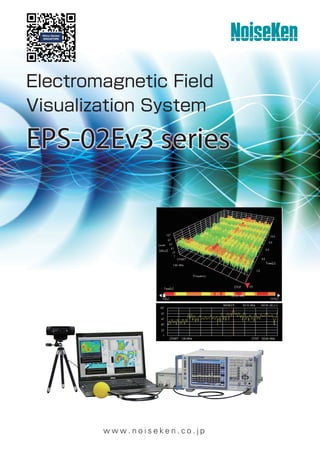
Electromagnetic Field Visualization System EPS is a EMC/EMI debugging tool enabling designers to rapidly perform pre-measurement, failure point identification, and improvement efficiency confirmation in EMC/EMI countermeasure process of product design. How does it work? The software detects locations of probes by color discrimination through camera’s image sensors*, real time analysis measured signal frequency, shows a heat map by overlapping electromagnetic field strength and real images of measured objects. ● A real-time diagnostic tool supports EMC/EMI debugging. ● Fast visualize EMC/EMI problems. ● Enables easy comparison of countermeasures before and after. ● Capable of measurement from entire products to single components. ● Factor-editor function provides correction of antenna characteristics, cable loss and pre-amplifier. ● User friendly compact design. ● Customer supplied spectrum and probes acceptable https://www.n-denkei.com/singapore/inquiry/

Recomendados
Recomendados
Más contenido relacionado
La actualidad más candente
La actualidad más candente (20)
Similar a Noiseken electromagnetic field visualization system - denkei
Similar a Noiseken electromagnetic field visualization system - denkei (20)
Más de NIHON DENKEI SINGAPORE
Más de NIHON DENKEI SINGAPORE (20)
Último
Último (20)
Noiseken electromagnetic field visualization system - denkei
- 2. 2 w w w. n o i s e k e n . c o m Tektronix MDO4000 series Rode Schwartz FSV Rode Schwartz FPL Rode Schwartz ESR Key sight Technology N9010A Key sight Technology N9010B Tektronix RSA360B EPS is a EMC/EMI debugging tool enabling designers to rapidly perform pre-measurement, failure point identification, and improvement efficiency confirmation in EMC/EMI countermeasure process of product design. How does it work? The software detects locations of probes by color discrimination through camera’s image sensors*, real time analysis measured signal frequency, shows a heat map by overlapping electromagnetic field strength and real images of measured objects. ● A real-time diagnostic tool supports EMC/EMI debugging. ● Fast visualize EMC/EMI problems. ● Enables easy comparison of countermeasures before and after. ● Capable of measurement from entire products to single components. ● Factor-editor function provides correction of antenna characteristics, cable loss and pre-amplifier. ● User friendly compact design. ● Customer supplied spectrum and probes acceptable (Please consult) EPS-02Ev3 Electromagnetic Field Visualization System Easy to carry at a lower price! The RSA306B spectrum analyzer makes it easy to carry on-site measurements. Also, you can build a system at a lower price. LAN cable USB cable Controller PC and software Camera Spectrum analyzer / EMI receiver Electric & magnetic field probes A wide variety of standard-compliant spectrum analyzer drivers Type of standard spectrum analyzer has included, for that alreadyyou using spectrum analyze use to build became easier. Three-Dimensional Indication(Time, Frequency, Amplitude) Simplifies EMC/EMI Debugging Image recognition (recognized the yellow color at the tip of the probe) Large probes measure large equipment Small probes measure small compornents, PCBs Capable of Measurement of Various product sizes Various probes applicable Various probes are applicable regardless of manufactures. Not only small components, but also big equipment are available to measure by changing probes. Furthermore, even products with complex surface shape are measureable by adjusting camera’s positi Rode Schwartz Spectrum analyzer FSV series, FSV3000 series, FPL series EMI receiver ESR series, ESRP series Key sight Technology Signal analyzer N9010A, N9010B Tektronix Oscilloscope MDO4000 series Spectrum analyzer RSA306B Please inquire about other spectrum analyzers. * Proprietary position detection method to patent application No. 2007-223275 by Kanazawa University and patent No. 5205547 by Noise Laboratory Co., Ltd.
- 3. E L E C T R O M A G N E T I C F I E L D V I S U A L I Z A T I O N S Y S T E M 3 w w w. n o i s e k e n . c o m EPS-02Ev3 Simplifies EMC/EMI Debugging Three-Dimensional Indication (Time, Frequency, Amplitude) Three-Dimensional Indication (Time, Frequency, Amplitude) pinpoint design failure even when the noise is intermittent. ① ② ③ ① ② ③ Example of intermittent noise Example of noise with little change Example of noise with large fluctuation Easily Check the Noise Occurrence Frequency. Add density display function. Added a function to display colors according to the frequency of occurrence (density display function) to the conventional spectrum display function.This makes it possible to easily check the noise occurrence frequency and the amplitude at the measurement frequency.
- 4. 4 w w w. n o i s e k e n . c o m EPS-02Ev3 Measured Window Same Measurement Condition New Measurement Window Easy comparison before and after countermeasures. Three-Dimensional Indication (Time, Frequency, Amplitude) pinpoint design failure even when the noise is intermittent. Differences display Comfirmed the amount of noise was reduced and the effect of the countermeasures. メインCPU Operation Mode (2) (During operated) Operation Mode (1) (During standby) Differences display Can read the noise has increased overall. No change in CPU Main CPU Main CPU Before Measurement Main CPU After Measurement Countermeasure points Countermeasure points Countermeasure points Countermeasure points Countermeasure points Countermeasure points Implement measures with ferrite core Implement measures with ferrite core Implement measures with ferrite core Implement measures with ferrite core Implemented measures using decaps Implemented measures using decaps Main CPU Camera image ghost function Overlaid the previous image for position adjustment. Example of use ①: To match the camera position with the previous image before the test Example of use②: When re-adjusting when the camera position shifts during the test Easymeasurementunderthesameconditionsaspastdata Newly measurement time, before measured option can also use in this new version. Before measured data if you save, then from Spectrum analyzer’ s setting menu the range of frequency or RBW select and use. Example of actual measurement results displayed on Zuken CR-8000 Design Force Designated coordinate output function Measurement results can be imported to external CAD software and CAD drawings and actual measurement data can be superimposed and displayed. Simplify image recognition settings By clicking on the part of the screen where you want to recognize the color (tip of the probe), automatically adjusts the hue, saturation, and brightness optimal for color recognition. Automatically adjusts hue, saturation, and brightness to recognize colors Click on the color you want to extract Others ● Highlighting unmeasured points: Unmeasured area highlights by flashing black and white. During measurement, it prevents unmeasured. ● Excess limit detection function: A function to display a message or stop measurement to protect the measuring instrument due to excessive input when the set limit value is exceeded.
- 5. E L E C T R O M A G N E T I C F I E L D V I S U A L I Z A T I O N S Y S T E M 5 w w w. n o i s e k e n . c o m Locates possible interference sources for pre- and post-compliance measurements CPU Measurement after modification indicated that the emission level lowered. This makes it easier to establish the countermeasure strategy for problem areas such as circuit traces, components, cables and housing A product failed in a compliance measurement at some frequencies. The frequency of 47.99 MHz is one of the target frequencies to which a solution is looked for. EMI suppression by using a ferrite core EMI suppression by using a ferrite core EMI suppression by using a ferrite core EMI suppression by using a ferrite core EMI suppression by using a by-pass capacitor EMI suppression by using a by-pass capacitor CPU Accumulated measurement data can be the basis of optimized design and debugging method rules, and improving and sharing how-hows, which contributes to engineering time and cost reduction, and reliability and safety improvements. ① Failed at a measurement in an anechoic chamber ① Failed at a measurement in an anechoic chamber NG NG The frequencies at which the amplitudes are over the limit are known but far field measurement cannot identify the sources of emissions The frequencies at which the amplitudes are over the limit are known but far field measurement cannot identify the sources of emissions 47.99MHz 40.67dbμ/m CISPR 22 Class B (QP) limit OK basis of optimized OK 47.99MHz 40.67dbμ/m ● Enables the users to evaluate suppression methodologies ● Enables the users to verify the effectiveness of the selected methodology A intensity distribution map shows "hot spots", which are the target areas. Furthermore, narrowing down to the desired range of frequencies lets you know the relevant spots of the frequencies in interest. Cable Cable CPU LSI Hot spot Hot spot Hot spot Hot spot Hot spot Hot spot ● Incorporating suppression measures and verifying their effectiveness ● An amplitude versus frequency plot for each probe position gives the users the power to evaluate the EMI properties in depth. ② Near-field measurement by EPS-02 ② Near-field measurement by EPS-02 ③ Incorporating suppression measures and verifying their effectiveness ③ Incorporating suppression measures and verifying their effectiveness A compliance measurement after debugging verified the product emission was within the limit. Data can be saved, accumulated and shared for future occasions. ④ Far-field measurement ④ Far-field measurement Before measures After measures EPS-02Ev3
- 6. 6 w w w. n o i s e k e n . c o m EPS-02Ev3 Helpful for the users to design good EMI performance circuit boards and to choose the best suited EMI suppression components Since all spectrum charts can be saved, the users can evaluate and compare the effectiveness of EMI suppression measures referring to the stored and accumulated data. No Effect Effective When designing a board, a comparison between the case where the ground routing is made into a pattern and the case where it is made a solid ground (Design of ground wiring) Measures as ferrite core Measures such as resistance Customer Credentials Now EMI debugging is my job On-site measurement On-site measurement Locating hot spots "The situation was like that before: when a product failed at a test house, the person in charge of the product asked for help from a trained and skillful engineer. Now the situation has dramatically changed like that: Even untrained or inexperienced engineers intensively tackle EMI debugging by using the EPS-02 system providing the visualization of the EMI properties of the test object. This can-do attitude is the greatest result of the introduction of the system." Quality Assurance Engineer, Quality Assurance Dept, "A" company "Our company chamber is used only for a complete finished product testing stressing there is no meaning for PCB or internal unit testing. PCB and unit basis measurements were R&D department's objective. As a valuable pre-compliance tool, this system helps us to visualize quickly and locate problems areas, thus dramatically improve debugging works. Before the introduction of this system, one prototype sample failed 4 to 5 times at chamber measurements. Now the number has dropped to 2." Design Engineer, R&D Department, "T" company The frequency of failures at measurements in a chamber has been reduced
- 7. E L E C T R O M A G N E T I C F I E L D V I S U A L I Z A T I O N S Y S T E M 7 w w w. n o i s e k e n . c o m Frequency range 100kHz ∼ 3GHz *Depends on the electromagnetic field probe specifications (The above is for ETS probes) Measurement unit dBμV、dBm Sensor/probe φ60 / 30 / 10mm loop coil (magnetic field), φ36mm ball (electric field), φ6mm tip (electric field) Total 5 types *Depends on electromagnetic probe specifications (Probe by ETS-Lindgren) Probe cable length 2m (N(P)-BNC(P) (Coaxial connector cable) Data recording method Single / Free Run / Max Hold / Max Peak Data* Auxiliary function Save / load / export / comment input / factor re-read / camera image retake / Save / load / export / comment input / factor re-read / camera image retake / up-down & right-left inversion of camera image / ghost display of camera image / Screen enlargement-reduction Compatible operating system Windows 7 / 10 System configuration Electromagnetic field probe (PN 7405) , BNC (P) -N (P) connector coaxial cable (02-000150A), Three Color Probe Head Cover (03-00111A), RF preamplifier (00-00019A), Spectrum analyzer, Control PC accessories LAN cable, NI-GPIB-USB-HS GPIB Controller, Camera, USB cable extension 2 m for camera, Tripod for camera, Software, USB protect key, Instruction manual EPS-02Ev3 Specifications *Peak Hold: Displays the trace data with the largest peak value from the trace data measured at each measurement point. Electromagnetic Field Probe (PN 7405) Frequency Specialization Model Type Electric field / Magnetic field Construction Recommended Frequency Band 901 6cm Loop Magnetic field Sealed loop 3MHz ∼ 500MHz 902 3cm Loop Sealed loop 5MHz ∼ 1GHz 903 1cm Loop Sealed loop 10MHz ∼ 3GHz 904 3.6cm Ball Electric field Spherical dipole 10MHz ∼ 3GHz 905 6mm Stub Tip Short monopole 50MHz ∼ 3GHz 901(6cm Loop) 902(3cm Loop) 903(1cm Loop) 904(3.6cm Ball) 905(6mm Stub Tip) ■ Magnetic field probe ■ Electric field probe "Our department is a user of the NoiseKen EPS-3000 EMI Board Scanner System. Compared to EPS-3000, this newly introduced EPS-02E provides a faster result. Portability is also a point. I'm very satisfied with measurement data, which I think, are more accurate than I expected." Design Engineer, Electrical Engineering Dept. "N" company Quick results are very helpful. An amplitude versus frequency plot for each probe position is helpful for effective EMI debugging "The objective is pre-compliance measurement. Only a combination of near-field probes and a spectrum analyzer was available before, which I thought was a time consuming debugging tool, if I can do it anyway. With the EPS-02, the way the data is stored and reviewed is much more convenient, as an amplitude versus frequency plot for each probe position can be seen. The benefits we are enjoying now are smoother EMI debugging, and the resultant reduced failures at a compliance measurement. Design Engineer, Electrical Engineering Dept. "S" company Drawings are for image only. (Not for actual use) Drawings are for image only. (Not for actual use) - Before measures - After measures
- 8. 8 w w w. n o i s e k e n . c o m EPS-02Ev3 Options -60 -50 -40 -30 -20 -10 0 10 20 㻜㻚㻜㻜 㻜㻚㻡㻜 㻝㻚㻜㻜 㻝㻚㻡㻜 㻞㻚㻜㻜 㻞㻚㻡㻜 㻟㻚㻜㻜 Factor[dB] Frequency[GHz] -70 -60 -50 -40 -30 -20 -10 0 10 20 㻜㻚㻜㻜 㻜㻚㻡㻜 㻝㻚㻜㻜 㻝㻚㻡㻜 㻞㻚㻜㻜 㻞㻚㻡㻜 㻟㻚㻜㻜 Factor[dB] Frequency[GHz] -80 -70 -60 -50 -40 -30 -20 -10 0 10 㻜㻚㻜㻜 㻜㻚㻡㻜 㻝㻚㻜㻜 㻝㻚㻡㻜 㻞㻚㻜㻜 㻞㻚㻡㻜 㻟㻚㻜㻜 Factor[dB] Frequency[GHz] -80 -70 -60 -50 -40 -30 -20 -10 0 10 㻜㻚㻜㻜 㻜㻚㻡㻜 㻝㻚㻜㻜 㻝㻚㻡㻜 㻞㻚㻜㻜 㻞㻚㻡㻜 㻟㻚㻜㻜 Factor[dB] Frequency[GHz] -90 -80 -70 -60 -50 -40 -30 -20 -10 0 10 㻜㻚㻜㻜 㻜㻚㻡㻜 㻝㻚㻜㻜 㻝㻚㻡㻜 㻞㻚㻜㻜 㻞㻚㻡㻜 㻟㻚㻜㻜 Factor[dB] Frequency[GHz] -60 -50 -40 -30 -20 -10 0 0.00 20.00 40.00 60.00 80.00 100.00 Factor[dB] Frequency[MHz] -70 -60 -50 -40 -30 -20 -10 0 0.00 20.00 40.00 60.00 80.00 100.00 Factor[dB] Frequency[MHz] -80 -70 -60 -50 -40 -30 -20 -10 0 0.00 20.00 40.00 60.00 80.00 100.00 Factor[dB] Frequency[MHz] -80 -70 -60 -50 -40 -30 -20 -10 0 0.00 20.00 40.00 60.00 80.00 100.00 Factor[dB] Frequency[MHz] -90 -80 -70 -60 -50 -40 -30 -20 -10 0 0.00 20.00 40.00 60.00 80.00 100.00 Factor[dB] ■100 kHz ∼ 100 MHz 901(6cm Loop) 902(3cm Loop) 903(1cm Loop) 904(3.6cm Ball) 905(6mm Stub Tip) ■100 kHz ∼ 3 GHz 901(6cm Loop) 902(3cm Loop) 903(1cm Loop) 904(3.6cm Ball) 905(6mm Stub Tip) *The frequency characteristics of the above probes are data using strip lines. *The gray area is outside the recommended frequency band. Item Specification OS Microsoft® Windows® 7 32 bit / 64 bit (Eng/Jap) Microsoft® Windows® 10 32 bit / 64 bit (Eng/Jap) CPU Intel Core™ i5 or higher (i7 or higher recommended) Memory 8 GB or more recommended Hard Disc min. 20 GB of free space Display over 1366x768 pixels ● A pointing device such as a mouse must be available. ● Existed DVD Drive. ● There is a free USB port. (Use 2 or 3 ports by using dongle, web camera, mouse etc.) * *The operation guarantee for using of an external USB-HUB is not covered. Recommended PC specifications Standard spectrum analyzer Rode Schwartz Spectrum analyzer FSV series、FSV3000 series FPL series、 EMI receiver ESR series、ESRP series Key sight Technology Signal analyzer N9010A、N9010B Tektronix Oscilloscope MDO4000 series Spectrum analyzer RSA306B Please inquire about other spectrum analyzers. Various type of probe head cover set. Camera image recognition is better in EPS-02 series by using probe head cover. The case accommodates an electromagnetic field probe (Model: PN7415) with the probe cover head attached. Also stored unused probe cover heads. Replacement probe head cover for "3-color probe cover head Model: 03-00110A." Pre-amplifier MODEL:00-00012A/14A/16A/19A Item Specifications/Performance Operating Frequency Range 00-00012A:9kHz ∼ 1GHz 00-00014A:500MHz ∼ 8GHz 00-00016A:9kHz ∼ 1GHz 00-00019A:10kHz ∼ 3GHz GAIN 00-00012A:36dB (typ) 00-00014A:47dB (typ) 00-00016A:46dB (typ) 00-00013A:43dB (typ) Input/Output Connector N-Female Size/Weight W160 × D230 × H94mm /約 3kg Accessories N(P)-N(P) connector coaxial cable 1m (00-00013A only) It is a high performance pre-amplifier that can be used for various applications such as the EPS-02 series. Three Color Probe Head Cover MODEL:03-00110A ReplacementThreeColorProbeHeadCover MODEL:03-00111A
- 9. E L E C T R O M A G N E T I C F I E L D V I S U A L I Z A T I O N S Y S T E M 9 w w w. n o i s e k e n . c o m Introduction of LANGER's Near Field Probe The electromagnetic field probe guiding as standard in the EPS-02Ev3 system is a near-field electromagnetic field probe manufactured by ETS-LINDGREN (MODEL: PN7405), but in this system, various other types of electromagnetic field probes can be used in combination. The electromagnetic field probe introduced below is a near-field probe manufactured by LANGER, Germany. A variety of probes; measurement of large components, single pin level, and assemblies. And also probes for low frequency and higher frequency both can measurements. Combination with EPS-02Ev3 very easy to use. Please contact our sales office for detailed specifications of various near-field probes and combinations with EPS-02Ev3. Near Field Probe Model: LF1 set The LF1 set is a set of 4 types of shielded probes for measuring magnetic fields from 100kHz to 50MHz on electronic assemblies. The probe head is designed for detection of single pins, larger components, and electromagnetic interference sources on the assembly. First, identify the large-scale sources with the LF-R 400 probe, and then use high-resolution probes such as LF-B 3, LF-U 5 and LF-U 2. 5 The magnetic field probe has a structure that suppresses the electric field component. *EPS-02Ev3 to be connect need conversion connector (MODEL: 02-00050A). Near Field Probe Model : RF1 set RF1 set is a set of 4 probes for measuring electric and magnetic fields from 30 MHz to 3 GHz on electronic assemblies. Each probe is suitable for measurements very close to the electronic assembly. Single IC pins, conductive paths, components to identify electromagnetic interference sources connect the connector and measure. By using these probes can check the direction of the magnetic field and the electric field distribution. The magnetic field probe has a structure that suppresses the electric field component. ※EPS-02Ev3 to be connect need conversion connector (MODEL:02-00050A) . 100kHz-50MHz Magnetic Field 30MHz∼3GH zElectric Field/ Magnetic Field Near Field Probe Model : RF2 set RF2 set is a set of 4 probes for measuring electric and magnetic fields from 30 MHz to 3 GHz on electronic assemblies. The probe head can step through the sources of interference from the RF magnetic field on the assembly. Initially, RF-R 400-1 and RF-R 50-1 probes can be used to detect far-field electromagnetic interference. Next, the higher resolution RF-B 3-2 and RF-U 5-2 probes allow for more accurate detection of interferers. By using these probes, can check the direction of the magnetic field and the electric field distribution. The magnetic field probe has a structure that suppresses the electric field component. *EPS-02Ev3 to be connect need conversion connector (MODEL:02-00050 30MHz∼3GH zElectric Field/ Magnetic Field Near Field Probe Model : RF3 mini set The RF3 mini set are two probes with a resolution of 1 mm or less to measure the magnetic field of 30 MHz to 3 GHz on the electronic assembly at the development stage. The probe head is designed for measurements. These probes can be used to detect the directivity and distribution of the magnetic field on the electronic assembly. The probe has a sheath structure and shields the electric field component. And also recommend using a 20 dB or 30 dB pre-amplifier when measuring this probe. *EPS-02Ev3 to be connect need conversion connector. (MODEL:02-00050A) 30MHz∼3GH zMagnetic Field Near Field Probe Model : RF4-E set The RF4-E set is a set of two probes for measuring electric fields in the frequency range 30 MHz to 3 GHz. This probe detects the electric field by capacitive coupling and the steep rise and falls of the digital pulse of the signal pin (foot and lead) of the IC, and detects a sharp switching (voltage) component generated on the power supply pin of the IC. This probe has a function to suppress detection of current components (magnetic field components). *EPS-02Ev3 to be connect need conversion connector. (MODEL:02-00050A) 30MHz∼3GH zElectric Field LF-B3 LF-R400 LF-U2.5 LF-U5 RF-K 7-4 RF-E10 RF-R 3-2 RF-U 2.5-2 RF-R 400-1 RF-R 50-1 RF-U 5-2 RF-B 3-2 RF-E 02 RF-E 05 RF-B 0.3-3 RF-R 0.3-3
- 10. 10 w w w. n o i s e k e n . c o m Near Field Probe Model : XF1 set The XF1set consists of four magnetic field probes and one E field probe, can measure within magnetic fields from 30 MHz to 6 GHz. The probe head enables step-by-step localization of magnetic field interference sources on the assembly. First, use the XF-R 400-1 probe to detect electromagnetic interference from a distance. Second, you can use a high-resolution probe to detect interference sources more accurately. E-field probes are used to detect electrical interference fields near the assembly. By using these probes, it is possible to detect the direction of the magnetic field and the electric field distribution on the electronic assembly. The magnetic field probe has a structure that suppresses the electric field component. *EPS-02Ev3 to be connect need conversion connector. (MODEL:02-00137A) 30MHz∼6GH zMagnetic Field Near Field Probe Model : SX1 set The SX1 set consists of three passive type near-field probes for measuring magnetic fields and also magnetic fields with high clock frequencies of 1 GHz to 10 GHz on electronic components and ICs at development stage. The probe head allows measurements at distances very close to the electronic assembly. They can be placed on single IC pins, conductive paths, components and connectors to identify sources of interference. By using these probes, the direction of the magnetic field and the electric field distribution of the electronic assembly can be detected. *EPS-02Ev3 to be connect need conversion connector. (MODEL:02-00137A) 1GHz∼10GH zElectric Field/ Magnetic Field Near Field Probe Model : RF6 set The RF6 set is for the generation of electric and magnetic fields in the range 30 MHz to 3 GHz of the electronic assembly set of 4 probes for measurement. The probe head enables step-by-step localization of RF magnetic and RF-E magnetic interference sources on the assembly. From larger distances, use RF-R50-1 for magnetic fields and RF-E02 for electric fields to detect electromagnetic interference. The higher resolution RF-B 3-2 and RF-E 10 probes can better detect magnetic field and E-field interferers. By using these probes, it is possible to detect the direction of the magnetic field and the electric field distribution on the electronic assembly. The magnetic field probe has a structure that suppresses the electric field component. *EPS-02Ev3 to be connect need conversion connector. (MODEL:02-00050A) 30MHz∼3GH zElectric Field/ Magnetic Field Conversion Connector Model:02-00050A/137A Model Connector Support Model 02-00050A N(P)-BNC(J) LF1 set, RF1 set, RF2 set, RF3 mini set, RF4-E set, RF6 set 02-00137A N (P)-SMA(J) XF1 set, SX1 set It is a conversion connector for connecting LANGER near field probe to EPS-02Ev3. LANGER near-field probes are not using probe cover. At the time of use probe, wrapped with vinyl tape or other on the tip of the probe that can make color recognition. In addition, a coaxial conversion connector is required to connect to EPS-02Ev3. (See below) Please contact our sales in charge for details. RF-R 50-1 RF-B 3-2 RF-E 02 RF-E 10 SX-E 03 SX-B 3-1 SX-R 3-1 XF-B 3-1 XF-R 400-1 XF-U 2.5-2 XF-E 10 XF-R 3-1 Introduction of LANGER's Near Field Probe ● International Sales & Marketing Section TEL : +81-(0)42-712-2051/FAX : +81-(0)42-712-2050 E-mail : sales@noiseken.com URL : http://www.noiseken.com 1-4-4 Chiyoda, Chuo-ku, Sagamihara City, Kanagawa Pref. 252-0237 Japan * Designs, appearances and specifications on the products are subject change without notice. * Designs, appearances and specifications on the products are subject change without notice. https://www.n-denkei.com/singapore/inquiry/