Updated 2018 Socioeconomic Report of Region XII
•
0 recomendaciones•975 vistas

This 3 sentence summary provides an overview of the key points from the socioeconomic report on the SOCCSKSARGEN region for CY 2018: The report assessed the region's economic performance in 2018, finding improvements in production for several crops and livestock as well as employment, but declines in some crops, investments, and inflation. While crime decreased and tourism increased, critical incidents like a tax reform law and typhoon damage to irrigation systems impacted the economy. In general, the region saw mixed results with growth in some areas and declines in others compared to 2017.

Recomendados
Recomendados
Más contenido relacionado
La actualidad más candente
La actualidad más candente (20)
Similar a Updated 2018 Socioeconomic Report of Region XII
Similar a Updated 2018 Socioeconomic Report of Region XII (20)
Más de National Economic and Development Authority XII
Más de National Economic and Development Authority XII (20)
Último
Último (20)
Updated 2018 Socioeconomic Report of Region XII
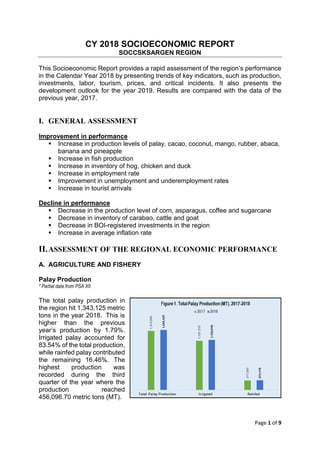
- 1. Page 1 of 9 CY 2018 SOCIOECONOMIC REPORT SOCCSKSARGEN REGION This Socioeconomic Report provides a rapid assessment of the region’s performance in the Calendar Year 2018 by presenting trends of key indicators, such as production, investments, labor, tourism, prices, and critical incidents. It also presents the development outlook for the year 2019. Results are compared with the data of the previous year, 2017. I. GENERAL ASSESSMENT Improvement in performance Increase in production levels of palay, cacao, coconut, mango, rubber, abaca, banana and pineapple Increase in fish production Increase in inventory of hog, chicken and duck Increase in employment rate Improvement in unemployment and underemployment rates Increase in tourist arrivals Decline in performance Decrease in the production level of corn, asparagus, coffee and sugarcane Decrease in inventory of carabao, cattle and goat Decrease in BOI-registered investments in the region Increase in average inflation rate II.ASSESSMENT OF THE REGIONAL ECONOMIC PERFORMANCE A. AGRICULTURE AND FISHERY Palay Production * Partial data from PSA XII The total palay production in the region hit 1,343,125 metric tons in the year 2018. This is higher than the previous year’s production by 1.79%. Irrigated palay accounted for 83.54% of the total production, while rainfed palay contributed the remaining 16.46%. The highest production was recorded during the third quarter of the year where the production reached 456,096.70 metric tons (MT).
- 2. Page 2 of 9 The surge in total production manifests a positive sign since the total harvested area decreased by 0.77%. The region’s total harvested area for palay only reached 348,480 hectares compared to 351,177 hectares in the year 2017. Around 79% of the area were irrigated, while only 21% were rainfed. Table 1. Palay Production in MT and Growth Rate, 2017 and 2018 (P) *In metric tons 2017 2018 % Change (Year-on-year) TOTAL 1,319,505 1,343,125 1.79% Irrigated 1,101,570 1,122,010 1.86% Rainfed 217,935 221,115 1.46% Source: PSA XII Corn Production * Partial data from PSA XII The region recorded a 2.08% decrease in total corn production. There were only around 1,231,074 MT of corn produced in 2018. This figure is 26,103 MT lesser compared to the total production in 2017. The highest corn production was also recorded during the third quarter, both for yellow corn and white corn varieties. Although yellow corn production decreased by 2.32%, it still accounted for 81% of the total corn production. White corn, on the other hand, also declined by 1.01% compared to the previous year and contributed 19% to the total corn products of the region. Table 2. Corn Production in MT and Growth Rate, 2017 and 2018 (P) *In metric tons 2017 2018 % Change (Year-on-year) TOTAL 1,257,177 1,231,074 -2.08% White 231,011 228,671 -1.01% Yellow 1,026,166 1,002,403 -2.32% Source: PSA XII
- 3. Page 3 of 9 High Value Commercial Crop Production * Partial data from PSA XII Of the top ten (10) high-value crops in the region, decreases in production for 2018 were recorded only for three (3) types of HVCs, namely: asparagus, coffee, and sugarcane. Increase in production for 2018 was recorded for abaca, banana, cacao, coconut, mango, pineapple and rubber. The highest growth was recorded by cacao with 43.65%, followed by coconut and mango with 17.68% and 10.80%, respectively. Cacao production climbed to 157.01 MT in 2018 from 109.27 MT in 2017 which was attributed to sufficient rainfall during the fruiting stage of cacao and the increase in productive areas harvested in Cotabato Province. Abaca production also rose by 4.88% and rubber with 4.20%. Compared to the production in 2017, banana grew by 31,030.25 metric tons, while pineapple by 13,200.24 metric tons in 2018. On the other hand, the highest decline in production was recorded by asparagus with 9.01% decrease in 2018 because of low market demand which led farmers to shift to the production of other crops. Meanwhile, harvesting activities which were hampered by frequent rainfall led to a 7.94% reduction in sugarcane production. A slight decline of 0.33% was recorded in the production of coffee in 2018. Table 3. Top 10 Major Crop Production in MT and Growth Rate, 2017 and 2018 HVCC 2017 2018 % Change (Year-on-year) Abaca 1,062.83 1,114.65 4.88% Asparagus 1,885.77 1,715.92 -9.01% Banana 1,167,203.00 1,198,233.25 2.66% Cacao 109.27 157.01 43.69% Coconut 938,162.31 1,103,984.88 17.68% Coffee 22,118.79 22,046.16 -0.33% Mango 47,797.23 52,961.59 10.80% Pineapple 792,054.06 805,254.30 1.67% Rubber 147,480.00 153,677.73 4.20% Sugarcane 684,402.54 630,070.11 -7.94% Source: PSA XII Livestock and Poultry Production Duck inventory in the region recorded the highest percentage increase of 9.37%, from 5,508,253 heads in 2017 to 6,024,409 heads in 2018. The growth was attributed to the high demand for duck eggs which resulted to the increase in laying flocks and the establishment of additional commercial farms in the province of Sarangani. The chicken and hog inventory in the region also increased in 2018 compared to the previous year. Chicken inventory increased to 40,871,840 which is 9.30% higher than that of the previous year. This gain was brought by the increased number of
- 4. Page 4 of 9 commercial broiler farms in South Cotabato which was influenced by higher prices and better demand for chicken meat in the market. Hog inventory also increased to 3,216,127 which is 4.64% higher than the previous year’s inventory. In contrast, the inventory of goat, cattle and carabao in the region declined in 2018 compared to 2017. The drop in goat population to 887,083, which is 1.36% lower than in 2017, was attributed to the higher demand for chevon in Cotabato Province and South Cotabato which resulted to more disposal of the livestock. Carabao inventory in 2018 fell to 815,631, which is 0.78% reduction from the previous year’s, because of the continued process of farm mechanization which led to the decreasing demand for working animals. A minimal decrease was recorded for cattle, which dropped to 796,925 in 2018 from 801,265 in 2016. Table 4. Livestock and Poultry Inventory and Growth Rate, 2017 and 2018 Livestock 2017 2018 % Change (Year-on-year) Carabao 822,059 815,631 -0.78% Cattle 801,265 796,925 -0.54% Hog 3,073,483 3,216,127 4.64% Goat 899,321 887,083 -1.36% Chicken 37,392,527 40,871,840 9.30% Duck 5,508,253 6,024,409 9.37% Source: PSA XII Fish Production The total fish production in the region increased by 2.94% from 322,244 metric tons in 2017 to 331,710 metrics tons in 2018. Municipal inland, commercial and aquaculture fishing posted 5.03%, 4.50% and 3.39% growth, respectively. The increase in the production of commercial fishing resulted from the unloading of
- 5. Page 5 of 9 more volumes of frozen tuna for cold storage and tuna canneries, particularly the big- eyed and yellow fin varieties. Municipal marine fishing production, however, decreased by 26.89% due to the lower catch of big-eyed scad, frigate tuna and round scad in the municipal waters of the region. Table 5. Fish Production in MT and Growth Rate, 2016 and 2017 Type of Fishing 2017 2018 % Change (Year-on-year) Commercial 275,163 287,551 4.50% Municipal Inland 18,734 19,677 5.03% Municipal Marine 15,934 11,649 -26.89% Aquaculture 12,413 12,834 3.39% TOTAL 322,244 331,710 2.94% Source: PSA XII B. INVESTMENTS In 2018, the region received an amount of more than four billion pesos (PhP 4 Billion) worth of investments which availed of incentives from the Department of Trade and Industry’s Board of Investments (BOI) compared to more than fifteen billion pesos (PhP 15 Billion) in 2017. Other investments in the region which did not avail of BOI incentives are not yet included in this figure. Of the twelve (12) approved projects in 2018, six (6) were located in General Santos City, five (5) in South Cotabato, specifically in the municipalities of Surallah, Banga and Tantangan, and one (1) in M’lang, Cotabato Province. Moreover, these investment projects generated a total of 583 jobs for the people of the region which is 53.84% lower than the jobs created in 2017. Table 6. BOI-approved Investments, 2017 and 2018 Indicator 2017 2018 Project Cost (Php in millions) 15253.15 4143.66 Number of Projects 12 12 Jobs Created 1263 583 Source: BOI C. PRICES AND INFLATION Prices for all commodities in the region posted an average of PhP 120.6 in 2018 against PhP 113.6 in 2017. This reflected an inflation rate of about 6.2% for 2018.
- 6. Page 6 of 9 During the last quarter of the year, alcoholic beverages and tobacco posted the highest average inflation rate of 21.8%, followed by food and non-alcoholic beverages with an average inflation rate of 6.9. On the other hand, education posted a decrease in average prices with a negative 1.8 inflation rate during the last quarter of 2018. Source: PSA XII D. LABOR AND EMPLOYMENT The region’s population of 15 years old and above grew by 2.05% in 2018 as compared in 2017. Labor force participation rate in 2018 was placed at 61.70% which is 0.76 % lower than of the previous year. Employment rate slightly increased from 96% in 2017 to 96.10% in 2018. On the other hand, the unemployment and underemployment rates improved in 2018 as compared with the previous year at 3.9% and 17.0%, respectively. Table 8. Labor and Employment, 2017 and 2018 Source: PSA XII E. PEACE AND SECURITY The total number of recorded crimes in the region dropped to 18,548 in 2018 from 21,271 in the previous year. Around 7,572 of these are index crimes, while 14,976 112.0 112.5 112.8 112.7 113.0 113.5 113.4 114.0 114.0 114.4 115.0 115.9 117.4 118.0 118.2 118.6 119.1 120.2 120.8 123.0 123.4 123.4 122.9 122.4 110.0 115.0 120.0 125.0 Jan Feb Mar Apr May Jun Jul Aug Sep Oct Nov Dec Figure 7. Consumer Price Index, 2017-2018 2012=100 2017 2018 Indicator 2017 2018 % Change (Year-on-year) Population 15 Years Old and Over (in thousands) 3,086 3,150 2.05% Labor Force Participation Rate 62.2 61.70 -0.76% Employment Rate 96.00 96.10 0.04% Unemployment Rate 4.0 3.90 -0.99% Underemployment Rate 17.9 17.0 -5.42
- 7. Page 7 of 9 were non-index crimes. Moreover, there were 15,151 of the total crimes were cleared while 13,506 were solved. Index crimes are defined as crimes against persons and property while non-index crimes are crimes committed and punishable by special laws. It can be noted that although there was 2.32% growth in non- index crimes, index crimes plunged by 46.16%. Likewise, crime clearance efficiency improved to 81.69% from 60.13% in 2017, while crime solution efficiency hit 72.82% from 49.58%. In summary, through the efforts of the Police Regional Office (PRO) XII and other enforcement agencies, and the cooperation of stakeholders, the year 2018 made a lot of remarkable positive changes in reducing the number of crimes and increasing the crime clearance and solution efficiencies in the region. Table 9. Crime Statistics, 2017 and 2018 Indicator 2017 2018 % Change (Year-on-year) Total Crime Volume 21,271 18,548 -12.80% Index Crimes 6,635 3,572 -46.16% Non-Index Crimes 14,636 14,976 2.32% Total Crimes Cleared 12,790 15,151 18.46% Total Crimes Solved 10,546 13,506 28.07% Crime Clearance Efficiency (%) 60.13% 81.69% 35.85% Crime Solution Efficiency (%) 49.58% 72.82% 46.87% Source: PRO XII F. TOURISM A total of 6,610,511 tourists visited the region in 2018. This is 33.68% higher than the tourist arrivals in the previous year. Sarangani and General Santos City were the most visited places in the region with more than a million and a half tourist arrivals in 2018. Moreover, Kidapawan City recorded the highest percentage increase of 199.78% in 2018 from 2017.
- 8. Page 8 of 9 Meanwhile, the SOCCSKSARGEN was home to 140 foreign nationals in 2018, according to the Bureau of Immigration (BI) while the number of foreign retirees based in the region increased to 33 from 28 in 2017, based on the report of the Philippine Retirement Authority (PRA). Table 10. Tourist Arrivals by Area, 2017 and 2018 Source: DOT XII III. CRITICAL INCIDENTS Republic Act No. 10963 or popularly known as the Tax Reform for Acceleration and Inclusion (TRAIN) law took effect in the first quarter of 2018 which reduced the personal income tax of an individual taxpayer and resulted to a higher take-home pay for the income earner. Its implementation affected the inflation rate for some commodities, goods and services in the country. The surge in oil price in 2018 also influenced the increase in prices experienced in 2018. In the second quarter of 2018, palay production in the region decreased because of the damage of irrigation systems that served rice fields. This was mainly due to the onslaught of Typhoon Vinta in December 2017. IV. DEVELOPMENT OUTLOOK 1. Economic activities and performance in SOCCSKSARGEN Region will continue to improve in 2019 with the proliferation of real estate, retail groups, commercial banks, fast-food chains and other service-oriented industries in the different cities of the region, as well as in the emerging new urban areas of Midsayap, Kabacan, Alabel, Glan, Surallah, Polomolok, Lebak and Isulan. 2. The ongoing rehabilitation of General Santos International Airport will improve connectivity of the region to other economies. This will be complemented by the Build Build Build initiatives of the national government that is spearheaded by DPWH and considered to be labor-intensive. It is expected that said infrastructure Area 2017 2018 % Change (Year-on-year) Sarangani 1,231,714 1,689,348 37.15% General Santos City 1,572,293 1,595,759 1.49% Cotabato Province 617,928 776,046 25.59% Kidapawan City 225,615 676,340 199.78% South Cotabato 427,230 633,337 48.24% Cotabato City 296,874 392,851 32.33% Koronadal City 200,120 354,779 77.28% Tacurong City 234,198 292,585 24.93% Sultan Kudarat 139,056 199,466 43.44% Total 4,945,028 6,610,511 33.68%
- 9. Page 9 of 9 projects will directly contribute to increasing investments or enhance economic opportunities in the region. 3. The continuing implementation of Presidential Proclamation 216, series of 2017 in Mindanao remains to be a vital element in ensuring security, safety, and peace and order in the region. 4. With the passage of the laws establishing SOCCSKSARGEN General Hospital and South Cotabato State College in the municipality of Surallah, people in the region will have better access to health care services and opportunities that will ultimately develop their full potential which would allow them to compete globally. 5. Various mitigating measures are implemented by different government agencies, particularly the Department of Agriculture (DA) XII, to address the adverse effects of El Niño phenomenon, especially in the agriculture sector. 6. Inflation rate in the region is expected to ease down to the level set in the SOCCSKSARGEN Regional Development Plan (RDP) 2017-2022 due to the normalization of the prices of goods and commodities. 7. The campaign period and the conduct of midterm elections on May 13, 2019 shall spur economic activities in the services sector (e.g., transport, accommodation, restaurants, printing press, and etc.) due to the expected election spending of national and local candidates, as well as their political parties and supporters. SOURCES: Board of Investments, Makati City Bureau of Immigration, Manila Department of Tourism (Regional Office XII), Koronadal City Department of Trade and Industry (Regional Office XII), Koronadal City Philippine Retirement Authority, Makati City Philippine Statistics Authority (Regional Office XII), Cotabato City