

Recomendados
Recomendados
Más contenido relacionado
La actualidad más candente
La actualidad más candente (20)
Destacado
Destacado (20)
Similar a Impact of Capital Structure
Similar a Impact of Capital Structure (20)
Último
Último (20)
Impact of Capital Structure
- 1. ijcrb.webs.com JULY 2011 INTERDISCIPLINARY JOURNAL OF CONTEMPORARY RESEARCH IN BUSINESS VOL 3, NO 3 Impact of Capital Structure on Stock Price of Cement Sector in Pakistan M. Nehal Hussain Muhammad Ali Jinnah University Islamabad Pakistan Sana Gull Riphah International University Islamabad Pakistan Abstract This study investigates the relationship between capital structure and stock price. Current study uses Debt to Equity Ratio, Debt to asset ratio, interest Coverage Ratio as an independent variable and stock price of company as dependent variable to investigate the relationship between capital structure and stock price. Study based on cement sector, eleven companies was selected actively trading in Karachi Stock Exchange during the period 2005 to 2009.Secondary data is collected through financial statements of companies and stock prices will be collected from Karachi Stock Exchange. Descriptive statistics, simple and multiple regression analysis is applied to find out the relationship of firm. However, we found that, there is negative relationship between capital structure and stock price. The present study is a unique contribution in the existing literature of finance in the context of emerging market like Pakistan. Key Words: Capital Structure, Stock Price, Pakistan. 1. Introduction The firm can choose a mix of financing options to finance its assets so that its overall value can be maximized and this is known as the capital structure of the firm. The seminal work of Miller & Modigliani (1958) showed that the market value of a firm is determined by its earning power and the risk of its underlying assets, and is independent of the way it chooses to finance its investments or distribute dividends. Remember, a firm can choose between three methods of financing: issuing shares, borrowing or spending profits (as opposed to dispersing them to shareholders as dividends). The theorem gets much more complicated, but the basic idea is that under certain assumptions, it makes no difference whether a firm finances itself with debt or equity. In Pakistan, there are more than 25 small and large cement manufacturers operating within the country producing ordinary grey Portland, white, slag and sulphate resistant varieties of cements. This industry has an oligopolistic structure because the product is homogenous. The cement industry in Pakistan has grown gradually with the passage of time. At the time of independence there were only four units with total production capacity of nearly half a million tons per annum. By 1972 the number of cement plants increased to 14 and the production capacity also increased to 2.5 million tons. Both public and private sectors took initiative to establish new plants. As was the case for other industries, the cement industry was also nationalized in 1972 and the State Cement Corporation of Pakistan (SCCP) was established and given the responsibility to manage the production of cement in the country. Considering the higher cement demand as compared to supply, cement import was also allowed in FY 76-77 that continued until FY 94-95. With a change in policy of state control over industrial units, the state owned cement plants were also put-up for privatization along with other industries. The private sector was allowed to invest in the cement manufacturing. Consequently, the role of COPY RIGHT ? 2011 Institute of Interdisciplinary Business Research
- 2. ijcrb.webs.com JULY 2011 INTERDISCIPLINARY JOURNAL OF CONTEMPORARY RESEARCH IN BUSINESS VOL 3, NO 3 SCCP as market leader vanished gradually and currently it owns only four plants, of which two have been closed down on efficiency and profitability grounds. In view of the higher demand during the period of de-regulation and liberalization, a number of new units were set up and many others invested heavily to increase their existing production capacity. As a result, the production capacity has reached 17.7 million tons per annum during 2003. There are 29 cement production units in the country. Up to May 2007, the total installed cement production capacity is 36.841 million tones. By the end of June 2011, the installed cement production capacity will touch to the level of 49.579 million tones. Due to political instability and lack of allocation of funds for public sector development program, cement industry of Pakistan was in the recession phase had registered an average growth rate of 2.96% for the period from 1990 to 2002. For the period from 2003 to 2007 cement industry of Pakistan had registered an average growth rate of 20%. The boost in cement sector is because of the rising construction activity in the country, reconstruction activity in Afghanistan and increasing development expenditure by the government. There are four foreign companies, three armed forces companies and 16 private companies listed in the stock exchanges. The industry is divided into two broad regions, the northern region and the southern region. The northern region has over 87 percent share in total cement dispatches while the units based in the southern region contributes 13 percent to the annual cement sales. The cement industry of Pakistan entered the export markets a few years back, and has established its reputation as a good quality product. The latest information is that India will import more cement from Pakistan. So far 130,000 tones cement has been exported to the neighboring country. During the financial year-07, cement sales registered a growth of 31 percent to 17.53 million tones as against 13.5 million tones sold last year. The cement sales during July-February-08 showed an increase, both in domestic and regional markets to 18.17 million tones. The domestic sales registered an increase of 7.2 percent to 14.4 million tones in the current period as compared to 13.5 million tones last year whereas exports stood at 3.7 million tones as against 1.8 million tones in the corresponding period last year, showing an increase of 110 percent. The government is considering allowing further concessions and additional incentives for cement export, with a view to increase overall export volume. These measures will immensely help in promoting and protecting high investments made in cement sector in recent years. In the wake of its huge surplus production as a result of massive capacity expansion undertaken it rather seems. Imperative for Pakistani cement industry, on one hand, to sustain existing export markets and, on the other, explore new markets. In FY08 to-date, Pakistan cement industry brought in 5.84 million tons of new capacity of cement production taking the total cement capacity to 36.1 million tons. This includes DG Khan’s new Khairpur plant & Maple Leaf’s new production line of 2.1 million tons each and some other additions of 1.8 million tons. Going forward, Lucky Cement with its 2 new lines of 1.26 million tons capacity each and Fauji Cement with its 2.1 million tons new line are expected to come online. With these additions and other expansions, the total industry installed capacity is expected to reach 49.1 million tons per annum by FY10. Pakistan has already joined the world club of cement exporters, with 48th ranking among a total of 116 exporting countries, having attained recently an export figure of USD 33.24 million. Some of the big players from Pakistan who can possibly play a major role in the export of cement to India are Lucky Cement, the largest cement producer in the country, DG Khan Cement Co, Bestway Cement, Maple Leaf Cement, Attock Cement, among others. COPY RIGHT ? 2011 Institute of Interdisciplinary Business Research
- 3. ijcrb.webs.com JULY 2011 INTERDISCIPLINARY JOURNAL OF CONTEMPORARY RESEARCH IN BUSINESS VOL 3, NO 3 1.1. Significance of the study Capital structure is one of the most important characteristics of a firm. Many theories suggest that a change in the capital structure indicates a change or review of the firm value, which should therefore have an impact on stock prices. Examining the relationship between capital structure and stock price of Pakistan cement sector will clearly show that capital structure has positive or negative relationship with stock price. The result will help investors to invest in cement sector, because capital structure matters to firm value. Changes in capital structure have an impact on stock price. Change in debt and equity effect stock price. For example, if the dynamic pecking order theory holds, increase in debt may result in a decrease in the stock price. On the other hand, according to trade-off theory, a deviation from the optimal capital structure (either increase or decrease) would result in a lower stock price. 1.2. Objectives of the study The objectives of the study are followings: ¾ To Study the way firms structures their capital structure. ¾ To examine the relation between capital structure and stock prices. ¾ To provide guidance to the investor to invest in cement industry of Pakistan. ¾ To study impact of change in debt equity ratio and its impact on the stock price of a particular cement firm and industry as a whole. 2. Literature Review Many finance theories predict that the capital structure matters to firm value, which implies that the changes in leverage have an impact on stock returns. We propose and test several hypotheses to explain the observed relationship. We find the negative relation is stronger for the firms with higher leverage level. This is consistent with a dynamic view of the pecking-order model that increase in leverage reduces firms’ debt capacity and may lead to future underinvestment. In addition, the long-term debt plays a more important role in this relation than the short-term debt, and the leverage change has no impact on future stock return, both of which are inconsistent with the default risk premium hypothesis. Deviation from the target leverage ratio has no impact on contemporaneous stock returns, which is inconsistent with the trade-off theory. Further tests on leverage change and future operating performance do not support the view that increase in leverage signals bad news for future performance of the firm in our sample. Overall, our evidence favors the dynamic pecking-order theory over other capital structure theories. (Cai and Zhang, 2005) It is well known that firms are more likely to issue equity when their market values are high, relative to book and past market values, and to repurchase equity when their market values are low. We document that the resulting effects on capital structure are very persistent. As a consequence, current capital structure is strongly related to past market values. The results suggest the theory that capital structure is the cumulative outcome of past attempts to time the equity market. (Baker and Wurgler, 2002) This paper is an empirical study that tests the relationship between leverage and stock returns. We investigate this relationship by undertaking a portfolio level analysis of leverage and expected returns using the Fama-Macbeth (1973) methodology with modifications. We find that returns increase in leverage which is consistent with the findings of Miller-Modigliani (1958). We also undertake linearity tests. Results are robust to other risk factors. (Sivaprasad and Muradoglu, 2007) Leverage is an important risk factor which has been ignored in the asset pricing literature. This paper attempts to broaden the focus of the current asset pricing literature COPY RIGHT ? 2011 Institute of Interdisciplinary Business Research
- 4. ijcrb.webs.com JULY 2011 INTERDISCIPLINARY JOURNAL OF CONTEMPORARY RESEARCH IN BUSINESS VOL 3, NO 3 by forming portfolios mimicking the leverage factor. Returns are ranked according to leverage and grouped into two groups of high and low to demonstrate the risk factor of leverage in stocks. We argue that leverage is an important stock-market factor that explains stock returns. We also undertake robustness checks with the Fama-French (1993) factors of size, market-to-book and excess returns on market. Our results show that our leverage mimicking portfolio capture the variations in stock returns better relative to the other asset pricing models. (Sivaprasad and Muradoglu, 2008). Using a panel of 425 European firms over the period from 1990 to 2005, we revisit Welch’s (2004) finding that stock returns are the primary determinant of capital structure changes and that the corporate motives for issuing activities remain largely unexplained. We document that about half of the variation in leverage can be explained by stock return-induced effects over both 1-year and 5-year horizons. In contrast to the US evidence, corporate issuing activities are not as pronounced in our European sample, but they seem nevertheless sufficient for firms to maintain a target debt ratio in the long run. Therefore, our results are also consistent with recent evidence for dynamic rebalancing of the capital structure within a target range in the presence of adjustment costs. In a horse race with stock returns, traditional capital structure variables are inferior in explaining corporate leverage ratios and readjustment in response to return-induced changes in the short run, but they retain a significant role in the long run. This is an empirical study that investigates the effect of firm’s leverage on stock returns. We start with the explicit valuation model of Modigliani and Miller (1958) and expand the model further to test the relation between stock returns and firms’ leverage. Modigliani and Miller (1958) conduct their empirical tests exclusively in the utilities and oil and gas industries. We conduct our tests in all risk classes. Modigliani and Miller (1958) conduct their tests in the cross section for one year whereas we employ a rich panel dataset. They use balance sheet definitions for return to equity while we use stock returns. Our leverage definition takes into account the cash flows generated through debt financing, following Schwartz (1959). We control for other risk factors. We first conduct the analysis at the firm level and then at the portfolio level to include factor mimicking portfolios for size, book-to market, market risk and momentum. We find that for utilities, returns increase in leverage which is consistent with the findings of Modigliani and Miller (1958) and Bhandari (1988). But for the other sectors, the relationship is negative which is similar with the more recent work of Korteweg (2004), Dimitrov and Jain (2005) and Penman (2007). Results are robust to other risk factors and level of analysis. We conclude that the contradicting empirical results in literature are mainly due to the restrictions in the samples used. The positive relationship between leverage and stock returns is unique to utilities, a risk class that is highly regulated and has high concentration of leverage ratios. (Muradoglu and Sivaprasad, 2008) The value of a firm’s securities measures the value of the firm's productive assets. If the assets include only capital goods and not a permanent monopoly franchise, the value of the securities measures the value of the capital. Finally, if the price of the capital can be measured or inferred, the quantity of capital is the value divided by the price. A standard model of adjustment costs enables the inference of the price of installed capital. Data from U.S. corporations over the past 50 years imply that corporations have formed large amounts of intangible capital, especially in the past decade. (Hall, 2001) This paper attempts to determine the capital structure of listed firms in the cement industry of Pakistan. The study finds that a specific industry’s capital structure exhibits unique attributes which are usually not apparent in the combined analysis of many sectors as done by Shah & Hijazi (2005). The study took 16 of 22 firms in the cement sector, listed at the Karachi Stock Exchange for the period 1997-2001 and analyzed the data by using pooled regression in a panel data analysis. Following the model developed by Rajan COPY RIGHT ? 2011 Institute of Interdisciplinary Business Research
- 5. ijcrb.webs.com JULY 2011 INTERDISCIPLINARY JOURNAL OF CONTEMPORARY RESEARCH IN BUSINESS VOL 3, NO 3 & Zingle (1995) it has chosen four independent variables i.e. firm size (measured by natural log of sales), tangibility of assets, profitability and growth and further analyzed the effects on leverage. The results, except for firm size, were found to be highly * significant. (Syed Tahir Hijazi Yasir Bin Tariq, 2006). This paper provides a competitive equilibrium model of capital structure and industry dynamics. In the model, firms make financing, investment, entry, and exit decisions subject to idiosyncratic technology shocks. The capital structure choice reflects the tradeoff between the tax benefits of debt and the associated bankruptcy and agency costs. The interaction between financing and production decisions influences the stationary distribution of firms and their survival probabilities. The analysis demonstrates that the equilibrium output price has an important feedback effect. This effect has a number of testable implications. For example, high growth industries have relatively lower leverage and turnover rates. (Miao, 2005) An ongoing argument in financial management has been how to craft a capital structure which maximizes shareholder wealth. This question has gained prominence within the strategic management field because of the apparent link between capital structure and the ability of firms to literature, we are able to theorize that a firm’s capital structure is influenced by environmental dynamism, and that the match between environmental dynamism and capital structure is associated with superior economic performance. Our large-scale empirical analyses provide supportive evidence for the proposition that competitive environments moderate the relationship between capital structure and economic performance. From a theoretical standpoint, these findings provide another link between capital structure and corporate strategy. More importantly, we are able to move the discussion beyond the limitations of financial risk and incorporate the strategy concept of decision making under uncertainty. For practical application, these findings offer informed advice for managers on how to craft a capital structure. (Simerly and Mingfang, 2000) This study examines the influence of institutions on the capital structure and debt maturity choices in a cross-section of firms in 39 developed and developing countries. Our evidence indicate that firms operating within legal systems that provide better protection for financial claimants tend to have capital structures with less total debt, and more long-term debt as a proportion of total debt. In addition, we find that firms that choose to cross-list tend to use more equity and longer-term debt. We also find that taxes and the characteristics of the financial institutions that supply capital have an influence on how firms are financed. Finally, we find that the cross-sectional determinants of leverage differ across countries. In particular, the relationship between profitability and leverage tends to be stronger in countries with weaker shareholder protection. (Fan, Titman and Twite, 2008) Political institutions play a role in shaping factor mobility across sectors, space, and borders. I provide an illustration of this accepted, though hardly researched, idea by looking at the emergence of modem capital markets in the nineteenth century. The rise of corporate finance threatened to redeploy financial resources away from land and traditional sectors to heavy industry. I argue that mobilized and integrated markets flourished in the absence of blocking coalitions that had an interest in keeping finance local. I argue and show that the power of blocking coalitions was a reverse function of the degree of centralization of state institutions. I start by providing a conceptual interface between the abstract notion of capital used in trade models and the diversity of its actual occurrences as cash, debt, equity, buildings, patent, machinery, and so forth. (Verdier, spring 2001). We study simultaneous investment and financing decisions made by incumbent owners in the presence of capital market imperfections. We present a theory for how the COPY RIGHT ? 2011 Institute of Interdisciplinary Business Research
- 6. ijcrb.webs.com JULY 2011 INTERDISCIPLINARY JOURNAL OF CONTEMPORARY RESEARCH IN BUSINESS VOL 3, NO 3 optimal combination of debt and equity financing depends on the firm's internal funds. We identify complementarities between the two financial instruments. We test these predictions empirically with panel data on 3,119 corporations in the COMPUSTAT database. Our estimates using instrumental variable techniques support our theoretical predictions regarding the link between internal funds and capital investments, as well as the interaction effects between debt and new equity. We explore implications for managers, financiers, and policy makers. (Stenbacka and Tombak, 2002) This paper presents a continuous time model of a firm that can dynamically adjust both its capital structure and its investment choices. The model extends the dynamic capital structure literature by endogenizing the investment choice as well as firm value, which are both determined by an exogenous price process that describes the firm’s product market. Within the context of this model we explore interactions between financial distress costs and debt holder/equity holder agency problems and examine how the ability to dynamically adjust the capital structure choice affects both target debt ratios and the extent to which actual debt ratios deviate from their targets. In particular, we examine how financial distress and the firm’s objectives, i.e., whether it makes choices to maximize total firm value versus equity value, influence the extent to which firms make financing choices that move them towards their target debt ratios. (Titman and Tsyplakov, 2005) We investigate the determinants of capital structure choice by analyzing the financing decisions of public firms in the major industrialized countries. At an aggregate level, firm leverage is fairly similar across the G-7 countries. We find that factors identified by previous studies as correlated in the cross-section with firm leverage in the U.S., are similarly correlated in other countries as well. However, a deeper examination of the U.S. and foreign evidence suggests that the theoretical underpinnings of the observed correlations are still largely unresolved. (Rajan and Zingales, 1991) Firm size has been empirically found to be strongly positively related to capital structure. A number of intuitive explanations can be put forward to account for this stylized fact, but none have been considered theoretically. This paper starts bridging this gap by investigating whether a dynamic capital structure model can explain the cross- sectional size-leverage relationship. The driving forces that we consider is the presence of fixed costs of external financing that lead to infrequent restructuring and create a wedge between small and large firms. We find four firm size effects on leverage. Small firms choose higher leverage at the moment of refinancing to compensate for less frequent rebalancing. But longer waiting times between refinancing lead on average to lower levels of leverage. Within one refinancing cycle the intertemporal relationship between leverage and firm size is negative. Finally, there is a mass of firms opting for no leverage. The analysis of dynamic economy demonstrates that in cross-section the relationship between leverage and size is positive and thus fixed costs of financing contribute to the explanation of the stylized size-leverage relationship. However, the relationship changes the sign when we control for the presence of unlevered firms. (Kurshev and Strebulaev, 2006) This paper examines the relative importance of many factors in the leverage decisions of publicly traded American firms from 1950 to 2003. The most reliable factors are median industry leverage (+ effect on leverage), market-to-book ratio (-), tangibility (+), profits (-), log of assets (+), and expected inflation (+). Industry subsumes a number of smaller effects. The empirical evidence seems reasonably consistent with some versions of the tradeoff theory of capital structure. (Frank and Goyal, 2007) This paper is a review of the central theoretical literature. The most important arguments for what could determine capital structure is the pecking order theory and the static trade off theory. These two theories are reviewed, but neither of them provides a COPY RIGHT ? 2011 Institute of Interdisciplinary Business Research
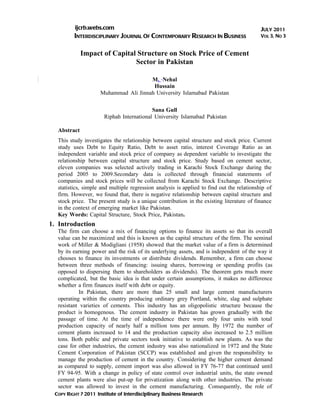
- 7. ijcrb.webs.com JULY 2011 INTERDISCIPLINARY JOURNAL OF CONTEMPORARY RESEARCH IN BUSINESS VOL 3, NO 3 complete description of the situation and why some firms prefer equity and others debt under different Circumstances. The paper is ended by a summary where the option price paradigm is proposed as a comprehensible model that can augment most partial arguments. The capital structure and corporate finance literature is filled with different models, but few, if any give a complete picture. (Frydenberg, 2004) Corporate governance theory predicts that leverage affects agency costs and thereby influences firm performance. We propose a new approach to test this theory using profit efficiency, or how close a firm’s profits are to the benchmark of a best-practice firm facing the same exogenous conditions. We are also the first to employ a simultaneous- equations model that accounts for reverse causality from performance to capital structure. We also control for measures of ownership structure in the tests. We find that data on the U.S. banking industry are consistent with the theory, and the results are statistically significant, economically significant, and robust. (Berger and Patti, 2003). Figure1 Frame work Independent Dependent Variables Variable Debt to equity Stock price Debt to total assets Interest coverage ratio 3. Hypotheses Ho: There is negative relationship between capital structure and stock price. H1: There is positive relationship between capital structure and stock price. 4. Research Methodology Population All the cement companies which are listed on the Karachi Stock Exchange have been selected as a population. Sample From the whole population a sample of eleven companies was selected which are listed below: 1. Fauji Cement Company Ltd. 2. Cherat Cement Company Ltd. 3. Attock Cement Pakistan Ltd COPY RIGHT ? 2011 Institute of Interdisciplinary Business Research
- 8. ijcrb.webs.com JULY 2011 INTERDISCIPLINARY JOURNAL OF CONTEMPORARY RESEARCH IN BUSINESS VOL 3, NO 3 4. Bestway Cement Ltd. 5. D.G. Khan Cement Company Ltd. 6. Dandot Cement Company Ltd. 7. Gharibwal Cement Ltd. 8. Kohat Cement Ltd. 9. Pioneer Cement Ltd. 10. Lucky Cement Ltd. 11. Maple Leaf Cement Factory Ltd. These companies were chosen because of availability of data and also these are listed on the Karachi Stock Exchange. Sampling Techniques. The sampling technique will be convenient sampling. Research Instruments. Three types of ratios are used to study the impact of capital structure on stock price i.e. debt to equity ratio, debt to total asset and interest coverage ratio. Total Debt Ratio= Total Liabilities/ Total Assets Debt to asset ratio = Total debt / assets Coverage Ratio = Operating Profit / interest charges Data Collection. Data for our research is collected from annual financial statements of the companies i.e. balance sheets, profit and loss account. It also includes articles, internet, books (financial management, accounting), and KSE published reports (monthly opening and closing rates of cement companies). 5 .Analysis & Interpretation of Data Ratios analysis on eleven selected companies has been conducted for five years 2004- 2008. All the tables below show the trend of these companies each year. Table 1 FAUJI CEMENT 2008 2007 2006 2005 2004 Debt to equity ratio 0.34 0.71 0.89 1.54 2.05 Debt to total asset 0.3 0.4 0.5 0.6 0.7 Interest coverage ratio 4.1 4.8 7.7 4.3 3.5 stock price 9.8 15 19.05 19.475 13.47 5 Figure1 Fauji Cement 25 Debt to equity 20 ratio 15 Debt to total asset 10 5 Int eres t c overage ratio 0 s toc k price 2008 2007 2006 2005 2004 COPY RIGHT ? 2011 Institute of Interdisciplinary Business Research
- 9. ijcrb.webs.com JULY 2011 INTERDISCIPLINARY JOURNAL OF CONTEMPORARY RESEARCH IN BUSINESS VOL 3, NO 3 Figure 1 shows that stock price of the company was maximum in 2005 where debt to equity and debt to total assets decreased as compared to the previous year. It is obvious as companies risk decreased that year which attracted the market. Next three years contradicts this tradition trend. The reason for this unusual trend may be because of political and economical instability of the country. Stock price in 2008 was minimum as all the ratios were less then the ratios in 2005. Table 2 CHEHRAT CEMENT 2008 2007 2006 2005 2004 Debt to equity ratio 1.03 0.58 0.71 0.84 0.52 Debt to total asset 0.5 0.4 0.4 0.5 0.3 Interest coverage ratio 0.3 4.3 9.9 21.1 31 stock price 25.555 40.35 64.625 81.25 62.6 Figure 2 5 Chehrat Cement 100 Debt to 80 equity ratio 60 Debt to total as set 40 20 Interes t coverage ratio 0 s toc k pric e 2008 2007 2006 2005 2004 Stock price is maximum in 2005 and it is minimum in 2008. it is also observed that interest coverage ratio is minimum in 2008 which shows positive relation between interest and stock price of the company. Negative relation has been observed between debt and stock price of the company. Table 3 ATTOCK CEMENT 2008 2007 2006 2005 200 4 Debt to equity ratio 0.66 0.7 0.65 0.61 0.45 Debt to total asset 0.4 0.41 0.39 0.38 0.31 Interest coverage ratio 5.39 12.69 55.9 104 55.6 stock price 68.69 82.9 73.55 71.05 48.4 COPY RIGHT ? 2011 Institute of Interdisciplinary Business Research
- 10. ijcrb.webs.com JULY 2011 INTERDISCIPLINARY JOURNAL OF CONTEMPORARY RESEARCH IN BUSINESS VOL 3, NO 3 Figure 3 Attock Cement 120 Debt to 100 equity ratio 80 Debt to total asset 60 40 Interes t 20 coverage ratio 0 stoc k price 2008 2007 2006 2005 2004 Fluctuation has been observed in interest coverage ratio each year which lead to the fluctuation in stock price of the company. Whereas debt to equity and debt to total assets remained consistent through out five years showing no significant change. Stock price of the company was maximum in 2007 i.e. 82.9 and minimum in 2004 i.e. 48.4. Table 4 BESTWAY CEMENT 2008 2007 2006 2005 2004 Debt to equity ratio 2.71 2.86 2.72 1.51 1.09 Debt to total asset 0.73 0.74 0.73 0.6 0.52 Interest coverage ratio 0.66 1.05 4.7 10.2 7.1 stock price 42.5 53 59.5 53.5 34.7 Figure 4 5 Bestw ay Cement 80 Debt to equity ratio 60 Debt to total asset 40 20 Interes t c overage ratio 0 s toc k price 2008 2007 2006 2005 2004 Company enjoyed highest stock price in 2006 where debt to equity ratio, debt to total asset and interest coverage ratio were 2.72, 0.73 and 4.7 respectively. A consistent trend has been observed through out regarding debt to equity and debt to total assets. This is the reason of its consistency in stock price. Table 5 D. G. KHAN CEMENT 2008 2007 2006 2005 2004 Debt to equity ratio 0.73 0.53 0.78 0.93 0.85 Debt to total asset 0.4 0.3 0.4 0.5 0.5 Interest coverage ratio 0.9 4.7 8.7 8 6 stock price 57.985 78.825 84.775 80.675 50.22 5 COPY RIGHT ? 2011 Institute of Interdisciplinary Business Research
- 11. ijcrb.webs.com JULY 2011 INTERDISCIPLINARY JOURNAL OF CONTEMPORARY RESEARCH IN BUSINESS VOL 3, NO 3 Figure 5 D.G Khan Cement 100 Debt to 80 equity ratio 60 Debt to total as set 40 20 Interes t coverage ratio 0 s toc k pric e 2008 2007 2006 2005 2004 Interest coverage ratio is maximum in 2006 so as stock price of the company. Figure 5 shows positive relationship between stock price and interest of the company. Other ratios are consistent each year, not showing big fluctuation. In 2006 debt to equity and debt to total assets are on average of these five years. Table 6 DANDOT CEMENT 2008 2007 2006 2005 2004 Debt to equity ratio 8.47 5.34 3.85 3.61 4.67 Debt to total asset 0.89 0.84 0.79 0.78 0.82 Interest coverage ratio -1.44 -1.55 1.7 0.1 -0.7 stock price 22.215 18.05 11.25 9.975 7.27 Figure6 5 Dandot Cement 25 Debt to equity 20 ratio 15 Debt to total asset 10 5 Interest coverage ratio 0 stock price -5 2008 2007 2006 2005 2004 Above table 6 shows positive relation between debt and stock price as debt to equity and debt to total assets is maximum in 2008 which resulted maximum stock price of the company in these five years. COPY RIGHT ? 2011 Institute of Interdisciplinary Business Research
- 12. ijcrb.webs.com JULY 2011 INTERDISCIPLINARY JOURNAL OF CONTEMPORARY RESEARCH IN BUSINESS VOL 3, NO 3 Table 7 GHARIBWAL CEMENT 2008 2007 2006 2005 2004 Debt to equity ratio 3.74 3.26 0.7 0.75 1.88 Debt to total asset 0.7 0.7 0.3 0.3 0.7 Interest coverage ratio -1.2 -2 5.2 2.6 2.1 stock price 16.695 12.925 12.2 14.45 10.2 Figure 7 5 Gharibw al Cement 20 Debt to 15 equity ratio Debt to total as set 10 5 Interes t 0 coverage ratio 2008 2007 2006 2005 2004 s toc k pric e -5 Stock price of the company is maximum in 2008 as compared to any other year. Positive relation has been observed between debt and stock price. Above table shows that debt to equity and debt to total assets are maximum in 2008 which increased stock price of the company i.e. 16.695. Table 8 KOHAT CEMENT 2008 2007 2006 2005 2004 Debt to equity ratio 2.27 1.51 0.35 0.53 0.83 Debt to total asset 0.7 0.6 0.26 0.35 0.45 Interest coverage ratio 0.7 1.2 20.2 25.2 17.2 stock price 33.825 41.55 56.65 70.025 53.32 5 It is evident from the graph above table 8 that stock price of Kohat Cement was maximum in 2005 where interest coverage ratio is maximum as compared to any other year. It is minimum in 2008, which decreased the stock price of the company and lead it to the most minimum level. This shows the positive impact between interest and stock price. Similarly comparing debt to equity ratio and debt to total assets we observed that they are maximum in 2008 where stock price decreased to minimum level comparing with other years. It shows negative impact. COPY RIGHT ? 2011 Institute of Interdisciplinary Business Research
- 13. ijcrb.webs.com JULY 2011 INTERDISCIPLINARY JOURNAL OF CONTEMPORARY RESEARCH IN BUSINESS VOL 3, NO 3 Figure 8 Kohat Cement 80 Debt to equity ratio 60 Debt to total asset 40 20 Interes t coverage ratio 0 stoc k price 2008 2007 2006 2005 2004 Table 9 PIONEER CEMENT 2008 2007 2006 2005 200 4 Debt to equity ratio 2.57 2.83 2.36 2.86 6.84 Debt to total asset 0.57 0.69 0.65 0.67 0.87 Interest coverage ratio -0.39 0.5 5.7 4.3 2.2 stock price 27.865 26.95 38.1 36.175 14.1 Figure 9 Pioneer Cement 50 Debt to equity 40 ratio 30 Debt to total asset 20 10 Interes t coverage ratio 0 s toc k price -10 2008 2007 2006 2005 2004 Debt to equity is observed consistent in last four years it was maximum in 2004 where the stock price of the company was minimum. Interest gave a positive impact on stock price as it was maximum in 2006 which lead to stock price to the maximum level. High level of fluctuation is observed in interest coverage ratio in the past five years which fluctuated its stock price. Table 10 LUCKY CEMENT 2008 2007 2006 2005 2004 Debt to equity ratio 0.84 1.75 2.34 1.88 0.63 Debt to total asset 0.5 0.64 0.7 0.65 0.39 Interest coverage ratio 19.2 4.1 31.8 56.8 90.6 COPY RIGHT ? 2011 Institute of Interdisciplinary Business Research
- 14. ijcrb.webs.com JULY 2011 INTERDISCIPLINARY JOURNAL OF CONTEMPORARY RESEARCH IN BUSINESS VOL 3, NO 3 stock price 73.885 88.2 71.9 62.275 32.6 5 COPY RIGHT ? 2011 Institute of Interdisciplinary Business Research
- 15. ijcrb.webs.com JULY 2011 INTERDISCIPLINARY JOURNAL OF CONTEMPORARY RESEARCH IN BUSINESS VOL 3, NO 3 Lucky Cement 100 Debt to 80 equity ratio 60 Debt to total asset 40 20 Interes t coverage ratio 0 stoc k price 2008 2007 2006 2005 2004 Unusual trend has been observed between interest and stock price of the company. It is seen that interest coverage ratio is maximum in 2004 and stock price is minimum as compared to 2007 where interest is minimum and stock price is maximum. Debt to equity and debt to total asset gave a positive impact on stock price as in 2004 both are minimum and in 2006 they are maximum which increased stock price. Table 11 MAPLE LEAF CEMENT 2008 2007 2006 2005 200 4 Debt to equity ratio 2.13 1.61 1.53 0.66 0.92 Debt to total asset 0.68 0.62 0.61 0.4 0.48 Interest coverage ratio 0.25 0.6 5.8 6 1.8 stock price 11.65 18.3 28.575 35.325 31.1 Figure11 Maple Leaf Cement 40 Debt to equity ratio 30 Debt to total asset 20 10 Interest coverage ratio 0 stock price 2008 2007 2006 2005 2004 COPY RIGHT ? 2011 Institute of Interdisciplinary Business Research
- 16. ijcrb.webs.com JULY 2011 INTERDISCIPLINARY JOURNAL OF CONTEMPORARY RESEARCH IN BUSINESS VOL 3, NO 3 5. Results & Discussions Table I Correlation Analysis Correlations DEBT DEBTASS INTREST STOCKPRICE DEBT Pearson Correlation 1 . -.327* -.440** Sig. (2-tailed) 830** .015 .001 N 55 .000 55 55 DEBTASS Pearson Correlation . 55 1 -.372* -.399** Sig. (2-tailed) 830** * .003 N .000 55 .005 55 INTREST Pearson Correlation 55 -.327* -.372* 55 1 .383** Sig. (2-tailed) .015 * .004 N 55 .005 55 55 STOCKPRICE Pearson Correlation -.440* 55 -.399* . 1 Sig. (2-tailed) * * 383** N .001 .003 .004 55 55 55 55 **. Correlation is significant at the 0.01 level (2-tailed). *. Correlation is significant at the 0.05 level (2-tailed). we use regression analysis to investigate the relationships between dependent and independent variables. Table II Regression Analysis Model Summary Adjusted Std. Error of Model R R Square R Square the 1 .508a .258 .214 Estimate 22.02437 a. Predictors: (Constant), DEBT, INTREST, DEBTASS Table II above reveals that fifty percent change will be explained by these three independent variables i.e. debt to equity ratio, debt to total assets and interest coverage ratio. It is evident from the table I that debt to equity ratio is showing very less negative significance i.e. -0.440. Debt to total assets is -0.399 which is also very less negatively significant. It is obvious as debt increases companies become more risky and which result in decrease in stock price. So there is a weak negative relation between debt to equity, debt to total asset and stock price. Whereas above table also reveals that interest coverage ratio is very weak positive significant i.e. 0.383. It shows positive relationship between interest coverage ratio and stock price. As our hypothesis statement is about relationship between stock price and capital structure so this result shows a weak negative relationship between capital structure and stock price can affect stock price. Interest coverage ratio indicates the ability of the company to meet its interest costs. So it can also affect stock price. But as our result COPY RIGHT ? 2011 Institute of Interdisciplinary Business Research
- 17. ijcrb.webs.com JULY 2011 INTERDISCIPLINARY JOURNAL OF CONTEMPORARY RESEARCH IN BUSINESS VOL 3, NO 3 is showing negative relationship so there are some other factors which affects more sock price. After getting results, Ho is accepted and H1 is rejected. Now we will see the previous studies what they have been identified about impact of capital structure on stock price. We will see the relationship between dependant and independent variables whether they have positive relationship or negative. Previous studies document a negative correlation between stock price and debt ratios, which is usually interpreted in favor of the pecking order theory. Capital structure is one of the central focuses in the corporate finance literature. Various theoretical models, such as the tradeoff, pecking-order, and market timing models, have been proposed to explain firms’ capital structure. These models also suggest that leverage changes affect firm value and stock prices. Jie Cai , Zhe Zhang (2005) focus on the effect of change in firms’ leverage on stock returns. Using a sample of U.S. public firms, they show that firms with higher leverage changes on average have lower returns. They test whether their results can be explained by the pecking-order models, the default risk premium, the tradeoff models, or the operational performance hypothesis. Their results are consistent with a dynamic version of the pecking-order theory, which suggests that an increase in leverage reduces safe debt capacity and leads to future underinvestment. This theory predicts a negative effect of leverage change on stock returns. Further, this effect should be stronger for firms that already have high leverage. They find empirical supports for both predictions. In addition, they find a negative effect of leverage change on future investment, suggesting that increasing leverage does lead to future underinvestment. Their results provide little support for the default premium hypothesis. First, there is no evidence that firms with a higher leverage increase have higher future returns. Second, there is a significant, negative effect of the change in long-term debt leverage on stock returns, but a much weaker effect for the change in short-term debt leverage. Both results are not consistent with the default risk premium hypothesis. Nor do the results appear to be consistent with the tradeoff models. Tradeoff models imply an optimal (target) capital structure. Deviation from the target should have a negative effect on stock price. Yet, when they sort stocks into portfolios based on the deviation or change in deviation from the target leverage, they do not find significant return patterns across these Portfolios. Nor can our results be explained by the market-timing hypothesis, which predicts that a firm will lower debt financing and increase equity financing if its equity is overvalued. As a result, leverage decrease signals overvaluation of equity and has a negative effect on stock price, which is opposite to our findings. Further tests also suggest that the operational performance hypothesis proposed in Dimitrov and Jain (2003) is unlikely to explain the results for their sample. Finally, we show that the leverage innovation effect contains information about the cross-sectional stock returns that cannot be explained by popular asset pricing factors. This result has important implication for the construction of performance benchmarks and investors’ portfolio allocation decision. Gulnur Muradoglu and Sheeja Sivaprasad (Nov 2008), they find leverage to have a negative relation with stock returns. They find that returns have a negative relation with leverage in the Consumer Goods, Consumer Services and Industrials sectors. Some prior literature has examined capital structure ratios based not only on market equity value but also on book equity value. Yet, the book value of equity is primarily a “plug number” to balance the left-hand side and the right-hand side of the balance sheet and it can even be negative. Rajan and Zingales (1995) offer the definitive description of capital structures and find a strong negative correlation between market-book ratios and leverage. Like Rajan COPY RIGHT ? 2011 Institute of Interdisciplinary Business Research
- 18. ijcrb.webs.com JULY 2011 INTERDISCIPLINARY JOURNAL OF CONTEMPORARY RESEARCH IN BUSINESS VOL 3, NO 3 and Zingales, Barclay, Smith, and Watts (1995) find that debt ratios are negatively related to market-book ratios. Muradoglu and Sivaprasad, Nov 2008, this is an empirical study that investigates the effect of firm’s leverage on stock returns. They conclude that the contradicting empirical results in literature are mainly due to the restrictions in the samples used. The positive relationship between leverage and stock returns is unique to utilities, a risk class that is highly regulated and has high concentration of leverage ratios. After looking some previous studies we found that capital structure has negative relationship to stock price. Our result is showing negative relationship between capital structure and stock price, so may be there are some other factors which affects stock price more than capital structure. According to our results capital structure is affecting 25% to stock price other factors are affecting 75%. 5. Conclusion According to our result, there is negative relationship between capital structure and stock price. In previous studies we also find that they have given results that there is negative relationship between capital structure and stock price. So result proves hypothesis Ho and rejects H1. We found that capital structure is affecting 25% to stock price, it shows that capital structure does not affect too much to stock price. There are some other factors which affects stock price 75%. We are focusing only micro factor so at the end we can conclude that macro factors like demand and supply, political instability, inflation, etc .these factors have some relationship to stock price. 6. Recommendation We will recommend only that those who will conduct research on this topic impact of capital structure on stock price, they must see macro factors because according to result capital structure affects 25% to stock price so 75% affects other factors. COPY RIGHT ? 2011 Institute of Interdisciplinary Business Research
- 19. ijcrb.webs.com JULY 2011 INTERDISCIPLINARY JOURNAL OF CONTEMPORARY RESEARCH IN BUSINESS VOL 3, NO 3 References [1] Arthur G. Korteweg.(2004). Financial Leverage and Expected Stock Returns: Evidence from Pure Exchange Offer Available http://ssrn.com/abstract=597922. [2] Baker. Malcolm. Wurgler, J. ( 2002). Market Timing and Capital Structure. Journal of Finance, 57, 1–32. [3] Bhandari, L.C. (1988). Debt/Equity Ratio and Expected Common Stock Return. The Journal of Finance, 43(2), 507-528. [4] Cai, J. Zhang,Z.( 2005). Capital Structure Dynamics and Stock Returns. Journal of Finance [5] Fama, E. (1980). Agency Problems and Theory of the Firm. Journal of Political Economy, 88(2). [6] Fama, E. F. MacBeth, J. D. (1973). Risk, Return, and Equilibrium: Empirical Tests. Journal of Political Economy, 81, 607-636. [7] Fama, F.Kenneth, R. (1992). The Cross-Section of Expected Stock Returns Eugene. French the Journal of Finance, 47(2), 427-46. [8] Frank, M. Z., Goyal , V. K.( 2007). Testing the pecking order theory of capital structure. Journal of Financial Economics, 67, 217-248. [9] Frydenberg, S. (2004). Capital structure functions with a stratified sample. Working paper. Sr-Trndelag University College. [10] Hall, C. Patrick, J. Hutchinson. Michaela, N.(2001). Determinants of the Capital Structures of European SMEs Graham. Journal of Business Finance & Accounting, 31(5-6), 711–728. [11] Harris, Milton, Raviv, A. ( 1991). The theory of capital structure. Journal of Finance, 46, 297-355. [12] Hijazi, S.T. Tariq, Y.B. (2006). Determinants of Capital Structure: A Case for the Pakistani Cement Industry. The Lahore Journal of Economics, 11(1), 63-80. [13] Kurshev, A. Ilya, A. Strebulaev. (2006). Firm Size and Capital Structure. Journal of Finance. [14] Modigliani, F, Miller, M.H., (1958). The Cost of Capital, Corporation Finance and the Theory of Investment. The American Economic Review, 48(3). [15] Modigliani, F. Merton, H. Miller. (1958). the Cost of Capital, Corporation Finance and the Theory of Investment. The American Economic Review, 48, (3), 261-297. [16] Moyen, N. (2005). How Big Is the Debt Overhang Problem? The Journal of Economic Dynamics and Control. [17] Rajan, R.G., Zingales, L. (1995). What Do We Know about Capital Structure? Some Evidence from International Data. Journal of Finance, 50(5), 1421-60. [18] Roy l. Simerly1, Mingfang. (2000). Environmental Dynamism, Capital Structure an Performance. A theoretical integration and an Empirical test. Strategic Management Journal, 21, 31–49. [19] Schwartz,E.(1959). Theory of the Capital Structure of the Firm. The Journal of Finance, 14(1), 18-39. [20] Sivaprasad,S. Muradoglu,Y.(2007) . An Empirical Analysis of Capital Structure and Abnormal Returns. Cass Business School Research Paper. [21] Sreedhar,T. Bharath. Pasquariell,P. Guojun (2004). Does Asymmetric Information Drive Capital Structure Decisions? Journal of Financial and Quantitative Analysis, 23, 39-51. [22] Titman, S., Wessels, R. (1988). The Determinants of Capital Structure Choice. Journal of Finance, 43(1), 1-19. COPY RIGHT ? 2011 Institute of Interdisciplinary Business Research
- 20. ijcrb.webs.com JULY 2011 INTERDISCIPLINARY JOURNAL OF CONTEMPORARY RESEARCH IN BUSINESS VOL 3, NO 3 [23] Titman. Sheridan, S, T. (2007). A Dynamic Model of Optimal Capital Structure. Journal of Business Finance & Accounting. [24] Welch, I. (2004). Capital Structure and Stock Returns. Journal of Political Economy, 112(1), 106‐131. COPY RIGHT ? 2011 Institute of Interdisciplinary Business Research
- 21. ijcrb.webs.com JULY 2011 INTERDISCIPLINARY JOURNAL OF CONTEMPORARY RESEARCH IN BUSINESS 2004 VOL 3, NO 3 Appendix 13.475 stock Debt to equity Debt to total Ints coverage years price ratio 2.05 asset ratio 0.7 3.5 2005 19.475 0.34 0.6 4.3 2006 19.05 0.71 0.5 7.7 2007 15 0.89 0.4 4.8 2008 9.8 1.54 0.3 4.1 2004 53.325 0.83 0.45 17.2 2005 70.025 0.53 0.35 25.2 2006 56.65 0.35 0.26 20.2 2007 41.55 1.51 0.6 1.2 2008 33.825 2.27 0.7 0.7 2004 32.65 0.63 0.39 90.6 2005 62.275 1.88 0.65 56.8 2006 71.9 2.34 0.7 31.8 2007 88.2 1.75 0.64 4.1 2008 73.885 0.84 0.5 19.2 2004 14.1 6.84 0.87 2.2 2005 36.175 2.86 0.67 4.3 2006 38.1 2.36 0.65 COPY RIGHT ? 2011 Institute of Interdisciplinary Business Research 5.7 2007 26.95 2.83 0.69 0.5
- 22. ijcrb.webs.com JULY 2011 INTERDISCIPLINARY JOURNAL OF CONTEMPORARY RESEARCH IN BUSINESS VOL 3, NO 3 2005 71.05 0.61 0.38 104 2006 73.55 0.65 0.39 55.9 2007 82.9 0.7 0.41 12.69 2008 68.69 0.66 0.4 5.39 COPY RIGHT ? 2011 Institute of Interdisciplinary Business Research