Analysis of Financial Statements
Chapter 4Ratio AnalysisDuPont SystemLimitations of Ratio Analysis
4-*
*
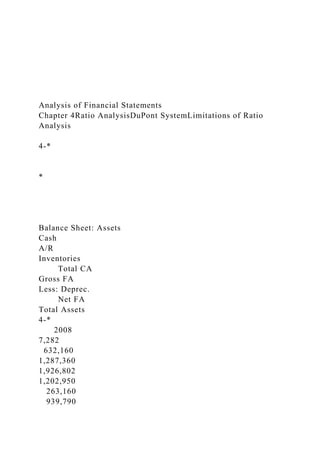
Balance Sheet: Assets
Cash
A/R
Inventories
Total CA
Gross FA
Less: Deprec.
Net FA
Total Assets
4-*
2008
7,282
632,160
1,287,360
1,926,802
1,202,950
263,160
939,790
2,866,592
2009E
85,632
878,000
1,716,480
2,680,112
1,197,160
380,120
817,040
3,497,152
*
Balance Sheet: Liabilities and Equity
Accts payable
Notes payable
Accruals
Total CL
Long-term debt
Common stock
Retained earnings
Total Equity
Total L & E
4-*
2008
524,160
636,808
489,600
1,650,568
723,432
460,000
32,592
492,592
2,866,592
2009E
436,800
300,000
408,000
1,144,800
400,000
1,721,176
231,176
1,952,352
3,497,152
*
Income Statement
Sales
COGS
Other expenses
EBITDA
Deprec. & amort.
EBIT
Interest exp.
EBT
Taxes
Net income
2008
6,034,000
5,528,000
519,988
(13,988)
116,960
(130,948)
136,012
(266,960)
(106,784)
(160,176)
2009E
7,035,600
5,875,992
550,000
609,608
116,960
492,648
70,008
422,640
169,056
253,584
4-*
*
Other Data
No. of shares
EPS
DPS
Stock price
Lease pmts
4-*
2009E
250,000
$1.014
$0.220
$12.17
$40,000
2008
100,000
-$1.602
$0.110
$2.25
$40,000
*
Why are ratios useful?Ratios standardize numbers and facilitate comparisons.Ratios are used to highlight weaknesses and strengths.Ratio comparisons should be made through time and with competitors.Trend analysis.(compare company’s ratios to its own past levels)Peer (or industry) analysis.
4-*
*
Five Major Categories of Ratios Liquidity: which give us an idea of the firm’s ability to pay off debts that are mature within a year.Asset management: which give us an idea how efficiently the firm is using asset. Debt management: which give us an idea how the firm has financed its assets as well as the firm’s ability to repay its long-term debt.
4-*
*
Five Major Categories of Ratios Profitability: which give us an idea of how profitably the firm is utilizing and operating its assets.Market value: which bring in the stock price and give us an idea of what investors think about the firm and its future prospects
4-*
Liquidity Ratio| a. Current Ratio
4-*
It indicates the extent to which current liabilities are covered by those assets expected to be converted to cash in the near future
The industry average current ratio = 2.70x
*
Liquidity Ratio| a. Current Ratio
High current ratio generally indicateVery strong and safe liquidity position The firm has too much old inventory or too many old account receivable that need to be written offThe firm has too much cash, receivable, inventory relative to sales, in which these assets are not being managed efficiently.
4-*
Liquidity Ratio| b. Quick Ratio
4-*
The industry Average Quick ratio= 1.00x
Inventory is regarded as the least liquid of a firm’s current asset; if sales slow down, they might not be converted .
Analysis of Financial StatementsChapter 4Ratio AnalysisD.docx
1. Analysis of Financial Statements
Chapter 4Ratio AnalysisDuPont SystemLimitations of Ratio
Analysis
4-*
*
Balance Sheet: Assets
Cash
A/R
Inventories
Total CA
Gross FA
Less: Deprec.
Net FA
Total Assets
4-*
2008
7,282
632,160
1,287,360
1,926,802
1,202,950
263,160
939,790
5. $1.014
$0.220
$12.17
$40,000
2008
100,000
-$1.602
$0.110
$2.25
$40,000
*
Why are ratios useful?Ratios standardize numbers and facilitate
comparisons.Ratios are used to highlight weaknesses and
strengths.Ratio comparisons should be made through time and
with competitors.Trend analysis.(compare company’s ratios to
its own past levels)Peer (or industry) analysis.
4-*
*
Five Major Categories of Ratios Liquidity: which give us an
idea of the firm’s ability to pay off debts that are mature within
a year.Asset management: which give us an idea how efficiently
the firm is using asset. Debt management: which give us an idea
6. how the firm has financed its assets as well as the firm’s ability
to repay its long-term debt.
4-*
*
Five Major Categories of Ratios Profitability: which give us an
idea of how profitably the firm is utilizing and operating its
assets.Market value: which bring in the stock price and give us
an idea of what investors think about the firm and its future
prospects
4-*
Liquidity Ratio| a. Current Ratio
4-*
It indicates the extent to which current liabilities are covered by
those assets expected to be converted to cash in the near future
The industry average current ratio = 2.70x
*
Liquidity Ratio| a. Current Ratio
High current ratio generally indicateVery strong and safe
liquidity position The firm has too much old inventory or too
many old account receivable that need to be written offThe firm
7. has too much cash, receivable, inventory relative to sales, in
which these assets are not being managed efficiently.
4-*
Liquidity Ratio| b. Quick Ratio
4-*
The industry Average Quick ratio= 1.00x
Inventory is regarded as the least liquid of a firm’s current
asset; if sales slow down, they might not be converted to cash as
quickly as expected
Asset management Ratios | a. Inventory Turnover
Inv. turnover = Sales/Inventories
= $7,036/$1,716
= 4.10x
4-*
How many time each item of a company ‘s inventory is sold and
restocked (turned over)2009E20082007Ind.Inventory
turnover4.1x4.70x4.8x6.1x
*
Asset management Ratios | a. Inventory Turnover
Low inventory turnover could indicate:Holding too much
inventory Excess inventory is un productive and represent
investment with low rate of return.Holding goods that are not
8. worth their stated value.
4-*
Asset management Ratios | b. DSO: Days Sales Outstanding
DSO = Receivables/Avg. sales per day
= Receivables/(Annual sales/365)
= $878/($7,036/365)
= 45.6 days
The average length of time the firm must wait after making a
sale before receiving cash.
4-*2009E20082007Ind.DSO45.638.237.432.0
*
Asset management Ratios | c. Fixed Assets and d.Total Assets
Turnover Ratios
FA turnover = Sales/Net fixed assets
= $7,036/$817 = 8.61x
TA turnover = Sales/Total assets
= $7,036/$3,497 = 2.01x
4-*2009E20082007Ind.FA TO8.6x6.4x10.0x7.0xTA
TO2.0x2.1x2.3x2.6x
*
Potential problem: Inflation has caused the value of many assets
that were purchased in the past to be seriously understated.
9. Debt management Ratio| a. Debt ratio
b. Times-Interest-Earned Ratio
Debt ratio = Total debt/Total assets
= ($1,145 + $400)/$3,497
= 44.2%Lender prefer low debt ratio because the
lower the ratio, the greater the cushion against creditor’s losses
in the event of liquidation. On the other hand, stockholder may
prefer high debt.
TIE = EBIT/Interest expense
= $492.6/$70 = 7.0x
4-*
*
Debt Management Ratios vs. the Industry AveragesTimes-
Interest-Earned Ratio measures the firm’s ability to meet its
annual interest payments
4-*2009E20082007Ind.D/A44.2%82.8%54.8%50.0%TIE7.0x-
1.0x4.3x6.2x
*
Profitability Ratios|a.Operating Margin, b. Profit Margin, and c.
10. Basic Earning Power
4-*
*
Profitability with Operating Margin, Profit Margin, and Basic
Earning Power
4-*2009E20082007Ind.Operating margin7.0%-
2.2%5.6%7.3%Profit margin3.6%-2.7%2.6%3.5%Basic earning
power14.1%-4.6%13.0%19.1%
*
Profit margin
When profit margin is low could indicate: Firm’s high operating
costHeavy use of debt . We can expect the company with higher
debt ratio to have lower profit margin.High return on sales , but
we must be concerned about inventory turnover
4-*
Profitability Ratios: d.Return on Assets and e. Return on Equity
ROA = Net income/Total assets
= $253.6/$3,497 = 7.3%
ROE = Net income/Total common equity
11. = $253.6/$1,952 = 13.0%
4-*
*
Appraising Profitability with ROA
and ROE
4-*
ROA is lowered by debt ─ interest lowers NI, which also lowers
ROA = NI/Assets.But use of debt also lowers equity, hence debt
could raise ROE = NI/Equity.2009E20082007Ind.ROA7.3%-
5.6%6.0%9.1%ROE13.0%-32.5%13.3%18.2%
*
Problems with ROEROE and shareholder wealth are correlated,
but problems can arise when ROE is the sole measure of
performance.ROE does not consider risk.ROE does not consider
the amount of capital invested.Might encourage managers to
make investment decisions that do not benefit shareholders.ROE
focuses only on return and a better measure would consider risk
and return.
4-*
*
12. Market value ratios| a. the Price/Earnings and b. Market/Book
Ratios
P/E = Price/Earnings per share
= $12.17/$1.014 = 12.0x
M/B = Market price/Book value per share
= $12.17/($1,952/250) = 1.56x
4-*2009E20082007Ind.P/E12.0x-
1.4x9.7x14.2xM/B1.56x0.5x1.3x2.4x
*
Analyzing the Market Value RatiosP/E: How much investors
are willing to pay for $1 of earnings.M/B: How much investors
are willing to pay for $1 of book value equity.For each ratio,
the higher the number, the better.P/E and M/B are high if ROE
is high and risk is low.The market value ratios are used by a.
investors to buy or sell stock, b. investment bank to set IPO
price, and c. firms for potential merger
4-*
*
13. The DuPont SystemFocuses on expense control (PM), asset
utilization (TA TO), and debt utilization (equity multiplier).
4-*
*
DuPont Equation:
Breaking Down Return on Equity
ROE = (NI/Sales) x (Sales/TA) x (TA/Equity)
= 3.6% x 2 x 1.8
= 13.0%
4-*PMTA TOEMROE 20072.6%2.32.213.3% 2008-
2.7%2.15.8-32.5% 2009E3.6%2.01.813.0%
Ind.3.5%2.62.018.2%
*
An Example:
The Effects of Improving Ratios
A/R $ 878 Debt $1,545
Other CA 1,802 Equity 1,952
Net FA 817
TA $3,497 Total L&E $3,497
14. Sales/Day = $7,035,600/365 = $19,275.62
How would reducing the firm’s DSO to 32 days affect the
company?
4-*
*
Reducing Accounts Receivable and the Days Sales
OutstandingReducing A/R will have no effect on sales
Initially shows up as addition to cash.
4-*
*
Effect of Reducing Receivables on Balance Sheet and Stock
Price
Added cash $ 261 Debt $1,545
A/R 617 Equity 1,952
Other CA 1,802
Net FA 817
Total Assets $3,497 Total L&E $3,497
What could be done with the new cash?
15. How might stock price and risk be affected?
4-*
*
Potential Uses of Freed up CashRepurchase stockExpand
businessReduce debtAll these actions would likely improve the
stock price.
4-*
*
Potential Problems and Limitations of Financial Ratio
AnalysisComparison with industry averages is difficult for a
conglomerate firm that operates in many different
divisions.“Average” performance is not necessarily good,
perhaps the firm should aim higher.Seasonal factors can distort
ratios.“Window dressing” techniques can make statements and
ratios look better.
4-*
*
More Issues Regarding RatiosDifferent operating and
16. accounting practices can distort comparisons.Sometimes it is
hard to tell if a ratio is “good” or “bad.”Difficult to tell whether
a company is, on balance, in strong or weak position.
4-*
*
Review Financial Ratios.Limitations of Ratio Analysis.
4-*
´
=
=
=
2.34
145
,
1
$
680
,
2
$
s
liabilitie
Current
assets
Current
ratio
Current
´
=
19. ´
=
Old A/R = $19,275.62 × 45.6 = $878,000
New A/R = $19,275.62 × 32.0 = $616,820
Cash freed up: $261,180
Analysis of Financial Statements
Chapter 4Ratio AnalysisDuPont SystemLimitations of Ratio
Analysis
4-*
*
Balance Sheet: Assets
Cash
A/R
Inventories
Total CA
Gross FA
Less: Deprec.
Net FA
Total Assets
4-*
2008
24. Five Major Categories of Ratios Liquidity: which give us an
idea of the firm’s ability to pay off debts that are mature within
a year.Asset management: which give us an idea how efficiently
the firm is using asset. Debt management: which give us an idea
how the firm has financed its assets as well as the firm’s ability
to repay its long-term debt.
4-*
*
Five Major Categories of Ratios Profitability: which give us an
idea of how profitably the firm is utilizing and operating its
assets.Market value: which bring in the stock price and give us
an idea of what investors think about the firm and its future
prospects
4-*
Liquidity Ratio| a. Current Ratio
4-*
It indicates the extent to which current liabilities are covered by
those assets expected to be converted to cash in the near future
The industry average current ratio = 2.70x
*
25. Liquidity Ratio| a. Current Ratio
High current ratio generally indicateVery strong and safe
liquidity position The firm has too much old inventory or too
many old account receivable that need to be written offThe firm
has too much cash, receivable, inventory relative to sales, in
which these assets are not being managed efficiently.
4-*
Liquidity Ratio| b. Quick Ratio
4-*
The industry Average Quick ratio= 1.00x
Inventory is regarded as the least liquid of a firm’s current
asset; if sales slow down, they might not be converted to cash as
quickly as expected
Asset management Ratios | a. Inventory Turnover
Inv. turnover = Sales/Inventories
= $7,036/$1,716
= 4.10x
4-*
How many time each item of a company ‘s inventory is sold and
restocked (turned over)2009E20082007Ind.Inventory
turnover4.1x4.70x4.8x6.1x
*
26. Asset management Ratios | a. Inventory Turnover
Low inventory turnover could indicate:Holding too much
inventory Excess inventory is un productive and represent
investment with low rate of return.Holding goods that are not
worth their stated value.
4-*
Asset management Ratios | b. DSO: Days Sales Outstanding
DSO = Receivables/Avg. sales per day
= Receivables/(Annual sales/365)
= $878/($7,036/365)
= 45.6 days
The average length of time the firm must wait after making a
sale before receiving cash.
4-*2009E20082007Ind.DSO45.638.237.432.0
*
Asset management Ratios | c. Fixed Assets and d.Total Assets
Turnover Ratios
FA turnover = Sales/Net fixed assets
= $7,036/$817 = 8.61x
TA turnover = Sales/Total assets
= $7,036/$3,497 = 2.01x
4-*2009E20082007Ind.FA TO8.6x6.4x10.0x7.0xTA
27. TO2.0x2.1x2.3x2.6x
*
Potential problem: Inflation has caused the value of many assets
that were purchased in the past to be seriously understated.
Debt management Ratio| a. Debt ratio
b. Times-Interest-Earned Ratio
Debt ratio = Total debt/Total assets
= ($1,145 + $400)/$3,497
= 44.2%Lender prefer low debt ratio because the
lower the ratio, the greater the cushion against creditor’s losses
in the event of liquidation. On the other hand, stockholder may
prefer high debt.
TIE = EBIT/Interest expense
= $492.6/$70 = 7.0x
4-*
*
Debt Management Ratios vs. the Industry AveragesTimes-
Interest-Earned Ratio measures the firm’s ability to meet its
annual interest payments
4-*2009E20082007Ind.D/A44.2%82.8%54.8%50.0%TIE7.0x-
1.0x4.3x6.2x
28. *
Profitability Ratios|a.Operating Margin, b. Profit Margin, and c.
Basic Earning Power
4-*
*
Profitability with Operating Margin, Profit Margin, and Basic
Earning Power
4-*2009E20082007Ind.Operating margin7.0%-
2.2%5.6%7.3%Profit margin3.6%-2.7%2.6%3.5%Basic earning
power14.1%-4.6%13.0%19.1%
*
Profit margin
When profit margin is low could indicate: Firm’s high operating
costHeavy use of debt . We can expect the company with higher
debt ratio to have lower profit margin.High return on sales , but
we must be concerned about inventory turnover
4-*
29. Profitability Ratios: d.Return on Assets and e. Return on Equity
ROA = Net income/Total assets
= $253.6/$3,497 = 7.3%
ROE = Net income/Total common equity
= $253.6/$1,952 = 13.0%
4-*
*
Appraising Profitability with ROA
and ROE
4-*
ROA is lowered by debt ─ interest lowers NI, which also lowers
ROA = NI/Assets.But use of debt also lowers equity, hence debt
could raise ROE = NI/Equity.2009E20082007Ind.ROA7.3%-
5.6%6.0%9.1%ROE13.0%-32.5%13.3%18.2%
*
Problems with ROEROE and shareholder wealth are correlated,
but problems can arise when ROE is the sole measure of
performance.ROE does not consider risk.ROE does not consider
the amount of capital invested.Might encourage managers to
30. make investment decisions that do not benefit shareholders.ROE
focuses only on return and a better measure would consider risk
and return.
4-*
*
Market value ratios| a. the Price/Earnings and b. Market/Book
Ratios
P/E = Price/Earnings per share
= $12.17/$1.014 = 12.0x
M/B = Market price/Book value per share
= $12.17/($1,952/250) = 1.56x
4-*2009E20082007Ind.P/E12.0x-
1.4x9.7x14.2xM/B1.56x0.5x1.3x2.4x
*
Analyzing the Market Value RatiosP/E: How much investors
are willing to pay for $1 of earnings.M/B: How much investors
are willing to pay for $1 of book value equity.For each ratio,
the higher the number, the better.P/E and M/B are high if ROE
is high and risk is low.The market value ratios are used by a.
investors to buy or sell stock, b. investment bank to set IPO
price, and c. firms for potential merger
4-*
31. *
The DuPont SystemFocuses on expense control (PM), asset
utilization (TA TO), and debt utilization (equity multiplier).
4-*
*
DuPont Equation:
Breaking Down Return on Equity
ROE = (NI/Sales) x (Sales/TA) x (TA/Equity)
= 3.6% x 2 x 1.8
= 13.0%
4-*PMTA TOEMROE 20072.6%2.32.213.3% 2008-
2.7%2.15.8-32.5% 2009E3.6%2.01.813.0%
Ind.3.5%2.62.018.2%
*
An Example:
32. The Effects of Improving Ratios
A/R $ 878 Debt $1,545
Other CA 1,802 Equity 1,952
Net FA 817
TA $3,497 Total L&E $3,497
Sales/Day = $7,035,600/365 = $19,275.62
How would reducing the firm’s DSO to 32 days affect the
company?
4-*
*
Reducing Accounts Receivable and the Days Sales
OutstandingReducing A/R will have no effect on sales
Initially shows up as addition to cash.
4-*
*
Effect of Reducing Receivables on Balance Sheet and Stock
Price
33. Added cash $ 261 Debt $1,545
A/R 617 Equity 1,952
Other CA 1,802
Net FA 817
Total Assets $3,497 Total L&E $3,497
What could be done with the new cash?
How might stock price and risk be affected?
4-*
*
Potential Uses of Freed up CashRepurchase stockExpand
businessReduce debtAll these actions would likely improve the
stock price.
4-*
*
Potential Problems and Limitations of Financial Ratio
AnalysisComparison with industry averages is difficult for a
conglomerate firm that operates in many different
divisions.“Average” performance is not necessarily good,
perhaps the firm should aim higher.Seasonal factors can distort
ratios.“Window dressing” techniques can make statements and
ratios look better.
4-*
34. *
More Issues Regarding RatiosDifferent operating and
accounting practices can distort comparisons.Sometimes it is
hard to tell if a ratio is “good” or “bad.”Difficult to tell whether
a company is, on balance, in strong or weak position.
4-*
*
Review Financial Ratios.Limitations of Ratio Analysis.
4-*
´
=
=
=
2.34
145
,
1
$
680
,
2
$
s
liabilitie
Current
37. ROE
´
´
=
´
´
=
Old A/R = $19,275.62 × 45.6 = $878,000
New A/R = $19,275.62 × 32.0 = $616,820
Cash freed up: $261,180
Financial Management BFIN2302
Ms. Najwa Aldardeer
_
Student Name:
ID:
Section: A,B,C,D,E&F
Total: 15 points
Learning Outcomes:
Upon completion of this project, the students should be able to:
A. Explain the environment within which the financial manager
operates as well as the role of financial markets and
institutions.
38. B. Evaluate financial performance using financial ratios.
C. Define, quantify, and interpret risk measures.
D. Identify components of working capital and how to manage
them.
E. Describe ethical issues of financial management.
The project is following the Bloom’s Taxonomy
· Evaluating : Critiquing, rating , grading, examining, assessing
, inferring, drawing conclusion , and forming opinion
· Synthesis: linking new information with previous information
· Analysis: Examining, breaking down
· Application: using knowledge and comprehension; solving
problems
· Comprehension: Understanding, paraphrasing, and interpreting
· Knowledge: naming ,recognizing , identifying , recognizing ,
and reciting
Content
Chapter 1&2------------------------------------------------------------
------------------- Section A
Chapter 4---------------------------------------------------------------
--------------------Section B
Chapter 8---------------------------------------------------------------
--------------------Section C
Chapter 15--------------------------------------------------------------
-------------------Section D
Select a company from Tadawul.com
39. Use the following video to help you to find a company in
Tadawul .
https://www.youtube.com/watch?v=tirZooaTRhs
Use the university lab to get the full information about a
company that listed in Tadawul.
The university lab has access to Thomson Reuter’s database.
Fill up the following
A) Chapter 1 and 2
· Name of the company: Savola Group Company.
· Sector: Egypt, Algeria, the Levant, Iran, Morocco, Turkey,
Sudan, and Kazakhstan.
· CEO/ Name: Eng. Rayan Mohammed Fayez.· CFO/ Name: Mr.
Nouman Farrukh Abdulsalam.
· Major shareholders:
· Aseela Investment (11.23%).
· General Organization for Social Insurance (10.23%).
· AbdulKadir Al-Muhaidib & Sons Company (8.21%).
· Abdullah M. A. Al Rabiah (8.21%).
· Al-Muhaidib Holding Co. (6.36%).
· Definition of Tadawul market:
Tadawul is the sole entity authorized in the Kingdom of Saudi
Arabia to act as the Securities Exchange (the Exchange). It
mainly carries out listing and trading in securities, as well as
deposit, transfer, clearing, settlement, and registry of ownership
of securities traded on the Exchange. The capital of Tadawul is
SAR 1,200,000,000 divided into (120,000,000) shares of equal
value of SAR 10; all of which are cash shares subscribed by the
40. Public Investment Fund. Tadawul is an affiliate member of the
International Organization of Securities Commissions (IOSCO),
the World Federation of Exchanges (WFE), and the Arab
Federation of Exchanges (AFE).
· Market data
Last trade
42.70
Day’sRange
Trade time
13.13
52wk Range
44.90 - 27.80
Change
-0.38 (-0.88%)
Volume
83,315
Prev Close
43.20
No of shares outstanding
533.90M
Open
42.90
Authorized capital
Bid
42.60
P/E(ttm)
N/A
Ask
42.70
EPS(ttm)
42. B) Financial ratios
TO WRITE A PROPER ANALYSIS
1- Describe what is happening in the two years (high, low)
2- Write what the ratio tells you
3- Reason why the second year went up or down
*Your grades will be on your analysis
USE THESE STEPS TO ANALYZE
Provide an analysis of 6 financial indicators of the chosen
company and compare them with the previous year performance.
Conclude your analysis with an overall analysis of the company
financial situation.
Analysis of 6 financial indicators below
Name
2015
2016
analysis
Current ratio
0.94x
0.18x
Quick ratio
0.45x
0.49x
Inventory turnover
4.3x
5.2x
DSO
43. Fixed assets turnover
3.44x
3.44x
Total assets turnover
0.94x
0.99x
Debt ratio
Times-interest-earned
3.0x
0.1x
Operating margin
17.1x
1.0x
Profit margin
7.6x
1.8x
Return on total assets
Basic Earning power
Return on common equity
44. Price/ Earning
Book value per share
Market/ Book
Conclusion of analysis:
---------------------------------------------------------------------------
---------------------------------------------------------------------------
---------------------------------------------------------------------------
---------------------------------------------------------------------------
---------------------------------------------------
45. Grading Criteria
FOLLOWING THE STRACTURE AND FILLING UP THE
REQUIRMENTS
Section
Maximum points
Points earned
Section one table / Filling more than half of the requirement
3
Graph along with explanation
2
Section two/ providing 6 financial ratios and analysis
6
Overall conclusion of company analysis
2
Using Thomson Reuter’s database
1
On time submission and professional presentation
1
Total
15
Comment
Najwa Aldardeer, spring 2016-2017, financial Management/
BFIN2302