SlideShare una empresa de Scribd logo
1 de 50
Intro to Micro Economics
TABLE 1
Units of Resource
Total Product (TP)
Average Product (AP)
Marginal Product (MP)
0
0
_____
_____
1
3
_____
_____
2
8
_____
_____
3
15
_____
_____
4
20
_____
_____
5
23
_____
_____
6
20
_____
Questions 1-4 are based on the table 1 above
1. What is Average Product from the 1-6 workers?
a. 0,1,2,3,4,5,6,
b. 1,2,3,4,56,7
c. 3,4,5,5,4.6,3.3
d. 3,8,15,20,23,20
2. What is Marginal Product from the 1-6 workers?
a. 0,3,4,5,5,4.6,3.3
b. 0,1,2,3,4,5,6,
c. 3,8,15,20,23,20
d. 3,5,7,5,3,-3
3. When Marginal product is greater than average product,
average product is …
a. Rising
b. Constant
c. Falling
d. Cannot determine
4. When marginal product is less than average product, average
product is..
a. Rising
b. Constant
c. Falling
d. Cannot determine
TABLE 2
Output Per Day
TFC
TVC
TC
AFC
AVC
ATC
MC
0
_____
$0
_____
_____
1
_____
110
_____
_____
_____
_____
_____
2
_____
150
_____
_____
_____
_____
_____
3
_____
180
_____
_____
_____
_____
_____
4
_____
220
_____
_____
_____
_____
_____
5
_____
270
_____
_____
_____
_____
_____
6
_____
340
_____
_____
_____
_____
_____
7
_____
440
_____
_____
_____
_____
_____
8
_____
580
_____
_____
_____
_____
Questions 5-12 are based on Table 2
5. At zero output TC=80, then what is TFC at zero output?
a. 80
b. 0
c. 100
d. 110
6. What is ATC for the first worker
a. 80
b. 110
c. 190
d. 0
7. At the 5th unit of production ATC is?
a. 350
b. 70
c. 80
d. 100
8. At the 6th unit of production ATC is?
a. 350
b. 70
c. 80
d. 100
9. When output Increase from 5 to 6, Marginal Cost is?
a. 70
b. 80
c. 100
d. 0
10. When output Increase from 0 to 1, Marginal Cost is?
a. 0
b. 80
c. 110
d. Cannot be determined
11. What is AVC for the last unit produced?
a. 72.5
b. 80
c. 0
d. 82.5
12. What is the most efficient level of production?
a. 1-2 units
b. 2-3 units
c. 3-4 units
d. 5-6 units
13. Implicit Costs:
a. Are utilized by accountants to calculate total expenses
b. Are regarded as costs by accountants and by economists
c. Plus explicit costs are equal to economic costs
d. Are an expenditure cost
14. Cash expenditures a firm makes to pay for resources are
called:
a. Implicit costs
b. Explicit costs
c. Normal profit
d. Opportunity costs
15. Suppose that you could either prepare your own tax return
in 15 hours, or hire a tax specialist to prepare it for you in 2
hours. You value your time at $11.00 an hour; the tax specialist
will charge you $55 an hour. The opportunity cost of preparing
your own tax return is:
a. $40
b. $55
c. $22
d. $165
16. Marginal product of labor refers to the
a. Last unit of output produced by labor at the end of each
period
b. Increase in output resulting from employing one more unit of
labor
c. Total output divided by the number of labor employed
d. Smallest unit of the output produced by labor
17. According to the law of diminishing marginal returns:
a. Output will fall and then rise as additional units of input are
employed
b. Employing additional inputs will diminish total output
c. The additional output generated by additional units of an
input will diminish
d. The additional inputs necessary to produce an additional unit
of output will diminish
18. The total product curve graphically shows the:
a. Minimum level of output that can be produced by a quantity
of a variable resource holding constant the quantity of other
resources
b. Minimum level of output that can be produced by a quantity
of a fixed resource letting other resources vary
c. Maximum level of output that can be produced by a quantity
of a fixed resource letting other resources vary
d. Maximum level of output that can be produced by a quantity
of a variable resource holding constant the quantity of other
resources
19. When the total product curve is falling, the:
a. Marginal product of labor is zero
b. Marginal product of labor is negative
c. Average product of labor is increasing
d. Average product of labor must be negative
20. Over the range of positive, but diminishing, marginal
returns for an input, the total product curve:
a. Falls
b. Rises at a constant rate
c. Rises at a decreasing rate
d. Rises at an increasing rate
21. Refer to the above table. With the addition of the second
unit of input, the marginal product is:
a. 15 and the average product is 20
b. 25 and the average product is 10
c. 15 and the average product is 10
d. 10 and the average product is 15
22. Refer to the above table. Diminishing marginal returns sets
in with the addition of the:
a. First unit of input
b. Second unit of input
c. Third unit of input
d. Fourth unit of input
23. Refer to the above graph showing the marginal product
(MPL) and the average product of labor (APL). At which
quantity of labor employed does diminishing marginal returns
set in?
a. A
b. B
c. C
d. D
24. Refer to the above graph showing the marginal product
(MPL) and the average product of labor (APL). At which
quantity of labor employed is total product maximized?
a. A
b. B
c. C
d. D
25. Refer to the above graph. It shows the total product (TP)
curve. At which point does diminishing marginal returns set in?
a. Point a
b. Point b
c. Point c
d. Point d
26. Refer to the above table. With diminishing marginal returns,
if the firm hires seven units of labor, which of the following
numbers would most probably be the total product?
a. 40
b. 39
c. 38
d. 37
27. Variable costs are
a. Sunk costs
b. Costs that change every day
c. Costs that change with the level of production
d. The change in total cost due to the production of an
additional unit of output
28. Fixed costs are those costs which are:
a. Zero if the firm produces no output in the short run
b. Unchanging through time
c. Independent of the rate of output
d. Implicit to a competitive firm
29. Refer to the above graph of cost curves. Total fixed cost at
output level Q2 is measured by:
a. 0B
b. AC
c. CD
d. DE
30. At any level of output:
a. Average variable cost will exceed average total cost in the
short run
b. Marginal cost will exceed average variable cost by the level
of average fixed cost
c. Average variable cost will exceed average fixed cost by the
level of average total cost
d. Average total cost will exceed average variable cost by the
level of average fixed cost
31. Marginal cost can be defined as the:
a. Change in total fixed cost resulting from one more unit of
production
b. Change in total cost resulting from one more unit of
production
c. Change in average total cost resulting from one more unit of
production
d. Change in average variable cost resulting from one more unit
of production
32. Which market model assumes the least number of firms in
an industry?
a. Monopolistic competition
b. Pure competition
c. Pure monopoly
d. Oligopoly
33. Mutual interdependence would tend to limit control over
price in which market model?
a. Monopolistic competition
b. Pure competition
c. Pure monopoly
d. Oligopoly
34. In which two market models would advertising be used most
often?
a. Pure competition and monopolistic competition
b. Pure competition and pure monopoly
c. Monopolistic competition and oligopoly
d. Pure monopoly and oligopoly
35. The fast-food restaurant industry would be an example of
which market model?
a. Monopolistic competition
b. Pure competition
c. Pure monopoly
d. Oligopoly
36. Which of the following is true under conditions of pure
competition?
a. There are differentiated products
b. The market demand curve is perfectly elastic
c. No single firm can influence the market price by changing its
output
d. Each individual firm has the ability to set its own price
37. A purely competitive firm does not try to sell more of its
product by lowering its price below the market price because:
a. Its competitors would not permit it
b. It can sell all it wants to at the market price
c. This would be considered unethical price chiseling
d. Its demand curve is inelastic, so total revenue will decline
38. Average revenue and marginal revenue are equal at each
output level in:
a. Pure competition
b. Monopolistic competition
c. Monopoly
d. Oligopoly
39. In pure competition, each extra unit of output that a firm
sells will yield a marginal revenue that is:
a. Equal to the price
b. Less than the price
c. Greater than the price
d. Equal to the average cost
40. In the standard model of pure competition, a profit-
maximizing firm will shut down in the short run if:
a. Marginal cost is greater than average revenue
b. Average total cost is greater than average revenue
c. Average Fixed cost is greater than average revenue
d. Total revenue is less than total variable cost
41. Given the table above, what is the short-run profit-
maximizing level of output for the firm?
a. 2 units
b. 3 units
c. 4 units
d. 5 units
42. Refer to the above graph for a purely competitive firm in the
short run. The firm would suffer losses if it operates at which of
the following range of output?
a. 0A
b. AB
c. BC
d. Any level below C
43. Refer to the above graph for a purely competitive firm in the
short run. What minimum output level should the firm produce
just for it to break even?
a. A
b. B
c. C
d. Greater than C
44. Refer to the above table. If the firm shuts down in the short
run, the total cost will be:
a. $1,350
b. $2,500
c. $2,700
d. $3,100
45. At what quantity would a purely competitive firm cover all
of its costs and earn only normal profits?
a. Q=5
b. Q=10
c. Q=15
d. Q=20
46. Let us suppose Harry's, a local supplier of chili and pizza,
has the following revenue and cost structure:
a. Harry's should stay open in the long run
b. Harry's should shut down in the short run
c. Harry's should stay open in the short run
d. Harry's should shut down in the short run but reopen in the
long run
47. Refer to the above graph. Which of the output levels is the
profit-maximizing output level for this firm?
a. Q1
b. Q2
c. Q3
d. Q4
48. Refer to the above table for a purely competitive firm. The
market price of the product in the short run is:
a. $40
b. $80
c. $120
d. $160
49. A profit-maximizing firm in the short run will expand
output:
a. Until marginal cost begins to rise
b. Until total revenue equals total cost
c. Until marginal cost equals average variable cost
d. As long as marginal revenue is greater than marginal cost
50. A firm sells a product in a purely competitive market. The
marginal cost of the product at the current output is $4.00 and
the market price is $4.50. What should the firm do?
a. Shut down if the minimum possible average variable cost is
below $4.50
b. Decrease output if the minimum possible average variable
cost is below $4.50
c. Increase output if the minimum possible average variable cost
is below $4.50
d. Decrease output if the minimum possible average variable
cost is above $4.50
51. T-Shirt Enterprises is selling in a purely competitive
market. It is producing 3000 units, selling them for $2.00 each.
At this level of output, the average total cost is 2.50 and the
average variable cost is $2.20. Based on these data, the firm
should:
a. Shut down in the short run
b. Decrease output to 2500 units
c. Continue to produce 3000 units
d. Increase output to 3500 units
52. All of the following statements apply to a purely
competitive market in the long run, except:
a. In the long run, all inputs are variable in quantity
b. Firms can expand their plant capacities in the long run
c. Total fixed costs remain constant even when output expands
in the long run
d. Firms may enter or leave the industry in the long run.
53. If a purely competitive firm is currently facing a situation
where the price of its product is lower than the average variable
cost, but it believes that the market demand for its product will
increase soon, then:
a. The firm will produce a low level of output in the short run,
and leave the industry in the long run
b. The firm will shut down in the short run, and leave the
industry in the long run
c. The firm will produce a low level of output in the short run,
but expand its plant in the long run as demand increases soon
d. The firm will shut down in the short run, but stay in the
industry in the long run if it expects the product price to rise
high enough soon
54. Refer to the graphs above for a purely competitive market in
the short run. The graphs suggest that in the long run, assuming
no changes in the given information:
a. Some firms will exit from this industry
b. More buyers will come to the market
c. New firms will be attracted into the industry
d. Buyers will leave the industry
55. Refer to the graphs above for a purely competitive market in
the short run. The graphs suggest that in the long run, as
automatic market adjustments occur, the demand curve facing
the individual firm will:
a. Shift up
b. Shift down
c. Not shift
d. Slope downward
56. Refer to the above graphs for a competitive market in the
short run. Which of the following statements is true?
a. The firm will increase production
b. The firm is experiencing economic losses
c. The firm is breaking even
d. The firm is making economic profits
57. The long-run supply curve (Resource Cost Industry) would
be upward-sloping if:
a. Resource prices fall as industry production contracts
b. Resource prices rise as industry production contracts
c. Resource prices are not affected by changes in industry
output-level
d. Resource prices are set by the government
58. The long-run market supply curve for a (Resource cost
industry) would be downward-sloping if the representative
firms:
a. Demand curves shift up as the industry expands
b. ATC curves shift down as the industry expands
c. Supply curves shift left as the industry expands
d. Demand curves shift down as the industry expands
59. Which of the following is a barrier to entry?
a. Patents and licenses
b. Buyers' incomes
c. Close substitutes
d. Diminishing marginal returns
60. A monopoly is most likely to emerge and be sustained when:
a. Output demand is relatively elastic
b. Firms have U-shaped, average-total-cost curves
c. Fixed capital costs are small relative to total costs
d. Economies of scale are large relative to market demand
61. The region of demand in which the monopolist will choose a
price-output combination will be:
a. Inelastic because as price declines and output increases, total
revenue will increase
b. Inelastic because as price declines and output increases, total
revenue will decrease
c. Elastic because as price declines and output increases, total
revenue will decrease
d. Elastic because as price declines and output increases, total
revenue will increase
62. Refer to the above graph showing the revenue curves for a
monopolist. What price should be charged in order to maximize
total revenue?
a. P1
b. P2
c. P3
d. P4
63. Refer to the above graph. When the total revenue curve
reaches a maximum, marginal revenue is:
a. Positive
b. Negative
c. Zero
d. Greater than price at that level of output
64. The table shows the demand schedule facing Nina, a
monopolist sell. Refer to the above table for Nina. What is the
change in total revenue if she lowers the price from $20 to $18?
a. $10
b. $20
c. $30
d. $40
65. The table shows the demand schedule facing Nina, a
monopolist selling baskets. Refer to the above table for Nina.
What is the change in total revenue if she raises the price from
$10 to $12?
a. -$300
b. +$300
c. +$120
d. -$120
66. Which of the above shows the correct relationship between
demand and marginal revenue?
a. A
b. B
c. C
d. D
67. A monopolist can sell 20 toys per day for $8.00 each. To
sell 21 toys per day, the price must be cut to $7.00. The
marginal revenue of the 21st toy is:
a. -$10
b. -$13
c. +$7
d. +$21
68. Many people believe that monopolies charge any price they
want to without affecting sales. Instead, the output level for a
profit-maximizing monopoly is determined by:
a. Marginal cost = average revenue
b. Marginal revenue = average cost
c. Average total cost = average revenue
d. Marginal cost = marginal revenue
69. Suppose that a monopolist calculates that at its present
output level, marginal cost is $4.00 and marginal revenue is
$5.00. The firm could increase profits by:
a. Decreasing price and increasing output
b. Increasing price and decreasing output
c. Decreasing price and leaving output unchanged
d. Decreasing output and leaving prices unchanged
70. The data above relate to a pure monopolist and the product
it produces. What is the profit-maximizing output and price for
this monopolist?
a. P = $12; Q = 5
b. P = $14; Q = 4
c. P = $15; Q = 3
d. P = $18; Q = 2
71. Refer to the above graph for a profit-maximizing
monopolist. The firm will set its price at:
a. 0J
b. 0G
c. 0K
d. 0H
72. Refer to the above graph for a profit-maximizing
monopolist. The firm will produce the quantity:
a. 0V
b. 0Y
c. 0T
d. 0X
73. Refer to the above graph for a profit-maximizing
monopolist. At equilibrium, the firm will be earning:
a. Positive profits
b. Negative profits
c. Zero profits
d. Profits that cannot be determined from the given graph
74. Pure monopolists:
a. Maximize MR
b. Are price takers
c. Operate where P > MC
d. Face demand curves that are perfectly inelastic
75. The following data show the relationship between output,
total costs, and total revenue for a pure monopoly. Within
which of the following ranges of output will the firm earn
maximum economic profits?
a. 50 to 60 units
b. 60 to 70 units
c. 70 to 80 units
d. 80 to 90 units
76. Many economists agree that government should deal with
monopolists on a case-by-case basis. Policy options include the
following, except:
a. If the monopoly is attained and maintained through
anticompetitive behavior, the government can file a suit based
on antitrust laws
b. If the firm is a natural monopoly, the government may decide
to regulate its prices and operations
c. If the monopoly is maximizing economic profits, the
government should subsidize new firms to enter the industry
d. If the monopoly is subject, and vulnerable, to potential
competition, the government can decide to leave it alone
77. The economic incentive for price discrimination is based
upon:
a. Prejudices of business managers
b. Differences among sellers' costs
c. A desire to evade antitrust legislation
d. Differences among buyers' elasticity’s of demand
78. To practice long-run price discrimination, a monopolist
must:
a. Be a natural monopoly
b. Charge one price to all buyers
c. Permit the resale of the product by the original buyers
d. Be able to separate buyers into different markets with
different price elasticity’s
79. Which case below best represents a case of price
discrimination?
a. An insurance company offers discounts to safe drivers
b. A major airline sells tickets to senior citizens at lower prices
than to other passengers
c. A professional baseball team pays two players with identical
batting averages different salaries
d. A utility company charges less for electricity used during
"off-peak" hours, when it does not have to operate its less-
efficient generating plants
80. A monopolistically competitive industry is like a purely
competitive industry in that:
a. Each industry produces a standardized product
b. Non-price competition is a feature in both industries
c. Neither industry has significant barriers to entry
d. Firms in both industries face a horizontal demand curve
81. Monopolistic competition is characterized by firms:
a. Producing differentiated products
b. Making economic profits in the long run
c. Producing at optimal productive efficiency
d. Producing where price equals marginal cost
82. One difference between monopolistic competition and pure
competition is that:
a. Products may be homogeneous in monopolistic competition
b. There is some control over price in monopolistic competition
c. Monopolistic competition has significant barriers to entry
d. Firms differentiate their products in pure competition
83. Which of the following is a measure of the degree of
industry concentration?
a. Dow Jones Industrial Index
b. Herfindahl Index
c. Employment Cost Index
d. S&P-500 Index
84. The graph depicts a monopolistically competitive firm.
a. $55 and produce 45 units of output
b. $65 and produce 35 units of output
c. $50 and produce 35 units of output
d. $52 and produce 50 units of output
85. Refer to the above graph. At the profit-maximizing level of
short-run output, this monopolistically competitive firm will be
making a profit of:
a. $275
b. $350
c. $500
d. $525
86. Refer to the above graph. This monopolistically competitive
firm is earning economic profits in the short run and
a. Will continue to have economic profits in the long run
b. Will earn only normal profits in the long run
c. This will cause its demand curve to shift to the right in the
long run
d. This will cause its cost curves to rise in the long run
87. A monopolistically competitive firm is operating at a short-
run level of output where price is $21, average total cost is $15,
marginal cost is $13, and marginal revenue is $13. In the short
run this firm should:
a. Reduce product price
b. Increase the level of output
c. Decrease the level of output
d. Make no change in the level of output
88. Answer the question based on the demand and cost
schedules for a monopolistically competitive firm above. What
output quantity will the monopolistically competitive firm
produce to maximize profits?
a. 2
b. 3
c. 5
d. 6
89. Refer to the above table. At the profit-maximizing level of
output, marginal revenue is:
a. $0
b. $4
c. $5
d. $8
90. Refer to the above graphs. A short-run equilibrium that
would produce profits for a monopolistically competitive firm
would be represented by graph:
a. A
b. B
c. C
d. D
91. You are told that the four-firm concentration ratio in an
industry is 20. Based on this information you can conclude that:
a. Each of the top four firms has 20 percent of industry sales
b. The four largest firms account for a combined 80 percent of
the industry sales
c. The four largest firms account for 20 percent of industry
sales
d. Each of the four largest firms accounts for 5 percent of
industry sales
92. Industry Y is dominated by five large firms that hold market
shares of 20, 25, 15, 10, and 25 percent. The four-firm
concentration ratio for this industry is:
a. 70 percent
b. 80 percent
c. 85 percent
d. 90 percent
93. One major problem with concentration ratios is that they fail
to take into account:
a. The localized market for products
b. Excess capacity in production
c. Price leadership
d. Mutual interdependence
94. When firms in an industry reach an agreement to fix prices,
divide up market share, or otherwise restrict competition, they
are practicing the strategy of:
a. Inter-industry competition
b. Limit pricing
c. Price leadership
d. Collusion
95. The kinked demand model of oligopoly assumes that:
a. Rivals will ignore price increases but will match price cuts
b. Rivals will ignore price cuts but will match price increases
c. The oligopolistic firms are colluding
d. A firm faces a more elastic demand curve if it cuts its price,
and less elastic if it raises price
96. A major prediction of the kinked demand curve model is:
a. Price stability in oligopolies
b. Price instability in oligopolies
c. Stability of production costs in oligopolies
d. Instability of costs in oligopolies
97. On the above graph, if the oligopolist's MC curve shifts
from MC1 to MC2, the firm will charge:
a. A higher price than before and total revenue will increase
b. The same price as before and sell more output; total revenue
will increase
c. The same price as before and sell the same amount of output;
total revenue will remain the same
d. A higher price than before and sell less output; it can't be
determined whether total revenue will change
98. Given the oligopolistic firm pictured above, what is the
profit-maximizing price?
a. P1
b. P2
c. P4
d. 0
99. The strategy of establishing a price that prevents the entry
of new firms is called:
a. Cartel pricing
b. Limit pricing
c. Price leadership
d. Profit maximizing price
100. Which of the following best describes the efficiency
results in oligopoly?
a. P > MC and P = minimum ATC
b. P = MC and P > minimum ATC
c. P = MC and P = minimum ATC
d. P > MC and P > minimum ATC
BACKGROUNDER
Breaking Ground:
The Community Food Security Movement
F O O D F I R S T
I N S T I T U T E F O R F O O D A N D D E V E L O P M E
N T P O L I C Y
BACKGROUNDER
W I N T E R 2 0 0 4 V O L U M E 1 0 • N U M B E R 1 • 5
0 ¢
The U.S. is the world’s largest producer and exporter of food,
yet in 2002, 35 million Americans didn’t know wheretheir next
meal was coming from.1 At the same time, nearly two-thirds of
Americans were overweight. Although hungeris still a reality
for those living in poverty, our food system has created a
condition where “obesity is now a greater threat
to the health and well-being of America’s poor” than hunger.2
One reason the food system is so sick is that
supermarkets are virtually nonexistent in poor
communities. Wealthier neighborhoods have
two to three times as many supermarkets as
lower-income areas, and white neighbor-
hoods have up to four times more supermar-
kets than African-American neighborhoods.3
Without access to nutritious food, poor com-
munities will have unhealthy diets.4
Access to safe and nutritious food concerns
not only America’s poor. Approximately
2,000 Americans die each year from food
poisoning caused by salmonella and E. coli,
in part due to large-scale food processing.5
And in our industrialized, profit-maximizing
agricultural system, mad cow disease has now
become a reality. 6
Today, just ten companies supply more than
half the food and drink sold in the United States.7 Corporate
consolidation of the food industry has reduced farmers to less
than 1 percent of the U.S. population,8 and because production
and distribution is so centralized, food now travels on average
1,500 to 2,500 miles from farm to plate in the U.S.9
Recognizing that dramatic changes aren’t imminent in the
profit-driven food system, a diverse network of activists across
Amer-
ica have begun organizing for a just food system that benefits
consumers and farmers. Family farm groups, food banks, com-
munity gardeners, nutritionists, environmentalists, and
community development organizations are striving to achieve
community
food security10—a condition wherein everyone has a safe,
culturally acceptable, nutritious diet through a sustainable food
system
that maximizes community self-reliance and social justice.11
According to Andy Fisher, Executive Director of the
Community Food Security Coalition, this movement, which has
flowered
in the past seven years, seeks to democratize food production
and distribution by localizing food, using more sustainable and
health-promoting practices, and meeting the needs of
underserved communities.12
by Christine Ahn*
Youth and staff from the Peoples’ Grocery, Oakland, California.
* Christine Ahn is Program Coordinator for the Economic and
Social Human Rights Program at Food First.
P
h
ot
o
b
y
Tr
ac
y
B
ar
lo
w
–{
eo
p
le
s’
G
ro
ce
ry
2
New York’s Just Food
In 2003, 1.6 million people in New York
state received emergency food, further
stressing the soup kitchens and food
pantries that fed 45 percent more people
in 2002 than in 2000.16 And from 1987
to 1997, the state lost about a million
acres of fertile farmland, displacing fam-
ily farmers.
In response to these crises, Just Food
began connecting farmers with urban
families in the New York City area. Since
1996, Just Food has organized thirty
community gardens and thirty-five CSAs,
with each CSA supporting up to six
regional farmers. During the harvest sea-
son, the CSA farmers deliver produce and
meat—usuall y organic and always
fresh—to a central distribution site in the
city. According to Dr. Gussow, who chairs
the Just Food board, demand has soared
faster than local farmers can supply.17
Boston’s Food Project
Transforming vacant lots into lush city
farms is a crucial way to feed a rapidly
growing urban population, and the
Boston-based Food Project has become a
national inspiration to other inner city
communities. In 1991, the first growing
season yielded 4,000 pounds of food
from 2.5 acres of detoxified soil. By 2001,
the Food Project was growing 209,000
Dr. Joan Gussow, Professor Emerita of
Nutrition at Columbia University and
author of This Organic Life (2002),
believes that “the Community Food Secu-
rity movement is still small when com-
pared to the power of...Wal-Mart, but all
across the country, our growth can almost
match theirs.”13
Innovative Models of
Food Justice
Two trends form important pillars of the
community food security movement:
farmers’ markets and community support-
ed agriculture programs (CSAs). Farmers’
markets, the most obvious outlets for farm-
ers to earn a decent price for their produce,
have grown from 1,774 to 3,100 in the
past decade.14 CSAs, also known as sub-
scription farms, allow consumers to buy
advance shares of a farm’s harvest. They
date back thirty years to Japan, where a
group of women concerned about grow-
ing food imports, use of pesticides, and the
corresponding decrease in the farming
population organized a direct relationship
with local farms. CSAs have since spread
to Europe and to the U.S., where over
1,200 now flourish.15
The following are some snapshots of what
community food security looks like in the
United States.
pounds of organic food on a twenty-one-
acre farm and three city lots. The project
donates 55 percent of the food to fifteen
homeless shelters and soup kitchens, sells
5 percent at reasonable prices at inner city
farmers’ markets, and distributes the rest
to 225 CSA shareholders.
The Food Project also gives youth a
chance to learn urban farming, work in
Boston homeless shelters, and run city
farmers’ markets. As youth coordinator
Anim Steele puts it, “We need to involve
young people because they will inherit
our practices, and they need to learn that
alternatives exist.”18
Oakland’s Peoples’ Grocery
Hamburgers, pizza, Chinese take-out, and
donuts are some of the most accessible
foods for West Oakland, California’s
30,000 predominantly African American
and Latino residents. This impoverished
neighborhood has just one grocery store,
forty liquor stores, and a handful of fast
food restaurants.19
In response, community activists started
Peoples’ Grocery, a community garden
and mobile market in the heart of West
Oakland. They transformed a 4,000
square foot vacant lot into a garden that
now grows seasonal fruits and vegetables
and educates youth and residents about
urban renewal, food justice, and revitaliz-
ing the local economy. They also operate
a mobile market on wheels that runs on
bio-diesel fuel and sells fresh produce, sta-
ple goods, and healthy snacks from local
farmers and urban farmers’ markets.
According to co-founder Brahm Ahma-
di, Peoples’ Grocery was founded “with
the long-term goal of building communi-
ty self-reliance in West Oakland. We’ve
chosen food as an organizing tool for our
work because it is personal and universal
to everyone and is fundamental to the
inner workings of a community.”20
Junk Food or Just Food?
Feeding Our Children
As Ahmadi says, the community food
security movement is about organizing,
and the community doesn’t stop at the
school gates.
Residents of Chicago public housing work in their community
vegetable garden.
U
S
D
A
p
h
ot
o
b
y
K
en
H
am
m
on
d
Community Food Security Movement Resources
3
Nationwide, a coalition of students, par-
ents, teachers, administrators, and com-
munity and health advocates are pressing
for farm-to-school programs that help
local farmers supply schools with nutri-
tious food. In 1997, the Santa Moni-
ca–Malibu Unified School District
became the first to stock fresh produce
from a farmers’ market in the salad bars
of all its nine schools. Over 700 school
districts across America now participate
in farm-to-school programs,21 and the
trend is spreading to universities and
other public institutions, including the
Connecticut Department of Corrections.
Since 1999, the Berkeley Unified School
District has purchased from local farmers to
feed its 10,000 students. Berkeley also serves
fresh food in its cafeterias through school
gardens, such as the Martin Luther King Jr.
Middle School’s Edible Schoolyard, found-
ed by Chez Panisse chef Alice Waters.
In Los Angeles, the organizing efforts of
students, parents, and teachers resulted in
a ban on sales of soda and junk food in
cafeterias and student stores throughout
the school district. Other districts are con-
sidering such a ban.
This organizing is in response to an esti-
mate that one-third of our nation’s 23,000
public schools sell fast food to students,
often because tight food budgets lead
administrators to resort to cheap, highly
processed food.22 In Los Angeles—which
serves fast food to its students—75 percent
of students participate in the USDA’s
National School Lunch Program, which
reimburses L.A. schools approximately $33
million per year, thereby subsidizing the
sale of fast food to children. Since school
breakfast and lunch are often the only
meals low income children get all day, the
impact on the health of poor students is
potentially disastrous. As fifteen-year-old
Rosa Villar, a Los Angeles high school stu-
dent, put it, “If schools are responsible for
teaching kids to say no to drugs, tobacco,
and alcohol, then why don’t they tell kids
to say no to fast food?”23
Clearly, change is needed on a large scale,
including at the level of the National
School Lunch Program. Groups within
the movement have successfully pressed
for national legislation, such as the Com-
Community Food Security Coalition
Tel: 310-822-5410
http://www.foodsecurity.org/
Community Supported Agriculture (CSA)
Tel: 301-504-6559
http://www.nal.usda.gov/afsic/csa/
Farmers’ Markets
To find a farmers’ market in your area, go to
http://www.ams.usda.gov/farmersmarkets/map.htm
Farm to School Program
To support funding for this program, go to
http://www.foodsecurity.org/action_alert.html
Community Alliance with Family Farmers
Tel: 530-756-8518
http://www.caff.org/
Just Food, New York
Tel: 212-645-9880
http://www.justfood.org/
The Food Project, Boston
Tel: 617-442-1322
http://www.thefoodproject.org/
Peoples’ Grocery, Oakland
Tel: 510-420-8622
http://www.peoplesgrocery.org
Collard greens grown on Chicago’s
south side.
U
S
D
A
p
h
ot
o
b
y
K
en
H
am
m
on
d
U
S
D
A
p
h
ot
o
b
y
Ja
ck
D
el
an
o
munity Food Security Act of the 1996
Farm Bill, authorizing $16 million in
USDA-funded grants over seven years to
support projects that provide fresher,
more nutritious food in poor neighbor-
hoods and help communities meet their
own food needs. Advocates succeeded in
doubling this amount in the 2002 Farm
Bill. They are now pressing for federal
funds to assist schools with the extra costs
of purchasing directly from local farmers
and for transit programs and distribution
centers to improve food access in both
urban and rural low income communities.
The Way Forward
Organizing around food is often a catalyst
for addressing broader social and econom-
ic justice issues, such as access to affordable
housing and public transportation. The pro-
liferation of local food projects, farmers’
markets, CSAs, farm-to-school programs,
and progressive public policies aimed at
both supplying wholesome food to all and
stemming the loss of family farms should
restore hope that, as Andy Fisher says,
“another food system is possible.”24
These stories do not just describe isolat-
ed pockets of change. The fusing of the
community food security and justice
movement with the movement challeng-
ing globalization and corporate hegemo-
ny could spell the beginning of the end
of the industrial food system.
4
398 60TH STREET • OAKLAND, CALIFORNIA 94618 USA •
TEL: (510) 654-4400 • E-MAIL: [email protected] •
WWW.FOODFIRST.ORG
©2004 BY FOOD FIRST. ALL RIGHTS RESERVED. PLEASE
OBTAIN PERMISSION TO COPY.
Book Order/Membership Form
To order from Food First Books, call (510) 654-4400 or fax
(510) 654-4551 or visit our web site at www.foodfirst.org.
Or to order by mail, use this form.
The following books provide background on the corporate food
system and alternatives to it, and on the human rights struggles
of America’s poor.
❑ Please send me ____ copies of America Needs Human
Rights at $13.95 each $_________________________________
❑ Please send me ____ copies of Shafted: Free Trade and
America’s Working Poor at $10.00 each
$_________________________________
❑ Please send me ____ copies of Genetic Engineering in
Agriculture at $10.00 each
$_________________________________
❑ Please send me ____ copies of earthsummit.biz: The
Corporate Takeover of Sustainable Development at $12.95 each
$_________________________________
❑ Please send me ____ copies of Sustainable Agriculture and
Resistance: Transforming Food Production in Cuba at $18.95
each $_________________________________
SHIPPING: Domestic: $4.50 for the first book, $1.00 for each
additional book. $_________________________________
Foreign: $10.00 for the first book, $6.00 for each additional
book. $_________________________________
MEMBERSHIP/TAX DEDUCTIBLE DONATION:
$35/$50/$100/$250/$500/$1000 ❑ RENEWAL ❑ NEW
MEMBER $_________________________________
SPECIAL YEAR-END DONATION
$_________________________________
TOTAL ENCLOSED $_________________________________
❑ Check enclosed ❑ Charge my: ❑ Visa ❑ MC ❑ Amex Card
#
_____________________________________________________
_______ Exp. ____________
Name:
_____________________________________________________
_____________________________________________________
__________________
Address:
_____________________________________________________
_____________________________________________________
________________
City/State/Zip:
_____________________________________________________
_____________________________________________________
____________
Phone:
_____________________________________________________
_____ E-Mail:
_____________________________________________________
_____
❑ I want to receive We Are Fighting Back! e-mail. ❑ Please
send me a free catalog of publications. ❑ Do not trade my
name with other organizations.
F O O D F I R S T
Notes
I N S T I T U T E F O R F O O D A N D D E V E L O P M E
N T P O L I C Y
1 Mark Nord, Margaret Andrews, and Steven
Carlson, Household Food Security in the
United States, 2002, Food Assistance and
Nutrition Research Report Number 35,
(Food Assistance and Nutrition Research
Program, United States Department of
Agriculture and Economic Research
Service, October 2003), 16.
2 Kelly Brownell and Katherine Battle
Horgen, Food Fight, (McGraw Hill, 2004),
207.
3 Brownell and Horgen, 209.
4 K. Morland, S. Wing, A. Diez Roux, and
C. Poole, “Neighborhood Characteristics
Associated with the Location of Food
Stores and Food Services Places,”
Journal of Preventive Medicine 22
(2002): 23–29.
5 Elizabeth Simpson and Henning Sehms-
dorf, “Nutrition—Body and Soul,” opening
remarks at the national conference “Farm
to Cafeteria: Healthy Farms, Healthy
Students,” Seattle, October 4, 2002.
6 Verlyn Klinkenborg, “Holstein Dairy Cows
and the Inefficient Efficiencies of Modern
Farming,” The New York Times,
January 5, 2004.
7 Russell Shorto, “A Short-Order
Revolutionary,” The New York Times
Magazine, January 11, 2004.
8 Shorto.
9 For an excellent analysis of the vulnerabili-
ty of our food system, see Brian Halweil’s
Home Grown: The Case For Local Food In
A Global Market (Washington, DC: World-
Watch Institute, 2002).
10 Andy Fisher, “Community Food Security:
A Promising Alternative to the Global Food
System,” Community Food Security
Newsletter, Spring 2003.
11 Definition by Mike Hamm and Anne
Bellows from Andy Fisher.
12 Interview, January 22, 2004.
13 Interview, January 22, 2004.
14 Halweil, 38.
15 Margot Roosevelt, “Fresh Off the Farm,”
Time 162, no. 18 (November 3, 2003): 60.
16 Just Food website http://www.justfood.org
17 Interview, January 22, 2004.
18 Interview, January 13, 2004.
19 Interview with Brahm Ahmadi, January
26, 2004.
20 Interview, January 26, 2004.
21 Bob Gottlieb, “Farm to School Update,”
Community Food Security Newsletter,
Spring 2003: 13.
22 Marion Kalb, Farm to School Program,
interview, January 7, 2004.
23 Francesca de la Rosa, Center for Food
Justice, interview, January 8, 2004.
24 Interview, January 22, 2004.

Más contenido relacionado

Similar a Intro to Micro EconomicsTABLE 1U.docx

Page 1 Microeconomics CH 9-10 Take home quiz. Mar.docx
Page 1 Microeconomics CH 9-10 Take home quiz. Mar.docxPage 1 Microeconomics CH 9-10 Take home quiz. Mar.docx
Page 1 Microeconomics CH 9-10 Take home quiz. Mar.docxalfred4lewis58146
 
MAS compilation of questions
MAS compilation of questionsMAS compilation of questions
MAS compilation of questionsacctg2012
 
Acc 434 final exams
Acc 434 final examsAcc 434 final exams
Acc 434 final examsMARKSHEET
 
Acc 434 final exams
Acc 434 final examsAcc 434 final exams
Acc 434 final examshelpwant
 
. FARMLAND INC. PRODUCES 80,000 UNITS OF PRODUCT A AT A TOTAL COST OF $2.4 MI...
. FARMLAND INC. PRODUCES 80,000 UNITS OF PRODUCT A AT A TOTAL COST OF $2.4 MI.... FARMLAND INC. PRODUCES 80,000 UNITS OF PRODUCT A AT A TOTAL COST OF $2.4 MI...
. FARMLAND INC. PRODUCES 80,000 UNITS OF PRODUCT A AT A TOTAL COST OF $2.4 MI...SophiaMorgans
 
Acc 434 final exams
Acc 434 final examsAcc 434 final exams
Acc 434 final examsexamzking
 
PAGE 2Accounting Midterm ExamBe sure to show your w.docx
PAGE  2Accounting Midterm ExamBe sure to show your w.docxPAGE  2Accounting Midterm ExamBe sure to show your w.docx
PAGE 2Accounting Midterm ExamBe sure to show your w.docxalfred4lewis58146
 
MICROECONOMIC QUIZ
MICROECONOMIC QUIZMICROECONOMIC QUIZ
MICROECONOMIC QUIZ3.com
 
Quizxxx
QuizxxxQuizxxx
Quizxxx3.com
 
Production &business organization
Production &business organizationProduction &business organization
Production &business organizationfaculty of commerce
 
Acc 349 final exam
Acc 349 final examAcc 349 final exam
Acc 349 final examsmith54655
 
Acc 349 final exam
Acc 349 final examAcc 349 final exam
Acc 349 final examkiareo
 
Acc 349 final exam
Acc 349 final examAcc 349 final exam
Acc 349 final examliam111221
 
Which of the following is a long run adjustment A. A farmer applies.docx
Which of the following is a long run adjustment A. A farmer applies.docxWhich of the following is a long run adjustment A. A farmer applies.docx
Which of the following is a long run adjustment A. A farmer applies.docxjolleybendicty
 
1) A cost management system provides ________.A) measures of i.docx
1) A cost management system provides ________.A) measures of i.docx1) A cost management system provides ________.A) measures of i.docx
1) A cost management system provides ________.A) measures of i.docxdorishigh
 

Similar a Intro to Micro EconomicsTABLE 1U.docx (15)

Page 1 Microeconomics CH 9-10 Take home quiz. Mar.docx
Page 1 Microeconomics CH 9-10 Take home quiz. Mar.docxPage 1 Microeconomics CH 9-10 Take home quiz. Mar.docx
Page 1 Microeconomics CH 9-10 Take home quiz. Mar.docx
 
MAS compilation of questions
MAS compilation of questionsMAS compilation of questions
MAS compilation of questions
 
Acc 434 final exams
Acc 434 final examsAcc 434 final exams
Acc 434 final exams
 
Acc 434 final exams
Acc 434 final examsAcc 434 final exams
Acc 434 final exams
 
. FARMLAND INC. PRODUCES 80,000 UNITS OF PRODUCT A AT A TOTAL COST OF $2.4 MI...
. FARMLAND INC. PRODUCES 80,000 UNITS OF PRODUCT A AT A TOTAL COST OF $2.4 MI.... FARMLAND INC. PRODUCES 80,000 UNITS OF PRODUCT A AT A TOTAL COST OF $2.4 MI...
. FARMLAND INC. PRODUCES 80,000 UNITS OF PRODUCT A AT A TOTAL COST OF $2.4 MI...
 
Acc 434 final exams
Acc 434 final examsAcc 434 final exams
Acc 434 final exams
 
PAGE 2Accounting Midterm ExamBe sure to show your w.docx
PAGE  2Accounting Midterm ExamBe sure to show your w.docxPAGE  2Accounting Midterm ExamBe sure to show your w.docx
PAGE 2Accounting Midterm ExamBe sure to show your w.docx
 
MICROECONOMIC QUIZ
MICROECONOMIC QUIZMICROECONOMIC QUIZ
MICROECONOMIC QUIZ
 
Quizxxx
QuizxxxQuizxxx
Quizxxx
 
Production &business organization
Production &business organizationProduction &business organization
Production &business organization
 
Acc 349 final exam
Acc 349 final examAcc 349 final exam
Acc 349 final exam
 
Acc 349 final exam
Acc 349 final examAcc 349 final exam
Acc 349 final exam
 
Acc 349 final exam
Acc 349 final examAcc 349 final exam
Acc 349 final exam
 
Which of the following is a long run adjustment A. A farmer applies.docx
Which of the following is a long run adjustment A. A farmer applies.docxWhich of the following is a long run adjustment A. A farmer applies.docx
Which of the following is a long run adjustment A. A farmer applies.docx
 
1) A cost management system provides ________.A) measures of i.docx
1) A cost management system provides ________.A) measures of i.docx1) A cost management system provides ________.A) measures of i.docx
1) A cost management system provides ________.A) measures of i.docx
 

Más de normanibarber20063

Assist with first annotated bibliography.  Assist with f.docx
Assist with first annotated bibliography.  Assist with f.docxAssist with first annotated bibliography.  Assist with f.docx
Assist with first annotated bibliography.  Assist with f.docxnormanibarber20063
 
Assistance needed with SQL commandsI need assistance with the quer.docx
Assistance needed with SQL commandsI need assistance with the quer.docxAssistance needed with SQL commandsI need assistance with the quer.docx
Assistance needed with SQL commandsI need assistance with the quer.docxnormanibarber20063
 
assingment Assignment Agenda Comparison Grid and Fact Sheet or .docx
assingment Assignment Agenda Comparison Grid and Fact Sheet or .docxassingment Assignment Agenda Comparison Grid and Fact Sheet or .docx
assingment Assignment Agenda Comparison Grid and Fact Sheet or .docxnormanibarber20063
 
Assimilate the lessons learned from the dream sequences in Defense o.docx
Assimilate the lessons learned from the dream sequences in Defense o.docxAssimilate the lessons learned from the dream sequences in Defense o.docx
Assimilate the lessons learned from the dream sequences in Defense o.docxnormanibarber20063
 
Assignmnt-500 words with 2 referencesRecognizing the fa.docx
Assignmnt-500 words with 2 referencesRecognizing the fa.docxAssignmnt-500 words with 2 referencesRecognizing the fa.docx
Assignmnt-500 words with 2 referencesRecognizing the fa.docxnormanibarber20063
 
Assignmnt-700 words with 3 referencesToday, there is a crisi.docx
Assignmnt-700 words with 3 referencesToday, there is a crisi.docxAssignmnt-700 words with 3 referencesToday, there is a crisi.docx
Assignmnt-700 words with 3 referencesToday, there is a crisi.docxnormanibarber20063
 
Assignment  For Paper #2, you will pick two poems on a similar th.docx
Assignment  For Paper #2, you will pick two poems on a similar th.docxAssignment  For Paper #2, you will pick two poems on a similar th.docx
Assignment  For Paper #2, you will pick two poems on a similar th.docxnormanibarber20063
 
Assignment Write an essay comparingcontrasting two thingspeople.docx
Assignment Write an essay comparingcontrasting two thingspeople.docxAssignment Write an essay comparingcontrasting two thingspeople.docx
Assignment Write an essay comparingcontrasting two thingspeople.docxnormanibarber20063
 
Assignment Travel Journal to Points of Interest from the Early Midd.docx
Assignment Travel Journal to Points of Interest from the Early Midd.docxAssignment Travel Journal to Points of Interest from the Early Midd.docx
Assignment Travel Journal to Points of Interest from the Early Midd.docxnormanibarber20063
 
Assignment What are the factors that influence the selection of .docx
Assignment What are the factors that influence the selection of .docxAssignment What are the factors that influence the selection of .docx
Assignment What are the factors that influence the selection of .docxnormanibarber20063
 
Assignment Write a research paper that contains the following.docx
Assignment Write a research paper that contains the following.docxAssignment Write a research paper that contains the following.docx
Assignment Write a research paper that contains the following.docxnormanibarber20063
 
Assignment Thinking about Managers and Leaders· Identifya man.docx
Assignment Thinking about Managers and Leaders· Identifya man.docxAssignment Thinking about Managers and Leaders· Identifya man.docx
Assignment Thinking about Managers and Leaders· Identifya man.docxnormanibarber20063
 
Assignment Talk to friends, family, potential beneficiaries abou.docx
Assignment Talk to friends, family, potential beneficiaries abou.docxAssignment Talk to friends, family, potential beneficiaries abou.docx
Assignment Talk to friends, family, potential beneficiaries abou.docxnormanibarber20063
 
Assignment The objective of assignment is to provide a Power .docx
Assignment The objective of assignment is to provide a Power .docxAssignment The objective of assignment is to provide a Power .docx
Assignment The objective of assignment is to provide a Power .docxnormanibarber20063
 
Assignment During the on-ground, residency portion of Skill.docx
Assignment During the on-ground, residency portion of Skill.docxAssignment During the on-ground, residency portion of Skill.docx
Assignment During the on-ground, residency portion of Skill.docxnormanibarber20063
 
Assignment PurposeThe first part of this assignment will assist.docx
Assignment PurposeThe first part of this assignment will assist.docxAssignment PurposeThe first part of this assignment will assist.docx
Assignment PurposeThe first part of this assignment will assist.docxnormanibarber20063
 
Assignment PowerPoint Based on what you have learned so .docx
Assignment PowerPoint Based on what you have learned so .docxAssignment PowerPoint Based on what you have learned so .docx
Assignment PowerPoint Based on what you have learned so .docxnormanibarber20063
 
Assignment In essay format, please answer the following quest.docx
Assignment In essay format, please answer the following quest.docxAssignment In essay format, please answer the following quest.docx
Assignment In essay format, please answer the following quest.docxnormanibarber20063
 
Assignment NameUnit 2 Discussion BoardDeliverable Length150-.docx
Assignment NameUnit 2 Discussion BoardDeliverable Length150-.docxAssignment NameUnit 2 Discussion BoardDeliverable Length150-.docx
Assignment NameUnit 2 Discussion BoardDeliverable Length150-.docxnormanibarber20063
 
Assignment In essay format, please answer the following questions.docx
Assignment In essay format, please answer the following questions.docxAssignment In essay format, please answer the following questions.docx
Assignment In essay format, please answer the following questions.docxnormanibarber20063
 

Más de normanibarber20063 (20)

Assist with first annotated bibliography.  Assist with f.docx
Assist with first annotated bibliography.  Assist with f.docxAssist with first annotated bibliography.  Assist with f.docx
Assist with first annotated bibliography.  Assist with f.docx
 
Assistance needed with SQL commandsI need assistance with the quer.docx
Assistance needed with SQL commandsI need assistance with the quer.docxAssistance needed with SQL commandsI need assistance with the quer.docx
Assistance needed with SQL commandsI need assistance with the quer.docx
 
assingment Assignment Agenda Comparison Grid and Fact Sheet or .docx
assingment Assignment Agenda Comparison Grid and Fact Sheet or .docxassingment Assignment Agenda Comparison Grid and Fact Sheet or .docx
assingment Assignment Agenda Comparison Grid and Fact Sheet or .docx
 
Assimilate the lessons learned from the dream sequences in Defense o.docx
Assimilate the lessons learned from the dream sequences in Defense o.docxAssimilate the lessons learned from the dream sequences in Defense o.docx
Assimilate the lessons learned from the dream sequences in Defense o.docx
 
Assignmnt-500 words with 2 referencesRecognizing the fa.docx
Assignmnt-500 words with 2 referencesRecognizing the fa.docxAssignmnt-500 words with 2 referencesRecognizing the fa.docx
Assignmnt-500 words with 2 referencesRecognizing the fa.docx
 
Assignmnt-700 words with 3 referencesToday, there is a crisi.docx
Assignmnt-700 words with 3 referencesToday, there is a crisi.docxAssignmnt-700 words with 3 referencesToday, there is a crisi.docx
Assignmnt-700 words with 3 referencesToday, there is a crisi.docx
 
Assignment  For Paper #2, you will pick two poems on a similar th.docx
Assignment  For Paper #2, you will pick two poems on a similar th.docxAssignment  For Paper #2, you will pick two poems on a similar th.docx
Assignment  For Paper #2, you will pick two poems on a similar th.docx
 
Assignment Write an essay comparingcontrasting two thingspeople.docx
Assignment Write an essay comparingcontrasting two thingspeople.docxAssignment Write an essay comparingcontrasting two thingspeople.docx
Assignment Write an essay comparingcontrasting two thingspeople.docx
 
Assignment Travel Journal to Points of Interest from the Early Midd.docx
Assignment Travel Journal to Points of Interest from the Early Midd.docxAssignment Travel Journal to Points of Interest from the Early Midd.docx
Assignment Travel Journal to Points of Interest from the Early Midd.docx
 
Assignment What are the factors that influence the selection of .docx
Assignment What are the factors that influence the selection of .docxAssignment What are the factors that influence the selection of .docx
Assignment What are the factors that influence the selection of .docx
 
Assignment Write a research paper that contains the following.docx
Assignment Write a research paper that contains the following.docxAssignment Write a research paper that contains the following.docx
Assignment Write a research paper that contains the following.docx
 
Assignment Thinking about Managers and Leaders· Identifya man.docx
Assignment Thinking about Managers and Leaders· Identifya man.docxAssignment Thinking about Managers and Leaders· Identifya man.docx
Assignment Thinking about Managers and Leaders· Identifya man.docx
 
Assignment Talk to friends, family, potential beneficiaries abou.docx
Assignment Talk to friends, family, potential beneficiaries abou.docxAssignment Talk to friends, family, potential beneficiaries abou.docx
Assignment Talk to friends, family, potential beneficiaries abou.docx
 
Assignment The objective of assignment is to provide a Power .docx
Assignment The objective of assignment is to provide a Power .docxAssignment The objective of assignment is to provide a Power .docx
Assignment The objective of assignment is to provide a Power .docx
 
Assignment During the on-ground, residency portion of Skill.docx
Assignment During the on-ground, residency portion of Skill.docxAssignment During the on-ground, residency portion of Skill.docx
Assignment During the on-ground, residency portion of Skill.docx
 
Assignment PurposeThe first part of this assignment will assist.docx
Assignment PurposeThe first part of this assignment will assist.docxAssignment PurposeThe first part of this assignment will assist.docx
Assignment PurposeThe first part of this assignment will assist.docx
 
Assignment PowerPoint Based on what you have learned so .docx
Assignment PowerPoint Based on what you have learned so .docxAssignment PowerPoint Based on what you have learned so .docx
Assignment PowerPoint Based on what you have learned so .docx
 
Assignment In essay format, please answer the following quest.docx
Assignment In essay format, please answer the following quest.docxAssignment In essay format, please answer the following quest.docx
Assignment In essay format, please answer the following quest.docx
 
Assignment NameUnit 2 Discussion BoardDeliverable Length150-.docx
Assignment NameUnit 2 Discussion BoardDeliverable Length150-.docxAssignment NameUnit 2 Discussion BoardDeliverable Length150-.docx
Assignment NameUnit 2 Discussion BoardDeliverable Length150-.docx
 
Assignment In essay format, please answer the following questions.docx
Assignment In essay format, please answer the following questions.docxAssignment In essay format, please answer the following questions.docx
Assignment In essay format, please answer the following questions.docx
 

Último

Seal of Good Local Governance (SGLG) 2024Final.pptx
Seal of Good Local Governance (SGLG) 2024Final.pptxSeal of Good Local Governance (SGLG) 2024Final.pptx
Seal of Good Local Governance (SGLG) 2024Final.pptxnegromaestrong
 
Making and Justifying Mathematical Decisions.pdf
Making and Justifying Mathematical Decisions.pdfMaking and Justifying Mathematical Decisions.pdf
Making and Justifying Mathematical Decisions.pdfChris Hunter
 
Presentation by Andreas Schleicher Tackling the School Absenteeism Crisis 30 ...
Presentation by Andreas Schleicher Tackling the School Absenteeism Crisis 30 ...Presentation by Andreas Schleicher Tackling the School Absenteeism Crisis 30 ...
Presentation by Andreas Schleicher Tackling the School Absenteeism Crisis 30 ...EduSkills OECD
 
PROCESS RECORDING FORMAT.docx
PROCESS      RECORDING        FORMAT.docxPROCESS      RECORDING        FORMAT.docx
PROCESS RECORDING FORMAT.docxPoojaSen20
 
How to Give a Domain for a Field in Odoo 17
How to Give a Domain for a Field in Odoo 17How to Give a Domain for a Field in Odoo 17
How to Give a Domain for a Field in Odoo 17Celine George
 
ICT Role in 21st Century Education & its Challenges.pptx
ICT Role in 21st Century Education & its Challenges.pptxICT Role in 21st Century Education & its Challenges.pptx
ICT Role in 21st Century Education & its Challenges.pptxAreebaZafar22
 
Measures of Central Tendency: Mean, Median and Mode
Measures of Central Tendency: Mean, Median and ModeMeasures of Central Tendency: Mean, Median and Mode
Measures of Central Tendency: Mean, Median and ModeThiyagu K
 
Web & Social Media Analytics Previous Year Question Paper.pdf
Web & Social Media Analytics Previous Year Question Paper.pdfWeb & Social Media Analytics Previous Year Question Paper.pdf
Web & Social Media Analytics Previous Year Question Paper.pdfJayanti Pande
 
SECOND SEMESTER TOPIC COVERAGE SY 2023-2024 Trends, Networks, and Critical Th...
SECOND SEMESTER TOPIC COVERAGE SY 2023-2024 Trends, Networks, and Critical Th...SECOND SEMESTER TOPIC COVERAGE SY 2023-2024 Trends, Networks, and Critical Th...
SECOND SEMESTER TOPIC COVERAGE SY 2023-2024 Trends, Networks, and Critical Th...KokoStevan
 
Sports & Fitness Value Added Course FY..
Sports & Fitness Value Added Course FY..Sports & Fitness Value Added Course FY..
Sports & Fitness Value Added Course FY..Disha Kariya
 
1029-Danh muc Sach Giao Khoa khoi 6.pdf
1029-Danh muc Sach Giao Khoa khoi  6.pdf1029-Danh muc Sach Giao Khoa khoi  6.pdf
1029-Danh muc Sach Giao Khoa khoi 6.pdfQucHHunhnh
 
Unit-V; Pricing (Pharma Marketing Management).pptx
Unit-V; Pricing (Pharma Marketing Management).pptxUnit-V; Pricing (Pharma Marketing Management).pptx
Unit-V; Pricing (Pharma Marketing Management).pptxVishalSingh1417
 
Z Score,T Score, Percential Rank and Box Plot Graph
Z Score,T Score, Percential Rank and Box Plot GraphZ Score,T Score, Percential Rank and Box Plot Graph
Z Score,T Score, Percential Rank and Box Plot GraphThiyagu K
 
Gardella_Mateo_IntellectualProperty.pdf.
Gardella_Mateo_IntellectualProperty.pdf.Gardella_Mateo_IntellectualProperty.pdf.
Gardella_Mateo_IntellectualProperty.pdf.MateoGardella
 
Application orientated numerical on hev.ppt
Application orientated numerical on hev.pptApplication orientated numerical on hev.ppt
Application orientated numerical on hev.pptRamjanShidvankar
 
APM Welcome, APM North West Network Conference, Synergies Across Sectors
APM Welcome, APM North West Network Conference, Synergies Across SectorsAPM Welcome, APM North West Network Conference, Synergies Across Sectors
APM Welcome, APM North West Network Conference, Synergies Across SectorsAssociation for Project Management
 
Ecological Succession. ( ECOSYSTEM, B. Pharmacy, 1st Year, Sem-II, Environmen...
Ecological Succession. ( ECOSYSTEM, B. Pharmacy, 1st Year, Sem-II, Environmen...Ecological Succession. ( ECOSYSTEM, B. Pharmacy, 1st Year, Sem-II, Environmen...
Ecological Succession. ( ECOSYSTEM, B. Pharmacy, 1st Year, Sem-II, Environmen...Shubhangi Sonawane
 
Measures of Dispersion and Variability: Range, QD, AD and SD
Measures of Dispersion and Variability: Range, QD, AD and SDMeasures of Dispersion and Variability: Range, QD, AD and SD
Measures of Dispersion and Variability: Range, QD, AD and SDThiyagu K
 
Beyond the EU: DORA and NIS 2 Directive's Global Impact
Beyond the EU: DORA and NIS 2 Directive's Global ImpactBeyond the EU: DORA and NIS 2 Directive's Global Impact
Beyond the EU: DORA and NIS 2 Directive's Global ImpactPECB
 
Nutritional Needs Presentation - HLTH 104
Nutritional Needs Presentation - HLTH 104Nutritional Needs Presentation - HLTH 104
Nutritional Needs Presentation - HLTH 104misteraugie
 

Último (20)

Seal of Good Local Governance (SGLG) 2024Final.pptx
Seal of Good Local Governance (SGLG) 2024Final.pptxSeal of Good Local Governance (SGLG) 2024Final.pptx
Seal of Good Local Governance (SGLG) 2024Final.pptx
 
Making and Justifying Mathematical Decisions.pdf
Making and Justifying Mathematical Decisions.pdfMaking and Justifying Mathematical Decisions.pdf
Making and Justifying Mathematical Decisions.pdf
 
Presentation by Andreas Schleicher Tackling the School Absenteeism Crisis 30 ...
Presentation by Andreas Schleicher Tackling the School Absenteeism Crisis 30 ...Presentation by Andreas Schleicher Tackling the School Absenteeism Crisis 30 ...
Presentation by Andreas Schleicher Tackling the School Absenteeism Crisis 30 ...
 
PROCESS RECORDING FORMAT.docx
PROCESS      RECORDING        FORMAT.docxPROCESS      RECORDING        FORMAT.docx
PROCESS RECORDING FORMAT.docx
 
How to Give a Domain for a Field in Odoo 17
How to Give a Domain for a Field in Odoo 17How to Give a Domain for a Field in Odoo 17
How to Give a Domain for a Field in Odoo 17
 
ICT Role in 21st Century Education & its Challenges.pptx
ICT Role in 21st Century Education & its Challenges.pptxICT Role in 21st Century Education & its Challenges.pptx
ICT Role in 21st Century Education & its Challenges.pptx
 
Measures of Central Tendency: Mean, Median and Mode
Measures of Central Tendency: Mean, Median and ModeMeasures of Central Tendency: Mean, Median and Mode
Measures of Central Tendency: Mean, Median and Mode
 
Web & Social Media Analytics Previous Year Question Paper.pdf
Web & Social Media Analytics Previous Year Question Paper.pdfWeb & Social Media Analytics Previous Year Question Paper.pdf
Web & Social Media Analytics Previous Year Question Paper.pdf
 
SECOND SEMESTER TOPIC COVERAGE SY 2023-2024 Trends, Networks, and Critical Th...
SECOND SEMESTER TOPIC COVERAGE SY 2023-2024 Trends, Networks, and Critical Th...SECOND SEMESTER TOPIC COVERAGE SY 2023-2024 Trends, Networks, and Critical Th...
SECOND SEMESTER TOPIC COVERAGE SY 2023-2024 Trends, Networks, and Critical Th...
 
Sports & Fitness Value Added Course FY..
Sports & Fitness Value Added Course FY..Sports & Fitness Value Added Course FY..
Sports & Fitness Value Added Course FY..
 
1029-Danh muc Sach Giao Khoa khoi 6.pdf
1029-Danh muc Sach Giao Khoa khoi  6.pdf1029-Danh muc Sach Giao Khoa khoi  6.pdf
1029-Danh muc Sach Giao Khoa khoi 6.pdf
 
Unit-V; Pricing (Pharma Marketing Management).pptx
Unit-V; Pricing (Pharma Marketing Management).pptxUnit-V; Pricing (Pharma Marketing Management).pptx
Unit-V; Pricing (Pharma Marketing Management).pptx
 
Z Score,T Score, Percential Rank and Box Plot Graph
Z Score,T Score, Percential Rank and Box Plot GraphZ Score,T Score, Percential Rank and Box Plot Graph
Z Score,T Score, Percential Rank and Box Plot Graph
 
Gardella_Mateo_IntellectualProperty.pdf.
Gardella_Mateo_IntellectualProperty.pdf.Gardella_Mateo_IntellectualProperty.pdf.
Gardella_Mateo_IntellectualProperty.pdf.
 
Application orientated numerical on hev.ppt
Application orientated numerical on hev.pptApplication orientated numerical on hev.ppt
Application orientated numerical on hev.ppt
 
APM Welcome, APM North West Network Conference, Synergies Across Sectors
APM Welcome, APM North West Network Conference, Synergies Across SectorsAPM Welcome, APM North West Network Conference, Synergies Across Sectors
APM Welcome, APM North West Network Conference, Synergies Across Sectors
 
Ecological Succession. ( ECOSYSTEM, B. Pharmacy, 1st Year, Sem-II, Environmen...
Ecological Succession. ( ECOSYSTEM, B. Pharmacy, 1st Year, Sem-II, Environmen...Ecological Succession. ( ECOSYSTEM, B. Pharmacy, 1st Year, Sem-II, Environmen...
Ecological Succession. ( ECOSYSTEM, B. Pharmacy, 1st Year, Sem-II, Environmen...
 
Measures of Dispersion and Variability: Range, QD, AD and SD
Measures of Dispersion and Variability: Range, QD, AD and SDMeasures of Dispersion and Variability: Range, QD, AD and SD
Measures of Dispersion and Variability: Range, QD, AD and SD
 
Beyond the EU: DORA and NIS 2 Directive's Global Impact
Beyond the EU: DORA and NIS 2 Directive's Global ImpactBeyond the EU: DORA and NIS 2 Directive's Global Impact
Beyond the EU: DORA and NIS 2 Directive's Global Impact
 
Nutritional Needs Presentation - HLTH 104
Nutritional Needs Presentation - HLTH 104Nutritional Needs Presentation - HLTH 104
Nutritional Needs Presentation - HLTH 104
 

Intro to Micro EconomicsTABLE 1U.docx

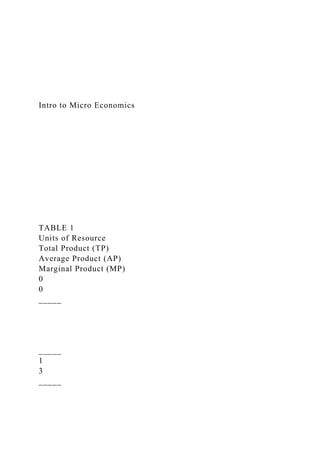
  • 1. Intro to Micro Economics TABLE 1 Units of Resource Total Product (TP) Average Product (AP) Marginal Product (MP) 0 0 _____ _____ 1 3 _____
  • 3. 20 _____ Questions 1-4 are based on the table 1 above 1. What is Average Product from the 1-6 workers? a. 0,1,2,3,4,5,6, b. 1,2,3,4,56,7 c. 3,4,5,5,4.6,3.3 d. 3,8,15,20,23,20 2. What is Marginal Product from the 1-6 workers? a. 0,3,4,5,5,4.6,3.3 b. 0,1,2,3,4,5,6, c. 3,8,15,20,23,20 d. 3,5,7,5,3,-3 3. When Marginal product is greater than average product, average product is … a. Rising b. Constant c. Falling d. Cannot determine 4. When marginal product is less than average product, average product is.. a. Rising b. Constant c. Falling d. Cannot determine TABLE 2 Output Per Day TFC TVC
  • 7. _____ 7 _____ 440 _____ _____ _____ _____ _____ 8 _____ 580 _____ _____ _____ _____ Questions 5-12 are based on Table 2 5. At zero output TC=80, then what is TFC at zero output?
  • 8. a. 80 b. 0 c. 100 d. 110 6. What is ATC for the first worker a. 80 b. 110 c. 190 d. 0 7. At the 5th unit of production ATC is? a. 350 b. 70 c. 80 d. 100 8. At the 6th unit of production ATC is? a. 350 b. 70 c. 80 d. 100 9. When output Increase from 5 to 6, Marginal Cost is? a. 70 b. 80 c. 100 d. 0 10. When output Increase from 0 to 1, Marginal Cost is? a. 0 b. 80 c. 110
  • 9. d. Cannot be determined 11. What is AVC for the last unit produced? a. 72.5 b. 80 c. 0 d. 82.5 12. What is the most efficient level of production? a. 1-2 units b. 2-3 units c. 3-4 units d. 5-6 units 13. Implicit Costs: a. Are utilized by accountants to calculate total expenses b. Are regarded as costs by accountants and by economists c. Plus explicit costs are equal to economic costs d. Are an expenditure cost 14. Cash expenditures a firm makes to pay for resources are called: a. Implicit costs b. Explicit costs c. Normal profit d. Opportunity costs 15. Suppose that you could either prepare your own tax return in 15 hours, or hire a tax specialist to prepare it for you in 2 hours. You value your time at $11.00 an hour; the tax specialist will charge you $55 an hour. The opportunity cost of preparing your own tax return is: a. $40
  • 10. b. $55 c. $22 d. $165 16. Marginal product of labor refers to the a. Last unit of output produced by labor at the end of each period b. Increase in output resulting from employing one more unit of labor c. Total output divided by the number of labor employed d. Smallest unit of the output produced by labor 17. According to the law of diminishing marginal returns: a. Output will fall and then rise as additional units of input are employed b. Employing additional inputs will diminish total output c. The additional output generated by additional units of an input will diminish d. The additional inputs necessary to produce an additional unit of output will diminish 18. The total product curve graphically shows the: a. Minimum level of output that can be produced by a quantity of a variable resource holding constant the quantity of other resources b. Minimum level of output that can be produced by a quantity of a fixed resource letting other resources vary c. Maximum level of output that can be produced by a quantity of a fixed resource letting other resources vary d. Maximum level of output that can be produced by a quantity of a variable resource holding constant the quantity of other resources 19. When the total product curve is falling, the:
  • 11. a. Marginal product of labor is zero b. Marginal product of labor is negative c. Average product of labor is increasing d. Average product of labor must be negative 20. Over the range of positive, but diminishing, marginal returns for an input, the total product curve: a. Falls b. Rises at a constant rate c. Rises at a decreasing rate d. Rises at an increasing rate 21. Refer to the above table. With the addition of the second unit of input, the marginal product is: a. 15 and the average product is 20 b. 25 and the average product is 10 c. 15 and the average product is 10 d. 10 and the average product is 15 22. Refer to the above table. Diminishing marginal returns sets in with the addition of the: a. First unit of input b. Second unit of input c. Third unit of input d. Fourth unit of input
  • 12. 23. Refer to the above graph showing the marginal product (MPL) and the average product of labor (APL). At which quantity of labor employed does diminishing marginal returns set in? a. A b. B c. C d. D 24. Refer to the above graph showing the marginal product (MPL) and the average product of labor (APL). At which quantity of labor employed is total product maximized? a. A b. B c. C d. D 25. Refer to the above graph. It shows the total product (TP) curve. At which point does diminishing marginal returns set in? a. Point a b. Point b c. Point c d. Point d 26. Refer to the above table. With diminishing marginal returns,
  • 13. if the firm hires seven units of labor, which of the following numbers would most probably be the total product? a. 40 b. 39 c. 38 d. 37 27. Variable costs are a. Sunk costs b. Costs that change every day c. Costs that change with the level of production d. The change in total cost due to the production of an additional unit of output 28. Fixed costs are those costs which are: a. Zero if the firm produces no output in the short run b. Unchanging through time c. Independent of the rate of output d. Implicit to a competitive firm 29. Refer to the above graph of cost curves. Total fixed cost at output level Q2 is measured by: a. 0B b. AC c. CD d. DE 30. At any level of output:
  • 14. a. Average variable cost will exceed average total cost in the short run b. Marginal cost will exceed average variable cost by the level of average fixed cost c. Average variable cost will exceed average fixed cost by the level of average total cost d. Average total cost will exceed average variable cost by the level of average fixed cost 31. Marginal cost can be defined as the: a. Change in total fixed cost resulting from one more unit of production b. Change in total cost resulting from one more unit of production c. Change in average total cost resulting from one more unit of production d. Change in average variable cost resulting from one more unit of production 32. Which market model assumes the least number of firms in an industry? a. Monopolistic competition b. Pure competition c. Pure monopoly d. Oligopoly 33. Mutual interdependence would tend to limit control over price in which market model? a. Monopolistic competition b. Pure competition c. Pure monopoly d. Oligopoly
  • 15. 34. In which two market models would advertising be used most often? a. Pure competition and monopolistic competition b. Pure competition and pure monopoly c. Monopolistic competition and oligopoly d. Pure monopoly and oligopoly 35. The fast-food restaurant industry would be an example of which market model? a. Monopolistic competition b. Pure competition c. Pure monopoly d. Oligopoly 36. Which of the following is true under conditions of pure competition? a. There are differentiated products b. The market demand curve is perfectly elastic c. No single firm can influence the market price by changing its output d. Each individual firm has the ability to set its own price 37. A purely competitive firm does not try to sell more of its product by lowering its price below the market price because: a. Its competitors would not permit it b. It can sell all it wants to at the market price c. This would be considered unethical price chiseling d. Its demand curve is inelastic, so total revenue will decline 38. Average revenue and marginal revenue are equal at each
  • 16. output level in: a. Pure competition b. Monopolistic competition c. Monopoly d. Oligopoly 39. In pure competition, each extra unit of output that a firm sells will yield a marginal revenue that is: a. Equal to the price b. Less than the price c. Greater than the price d. Equal to the average cost 40. In the standard model of pure competition, a profit- maximizing firm will shut down in the short run if: a. Marginal cost is greater than average revenue b. Average total cost is greater than average revenue c. Average Fixed cost is greater than average revenue d. Total revenue is less than total variable cost 41. Given the table above, what is the short-run profit- maximizing level of output for the firm? a. 2 units b. 3 units c. 4 units d. 5 units 42. Refer to the above graph for a purely competitive firm in the short run. The firm would suffer losses if it operates at which of the following range of output? a. 0A
  • 17. b. AB c. BC d. Any level below C 43. Refer to the above graph for a purely competitive firm in the short run. What minimum output level should the firm produce just for it to break even? a. A b. B c. C d. Greater than C 44. Refer to the above table. If the firm shuts down in the short run, the total cost will be: a. $1,350 b. $2,500 c. $2,700 d. $3,100 45. At what quantity would a purely competitive firm cover all of its costs and earn only normal profits? a. Q=5 b. Q=10 c. Q=15 d. Q=20 46. Let us suppose Harry's, a local supplier of chili and pizza,
  • 18. has the following revenue and cost structure: a. Harry's should stay open in the long run b. Harry's should shut down in the short run c. Harry's should stay open in the short run d. Harry's should shut down in the short run but reopen in the long run 47. Refer to the above graph. Which of the output levels is the profit-maximizing output level for this firm? a. Q1 b. Q2 c. Q3 d. Q4 48. Refer to the above table for a purely competitive firm. The market price of the product in the short run is: a. $40 b. $80 c. $120 d. $160 49. A profit-maximizing firm in the short run will expand output: a. Until marginal cost begins to rise b. Until total revenue equals total cost c. Until marginal cost equals average variable cost
  • 19. d. As long as marginal revenue is greater than marginal cost 50. A firm sells a product in a purely competitive market. The marginal cost of the product at the current output is $4.00 and the market price is $4.50. What should the firm do? a. Shut down if the minimum possible average variable cost is below $4.50 b. Decrease output if the minimum possible average variable cost is below $4.50 c. Increase output if the minimum possible average variable cost is below $4.50 d. Decrease output if the minimum possible average variable cost is above $4.50 51. T-Shirt Enterprises is selling in a purely competitive market. It is producing 3000 units, selling them for $2.00 each. At this level of output, the average total cost is 2.50 and the average variable cost is $2.20. Based on these data, the firm should: a. Shut down in the short run b. Decrease output to 2500 units c. Continue to produce 3000 units d. Increase output to 3500 units 52. All of the following statements apply to a purely competitive market in the long run, except: a. In the long run, all inputs are variable in quantity b. Firms can expand their plant capacities in the long run c. Total fixed costs remain constant even when output expands in the long run d. Firms may enter or leave the industry in the long run. 53. If a purely competitive firm is currently facing a situation where the price of its product is lower than the average variable cost, but it believes that the market demand for its product will
  • 20. increase soon, then: a. The firm will produce a low level of output in the short run, and leave the industry in the long run b. The firm will shut down in the short run, and leave the industry in the long run c. The firm will produce a low level of output in the short run, but expand its plant in the long run as demand increases soon d. The firm will shut down in the short run, but stay in the industry in the long run if it expects the product price to rise high enough soon 54. Refer to the graphs above for a purely competitive market in the short run. The graphs suggest that in the long run, assuming no changes in the given information: a. Some firms will exit from this industry b. More buyers will come to the market c. New firms will be attracted into the industry d. Buyers will leave the industry 55. Refer to the graphs above for a purely competitive market in the short run. The graphs suggest that in the long run, as automatic market adjustments occur, the demand curve facing the individual firm will: a. Shift up b. Shift down c. Not shift d. Slope downward
  • 21. 56. Refer to the above graphs for a competitive market in the short run. Which of the following statements is true? a. The firm will increase production b. The firm is experiencing economic losses c. The firm is breaking even d. The firm is making economic profits 57. The long-run supply curve (Resource Cost Industry) would be upward-sloping if: a. Resource prices fall as industry production contracts b. Resource prices rise as industry production contracts c. Resource prices are not affected by changes in industry output-level d. Resource prices are set by the government 58. The long-run market supply curve for a (Resource cost industry) would be downward-sloping if the representative firms: a. Demand curves shift up as the industry expands b. ATC curves shift down as the industry expands c. Supply curves shift left as the industry expands d. Demand curves shift down as the industry expands 59. Which of the following is a barrier to entry? a. Patents and licenses b. Buyers' incomes c. Close substitutes d. Diminishing marginal returns 60. A monopoly is most likely to emerge and be sustained when: a. Output demand is relatively elastic b. Firms have U-shaped, average-total-cost curves
  • 22. c. Fixed capital costs are small relative to total costs d. Economies of scale are large relative to market demand 61. The region of demand in which the monopolist will choose a price-output combination will be: a. Inelastic because as price declines and output increases, total revenue will increase b. Inelastic because as price declines and output increases, total revenue will decrease c. Elastic because as price declines and output increases, total revenue will decrease d. Elastic because as price declines and output increases, total revenue will increase 62. Refer to the above graph showing the revenue curves for a monopolist. What price should be charged in order to maximize total revenue? a. P1 b. P2 c. P3 d. P4 63. Refer to the above graph. When the total revenue curve reaches a maximum, marginal revenue is: a. Positive b. Negative c. Zero d. Greater than price at that level of output
  • 23. 64. The table shows the demand schedule facing Nina, a monopolist sell. Refer to the above table for Nina. What is the change in total revenue if she lowers the price from $20 to $18? a. $10 b. $20 c. $30 d. $40 65. The table shows the demand schedule facing Nina, a monopolist selling baskets. Refer to the above table for Nina. What is the change in total revenue if she raises the price from $10 to $12? a. -$300 b. +$300 c. +$120 d. -$120 66. Which of the above shows the correct relationship between demand and marginal revenue? a. A b. B c. C d. D
  • 24. 67. A monopolist can sell 20 toys per day for $8.00 each. To sell 21 toys per day, the price must be cut to $7.00. The marginal revenue of the 21st toy is: a. -$10 b. -$13 c. +$7 d. +$21 68. Many people believe that monopolies charge any price they want to without affecting sales. Instead, the output level for a profit-maximizing monopoly is determined by: a. Marginal cost = average revenue b. Marginal revenue = average cost c. Average total cost = average revenue d. Marginal cost = marginal revenue 69. Suppose that a monopolist calculates that at its present output level, marginal cost is $4.00 and marginal revenue is $5.00. The firm could increase profits by: a. Decreasing price and increasing output b. Increasing price and decreasing output c. Decreasing price and leaving output unchanged d. Decreasing output and leaving prices unchanged 70. The data above relate to a pure monopolist and the product it produces. What is the profit-maximizing output and price for this monopolist? a. P = $12; Q = 5 b. P = $14; Q = 4 c. P = $15; Q = 3
  • 25. d. P = $18; Q = 2 71. Refer to the above graph for a profit-maximizing monopolist. The firm will set its price at: a. 0J b. 0G c. 0K d. 0H 72. Refer to the above graph for a profit-maximizing monopolist. The firm will produce the quantity: a. 0V b. 0Y c. 0T d. 0X 73. Refer to the above graph for a profit-maximizing monopolist. At equilibrium, the firm will be earning: a. Positive profits b. Negative profits c. Zero profits d. Profits that cannot be determined from the given graph 74. Pure monopolists: a. Maximize MR
  • 26. b. Are price takers c. Operate where P > MC d. Face demand curves that are perfectly inelastic 75. The following data show the relationship between output, total costs, and total revenue for a pure monopoly. Within which of the following ranges of output will the firm earn maximum economic profits? a. 50 to 60 units b. 60 to 70 units c. 70 to 80 units d. 80 to 90 units 76. Many economists agree that government should deal with monopolists on a case-by-case basis. Policy options include the following, except: a. If the monopoly is attained and maintained through anticompetitive behavior, the government can file a suit based on antitrust laws b. If the firm is a natural monopoly, the government may decide to regulate its prices and operations c. If the monopoly is maximizing economic profits, the government should subsidize new firms to enter the industry d. If the monopoly is subject, and vulnerable, to potential competition, the government can decide to leave it alone 77. The economic incentive for price discrimination is based upon: a. Prejudices of business managers b. Differences among sellers' costs c. A desire to evade antitrust legislation d. Differences among buyers' elasticity’s of demand
  • 27. 78. To practice long-run price discrimination, a monopolist must: a. Be a natural monopoly b. Charge one price to all buyers c. Permit the resale of the product by the original buyers d. Be able to separate buyers into different markets with different price elasticity’s 79. Which case below best represents a case of price discrimination? a. An insurance company offers discounts to safe drivers b. A major airline sells tickets to senior citizens at lower prices than to other passengers c. A professional baseball team pays two players with identical batting averages different salaries d. A utility company charges less for electricity used during "off-peak" hours, when it does not have to operate its less- efficient generating plants 80. A monopolistically competitive industry is like a purely competitive industry in that: a. Each industry produces a standardized product b. Non-price competition is a feature in both industries c. Neither industry has significant barriers to entry d. Firms in both industries face a horizontal demand curve 81. Monopolistic competition is characterized by firms: a. Producing differentiated products b. Making economic profits in the long run c. Producing at optimal productive efficiency d. Producing where price equals marginal cost
  • 28. 82. One difference between monopolistic competition and pure competition is that: a. Products may be homogeneous in monopolistic competition b. There is some control over price in monopolistic competition c. Monopolistic competition has significant barriers to entry d. Firms differentiate their products in pure competition 83. Which of the following is a measure of the degree of industry concentration? a. Dow Jones Industrial Index b. Herfindahl Index c. Employment Cost Index d. S&P-500 Index 84. The graph depicts a monopolistically competitive firm. a. $55 and produce 45 units of output b. $65 and produce 35 units of output c. $50 and produce 35 units of output d. $52 and produce 50 units of output 85. Refer to the above graph. At the profit-maximizing level of short-run output, this monopolistically competitive firm will be making a profit of: a. $275 b. $350 c. $500 d. $525 86. Refer to the above graph. This monopolistically competitive firm is earning economic profits in the short run and a. Will continue to have economic profits in the long run b. Will earn only normal profits in the long run
  • 29. c. This will cause its demand curve to shift to the right in the long run d. This will cause its cost curves to rise in the long run 87. A monopolistically competitive firm is operating at a short- run level of output where price is $21, average total cost is $15, marginal cost is $13, and marginal revenue is $13. In the short run this firm should: a. Reduce product price b. Increase the level of output c. Decrease the level of output d. Make no change in the level of output 88. Answer the question based on the demand and cost schedules for a monopolistically competitive firm above. What output quantity will the monopolistically competitive firm produce to maximize profits? a. 2 b. 3 c. 5 d. 6 89. Refer to the above table. At the profit-maximizing level of output, marginal revenue is: a. $0 b. $4 c. $5 d. $8
  • 30. 90. Refer to the above graphs. A short-run equilibrium that would produce profits for a monopolistically competitive firm would be represented by graph: a. A b. B c. C d. D 91. You are told that the four-firm concentration ratio in an industry is 20. Based on this information you can conclude that: a. Each of the top four firms has 20 percent of industry sales b. The four largest firms account for a combined 80 percent of the industry sales c. The four largest firms account for 20 percent of industry sales d. Each of the four largest firms accounts for 5 percent of industry sales 92. Industry Y is dominated by five large firms that hold market shares of 20, 25, 15, 10, and 25 percent. The four-firm concentration ratio for this industry is: a. 70 percent b. 80 percent c. 85 percent d. 90 percent 93. One major problem with concentration ratios is that they fail to take into account: a. The localized market for products b. Excess capacity in production c. Price leadership d. Mutual interdependence
  • 31. 94. When firms in an industry reach an agreement to fix prices, divide up market share, or otherwise restrict competition, they are practicing the strategy of: a. Inter-industry competition b. Limit pricing c. Price leadership d. Collusion 95. The kinked demand model of oligopoly assumes that: a. Rivals will ignore price increases but will match price cuts b. Rivals will ignore price cuts but will match price increases c. The oligopolistic firms are colluding d. A firm faces a more elastic demand curve if it cuts its price, and less elastic if it raises price 96. A major prediction of the kinked demand curve model is: a. Price stability in oligopolies b. Price instability in oligopolies c. Stability of production costs in oligopolies d. Instability of costs in oligopolies 97. On the above graph, if the oligopolist's MC curve shifts from MC1 to MC2, the firm will charge: a. A higher price than before and total revenue will increase b. The same price as before and sell more output; total revenue will increase c. The same price as before and sell the same amount of output; total revenue will remain the same d. A higher price than before and sell less output; it can't be determined whether total revenue will change
  • 32. 98. Given the oligopolistic firm pictured above, what is the profit-maximizing price? a. P1 b. P2 c. P4 d. 0 99. The strategy of establishing a price that prevents the entry of new firms is called: a. Cartel pricing b. Limit pricing c. Price leadership d. Profit maximizing price 100. Which of the following best describes the efficiency results in oligopoly? a. P > MC and P = minimum ATC b. P = MC and P > minimum ATC c. P = MC and P = minimum ATC d. P > MC and P > minimum ATC BACKGROUNDER Breaking Ground: The Community Food Security Movement F O O D F I R S T I N S T I T U T E F O R F O O D A N D D E V E L O P M E N T P O L I C Y
  • 33. BACKGROUNDER W I N T E R 2 0 0 4 V O L U M E 1 0 • N U M B E R 1 • 5 0 ¢ The U.S. is the world’s largest producer and exporter of food, yet in 2002, 35 million Americans didn’t know wheretheir next meal was coming from.1 At the same time, nearly two-thirds of Americans were overweight. Although hungeris still a reality for those living in poverty, our food system has created a condition where “obesity is now a greater threat to the health and well-being of America’s poor” than hunger.2 One reason the food system is so sick is that supermarkets are virtually nonexistent in poor communities. Wealthier neighborhoods have two to three times as many supermarkets as lower-income areas, and white neighbor- hoods have up to four times more supermar- kets than African-American neighborhoods.3 Without access to nutritious food, poor com- munities will have unhealthy diets.4 Access to safe and nutritious food concerns not only America’s poor. Approximately 2,000 Americans die each year from food poisoning caused by salmonella and E. coli, in part due to large-scale food processing.5 And in our industrialized, profit-maximizing agricultural system, mad cow disease has now become a reality. 6 Today, just ten companies supply more than half the food and drink sold in the United States.7 Corporate
  • 34. consolidation of the food industry has reduced farmers to less than 1 percent of the U.S. population,8 and because production and distribution is so centralized, food now travels on average 1,500 to 2,500 miles from farm to plate in the U.S.9 Recognizing that dramatic changes aren’t imminent in the profit-driven food system, a diverse network of activists across Amer- ica have begun organizing for a just food system that benefits consumers and farmers. Family farm groups, food banks, com- munity gardeners, nutritionists, environmentalists, and community development organizations are striving to achieve community food security10—a condition wherein everyone has a safe, culturally acceptable, nutritious diet through a sustainable food system that maximizes community self-reliance and social justice.11 According to Andy Fisher, Executive Director of the Community Food Security Coalition, this movement, which has flowered in the past seven years, seeks to democratize food production and distribution by localizing food, using more sustainable and health-promoting practices, and meeting the needs of underserved communities.12 by Christine Ahn* Youth and staff from the Peoples’ Grocery, Oakland, California. * Christine Ahn is Program Coordinator for the Economic and Social Human Rights Program at Food First. P h ot
  • 35. o b y Tr ac y B ar lo w –{ eo p le s’ G ro ce ry 2 New York’s Just Food In 2003, 1.6 million people in New York
  • 36. state received emergency food, further stressing the soup kitchens and food pantries that fed 45 percent more people in 2002 than in 2000.16 And from 1987 to 1997, the state lost about a million acres of fertile farmland, displacing fam- ily farmers. In response to these crises, Just Food began connecting farmers with urban families in the New York City area. Since 1996, Just Food has organized thirty community gardens and thirty-five CSAs, with each CSA supporting up to six regional farmers. During the harvest sea- son, the CSA farmers deliver produce and meat—usuall y organic and always fresh—to a central distribution site in the city. According to Dr. Gussow, who chairs the Just Food board, demand has soared faster than local farmers can supply.17 Boston’s Food Project Transforming vacant lots into lush city farms is a crucial way to feed a rapidly growing urban population, and the Boston-based Food Project has become a national inspiration to other inner city communities. In 1991, the first growing season yielded 4,000 pounds of food from 2.5 acres of detoxified soil. By 2001, the Food Project was growing 209,000 Dr. Joan Gussow, Professor Emerita of Nutrition at Columbia University and author of This Organic Life (2002),
  • 37. believes that “the Community Food Secu- rity movement is still small when com- pared to the power of...Wal-Mart, but all across the country, our growth can almost match theirs.”13 Innovative Models of Food Justice Two trends form important pillars of the community food security movement: farmers’ markets and community support- ed agriculture programs (CSAs). Farmers’ markets, the most obvious outlets for farm- ers to earn a decent price for their produce, have grown from 1,774 to 3,100 in the past decade.14 CSAs, also known as sub- scription farms, allow consumers to buy advance shares of a farm’s harvest. They date back thirty years to Japan, where a group of women concerned about grow- ing food imports, use of pesticides, and the corresponding decrease in the farming population organized a direct relationship with local farms. CSAs have since spread to Europe and to the U.S., where over 1,200 now flourish.15 The following are some snapshots of what community food security looks like in the United States. pounds of organic food on a twenty-one- acre farm and three city lots. The project donates 55 percent of the food to fifteen homeless shelters and soup kitchens, sells 5 percent at reasonable prices at inner city
  • 38. farmers’ markets, and distributes the rest to 225 CSA shareholders. The Food Project also gives youth a chance to learn urban farming, work in Boston homeless shelters, and run city farmers’ markets. As youth coordinator Anim Steele puts it, “We need to involve young people because they will inherit our practices, and they need to learn that alternatives exist.”18 Oakland’s Peoples’ Grocery Hamburgers, pizza, Chinese take-out, and donuts are some of the most accessible foods for West Oakland, California’s 30,000 predominantly African American and Latino residents. This impoverished neighborhood has just one grocery store, forty liquor stores, and a handful of fast food restaurants.19 In response, community activists started Peoples’ Grocery, a community garden and mobile market in the heart of West Oakland. They transformed a 4,000 square foot vacant lot into a garden that now grows seasonal fruits and vegetables and educates youth and residents about urban renewal, food justice, and revitaliz- ing the local economy. They also operate a mobile market on wheels that runs on bio-diesel fuel and sells fresh produce, sta- ple goods, and healthy snacks from local farmers and urban farmers’ markets.
  • 39. According to co-founder Brahm Ahma- di, Peoples’ Grocery was founded “with the long-term goal of building communi- ty self-reliance in West Oakland. We’ve chosen food as an organizing tool for our work because it is personal and universal to everyone and is fundamental to the inner workings of a community.”20 Junk Food or Just Food? Feeding Our Children As Ahmadi says, the community food security movement is about organizing, and the community doesn’t stop at the school gates. Residents of Chicago public housing work in their community vegetable garden. U S D A p h ot o b y K en
  • 40. H am m on d Community Food Security Movement Resources 3 Nationwide, a coalition of students, par- ents, teachers, administrators, and com- munity and health advocates are pressing for farm-to-school programs that help local farmers supply schools with nutri- tious food. In 1997, the Santa Moni- ca–Malibu Unified School District became the first to stock fresh produce from a farmers’ market in the salad bars of all its nine schools. Over 700 school districts across America now participate in farm-to-school programs,21 and the trend is spreading to universities and other public institutions, including the Connecticut Department of Corrections. Since 1999, the Berkeley Unified School District has purchased from local farmers to feed its 10,000 students. Berkeley also serves fresh food in its cafeterias through school gardens, such as the Martin Luther King Jr. Middle School’s Edible Schoolyard, found-
  • 41. ed by Chez Panisse chef Alice Waters. In Los Angeles, the organizing efforts of students, parents, and teachers resulted in a ban on sales of soda and junk food in cafeterias and student stores throughout the school district. Other districts are con- sidering such a ban. This organizing is in response to an esti- mate that one-third of our nation’s 23,000 public schools sell fast food to students, often because tight food budgets lead administrators to resort to cheap, highly processed food.22 In Los Angeles—which serves fast food to its students—75 percent of students participate in the USDA’s National School Lunch Program, which reimburses L.A. schools approximately $33 million per year, thereby subsidizing the sale of fast food to children. Since school breakfast and lunch are often the only meals low income children get all day, the impact on the health of poor students is potentially disastrous. As fifteen-year-old Rosa Villar, a Los Angeles high school stu- dent, put it, “If schools are responsible for teaching kids to say no to drugs, tobacco, and alcohol, then why don’t they tell kids to say no to fast food?”23 Clearly, change is needed on a large scale, including at the level of the National School Lunch Program. Groups within the movement have successfully pressed for national legislation, such as the Com-
  • 42. Community Food Security Coalition Tel: 310-822-5410 http://www.foodsecurity.org/ Community Supported Agriculture (CSA) Tel: 301-504-6559 http://www.nal.usda.gov/afsic/csa/ Farmers’ Markets To find a farmers’ market in your area, go to http://www.ams.usda.gov/farmersmarkets/map.htm Farm to School Program To support funding for this program, go to http://www.foodsecurity.org/action_alert.html Community Alliance with Family Farmers Tel: 530-756-8518 http://www.caff.org/ Just Food, New York Tel: 212-645-9880 http://www.justfood.org/ The Food Project, Boston Tel: 617-442-1322 http://www.thefoodproject.org/ Peoples’ Grocery, Oakland Tel: 510-420-8622 http://www.peoplesgrocery.org Collard greens grown on Chicago’s south side.
  • 44. b y Ja ck D el an o munity Food Security Act of the 1996 Farm Bill, authorizing $16 million in USDA-funded grants over seven years to support projects that provide fresher, more nutritious food in poor neighbor- hoods and help communities meet their own food needs. Advocates succeeded in doubling this amount in the 2002 Farm Bill. They are now pressing for federal funds to assist schools with the extra costs of purchasing directly from local farmers and for transit programs and distribution centers to improve food access in both urban and rural low income communities. The Way Forward Organizing around food is often a catalyst for addressing broader social and econom- ic justice issues, such as access to affordable housing and public transportation. The pro- liferation of local food projects, farmers’ markets, CSAs, farm-to-school programs, and progressive public policies aimed at
  • 45. both supplying wholesome food to all and stemming the loss of family farms should restore hope that, as Andy Fisher says, “another food system is possible.”24 These stories do not just describe isolat- ed pockets of change. The fusing of the community food security and justice movement with the movement challeng- ing globalization and corporate hegemo- ny could spell the beginning of the end of the industrial food system. 4 398 60TH STREET • OAKLAND, CALIFORNIA 94618 USA • TEL: (510) 654-4400 • E-MAIL: [email protected] • WWW.FOODFIRST.ORG ©2004 BY FOOD FIRST. ALL RIGHTS RESERVED. PLEASE OBTAIN PERMISSION TO COPY. Book Order/Membership Form To order from Food First Books, call (510) 654-4400 or fax (510) 654-4551 or visit our web site at www.foodfirst.org. Or to order by mail, use this form. The following books provide background on the corporate food system and alternatives to it, and on the human rights struggles of America’s poor. ❑ Please send me ____ copies of America Needs Human Rights at $13.95 each $_________________________________
  • 46. ❑ Please send me ____ copies of Shafted: Free Trade and America’s Working Poor at $10.00 each $_________________________________ ❑ Please send me ____ copies of Genetic Engineering in Agriculture at $10.00 each $_________________________________ ❑ Please send me ____ copies of earthsummit.biz: The Corporate Takeover of Sustainable Development at $12.95 each $_________________________________ ❑ Please send me ____ copies of Sustainable Agriculture and Resistance: Transforming Food Production in Cuba at $18.95 each $_________________________________ SHIPPING: Domestic: $4.50 for the first book, $1.00 for each additional book. $_________________________________ Foreign: $10.00 for the first book, $6.00 for each additional book. $_________________________________ MEMBERSHIP/TAX DEDUCTIBLE DONATION: $35/$50/$100/$250/$500/$1000 ❑ RENEWAL ❑ NEW MEMBER $_________________________________ SPECIAL YEAR-END DONATION $_________________________________ TOTAL ENCLOSED $_________________________________ ❑ Check enclosed ❑ Charge my: ❑ Visa ❑ MC ❑ Amex Card # _____________________________________________________ _______ Exp. ____________
  • 47. Name: _____________________________________________________ _____________________________________________________ __________________ Address: _____________________________________________________ _____________________________________________________ ________________ City/State/Zip: _____________________________________________________ _____________________________________________________ ____________ Phone: _____________________________________________________ _____ E-Mail: _____________________________________________________ _____ ❑ I want to receive We Are Fighting Back! e-mail. ❑ Please send me a free catalog of publications. ❑ Do not trade my name with other organizations. F O O D F I R S T Notes I N S T I T U T E F O R F O O D A N D D E V E L O P M E N T P O L I C Y 1 Mark Nord, Margaret Andrews, and Steven Carlson, Household Food Security in the United States, 2002, Food Assistance and
  • 48. Nutrition Research Report Number 35, (Food Assistance and Nutrition Research Program, United States Department of Agriculture and Economic Research Service, October 2003), 16. 2 Kelly Brownell and Katherine Battle Horgen, Food Fight, (McGraw Hill, 2004), 207. 3 Brownell and Horgen, 209. 4 K. Morland, S. Wing, A. Diez Roux, and C. Poole, “Neighborhood Characteristics Associated with the Location of Food Stores and Food Services Places,” Journal of Preventive Medicine 22 (2002): 23–29. 5 Elizabeth Simpson and Henning Sehms- dorf, “Nutrition—Body and Soul,” opening remarks at the national conference “Farm to Cafeteria: Healthy Farms, Healthy Students,” Seattle, October 4, 2002. 6 Verlyn Klinkenborg, “Holstein Dairy Cows and the Inefficient Efficiencies of Modern Farming,” The New York Times, January 5, 2004. 7 Russell Shorto, “A Short-Order Revolutionary,” The New York Times Magazine, January 11, 2004. 8 Shorto.
  • 49. 9 For an excellent analysis of the vulnerabili- ty of our food system, see Brian Halweil’s Home Grown: The Case For Local Food In A Global Market (Washington, DC: World- Watch Institute, 2002). 10 Andy Fisher, “Community Food Security: A Promising Alternative to the Global Food System,” Community Food Security Newsletter, Spring 2003. 11 Definition by Mike Hamm and Anne Bellows from Andy Fisher. 12 Interview, January 22, 2004. 13 Interview, January 22, 2004. 14 Halweil, 38. 15 Margot Roosevelt, “Fresh Off the Farm,” Time 162, no. 18 (November 3, 2003): 60. 16 Just Food website http://www.justfood.org 17 Interview, January 22, 2004. 18 Interview, January 13, 2004. 19 Interview with Brahm Ahmadi, January 26, 2004. 20 Interview, January 26, 2004. 21 Bob Gottlieb, “Farm to School Update,” Community Food Security Newsletter,
  • 50. Spring 2003: 13. 22 Marion Kalb, Farm to School Program, interview, January 7, 2004. 23 Francesca de la Rosa, Center for Food Justice, interview, January 8, 2004. 24 Interview, January 22, 2004.