Online Employment Situation Summary - April 2010
•
1 recomendación•1,330 vistas

As the largest and fastest growing marketplace for online work, oDesk has its finger on the pulse of online work trends. Check out our Online Employment Situation Summary, a companion to the monthly Bureau of Labor Statistics report for the latest trends influencing the future of work.

Recomendados
Recomendados
Más contenido relacionado
Último
Último (20)
Destacado
Destacado (20)
Online Employment Situation Summary - April 2010
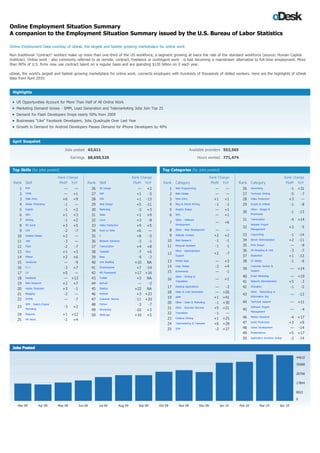
- 1. Online Employment Situation Summary A companion to the Employment Situation Summary issued by the U.S. Bureau of Labor Statistics Online Employment Data courtesy of oDesk, the largest and fastest-growing marketplace for online work Non-traditional "contract" workers make up more than one-third of the US workforce, a segment growing at twice the rate of the standard workforce (source: Human Capital Institute). Online work - also commonly referred to as remote, contract, freelance or contingent work - is fast becoming a mainstream alternative to full-time employment. More than 90% of U.S. firms now use contract talent on a regular basis and are spending $120 billion on it each year. oDesk, the world's largest and fastest-growing marketplace for online work, connects employers with hundreds of thousands of skilled workers. Here are the highlights of oDesk data from April 2010: Highlights US Opportunities Account for More Than Half of All Online Work Marketing Demand Grows - SMM, Lead Generation and Telemarketing Jobs Join Top 25 Demand for Flash Developers Drops nearly 50% from 2009 Businesses "Like" Facebook Developers, Jobs Quadruple Over Last Year Growth in Demand for Android Developers Passes Demand for iPhone Developers by 40% April Snapshot Jobs posted 43,611 Available providers 552,565 Earnings $8,650,526 Hours worked 771,474 Top Skills (by jobs posted) Top Categories (by jobs posted) Rank Change Rank Change Rank Change Rank Change Rank Skill MoM YoY Rank Skill MoM YoY Rank Category MoM YoY Rank Category MoM YoY 1 PHP — — 26 3D Design — +2 1 Web Programming — — 26 Advertising -1 +31 2 HTML — +1 27 ASP +1 -5 2 Web Design — — 27 Technical Writing -5 -7 3 Data Entry +6 +9 28 XML +1 -13 3 Data Entry +1 +1 28 Video Production +3 — 4 Adobe Photoshop -1 — 29 Web Design +5 -11 4 Blog & Article Writing -1 -1 29 Scripts & Utilities -1 -8 5 English -1 +2 30 Marketing -3 +3 5 Graphic Design — +1 Other - Design & 30 -1 -13 6 SEO +1 +3 31 Sales +1 +9 6 SEO — +1 Multimedia 7 Writing -1 +2 32 Linux +3 -8 Other - Software 31 Transcription -4 +14 7 — +6 8 MS Excel +3 +5 33 Video Production +9 +5 Development 32 Website Project +2 -5 9 CSS -2 -7 34 Ruby on Rails +6 — 8 Other - Web Development — — Management 10 Graphic Design +2 — 35 C +8 -5 9 Website Content +2 +2 33 Copywriting -1 -14 11 .Net -3 — 36 Network Solutions -3 -1 10 Web Research -1 -1 34 Server Administration +2 -11 12 Flash -2 -7 37 Transcription +4 +8 11 Personal Assistant -1 -1 35 Print Design — -9 13 Java +1 +3 38 Typepad -7 +6 Other - Administrative 36 3D Modeling & CAD -3 -7 12 +2 -7 14 iPhone +2 +6 39 Ebay -9 -2 Support 37 Illustration +1 -12 15 JavaScript — -9 40 Link Building +10 NA 13 Mobile Apps — +3 38 UI Design -1 -6 16 C++ -3 +7 41 Dreamweaver +7 -14 14 Logo Design -2 +4 Customer Service & 39 — +14 17 C# +0 — 42 MS Powerpoint +17 +16 15 Ecommerce — -1 Support 18 Facebook — +13 43 Twitter +3 NA Other - Writing & 40 Email Marketing — +19 16 — +1 Translation 41 Network Administration +5 -3 19 Web Research +2 +7 44 ActiveX — -2 20 Adobe Illustrator +3 -1 45 Sibelius +22 NA 17 Desktop Applications — -2 42 Animation -1 -2 21 -2 — 46 +3 +23 18 Sales & Lead Generation — +26 Other - Networking & Blogging Android 43 — -13 22 XHTML — -7 47 Customer Service -11 +20 19 SMM +1 +41 Information Sys. 20 Other - Sales & Marketing -1 +30 44 Technical support — +11 SEM - Search Engine 48 Python -3 -7 23 -3 +2 21 Other - Business Services +5 +21 Software Project Marketing 49 Wordpress -10 +3 45 Management — -4 24 Magento +1 +12 50 WebLogic +10 +5 22 Translation -1 — 23 Creative Writing +1 +25 46 Market Research -4 +17 25 MS Word -1 +4 24 Telemarketing & Telesales +6 +28 47 Audio Production +3 +9 25 SEM -2 +27 48 Game Development — -14 49 Presentations +5 +17 50 Application Interface Design -2 -14
- 2. Global Online Work BUYER SPEND (in USD) USA Australia Canada India Philippines Russia Ukraine UK Other Total Earned USA 739,055 35,272 57,315 659 246 47 22,385 327,105 1,182,085 Australia 12,285 15,193 511 247 6,172 34,439 Canada 87,661 7,267 10,825 14 3,197 6,371 115,336 India 1,510,218 191,429 113,834 3,490 2,714 14 3 154,432 585,420 2,561,555 Philippines 734,682 130,526 59,865 1,359 4,853 163 3 71,545 148,492 1,151,488 Russia 594,879 46,419 36,220 44 252 56 37,840 149,801 865,512 Ukraine 458,752 63,788 55,955 205 842 551 57,363 189,650 827,107 UK 67,564 4,390 1,143 160 118 20,703 16,254 110,332 Other 1,082,706 125,894 115,894 1,820 672 524 22 122,890 352,161 1,802,673 Totals 5,287,802 620,179 451,653 7,592 8,645 1,912 682 490,632 1,781,428 8,650,526 Top Provider Countries Top Cities (by available providers April 2010) 1 Philippines 1 Chandigarh, India 10 Ahmedabad, India 19 Rawalpindi, Pakistan 2 India 2 Dhaka, Bangladesh 11 Indore, India 20 Kolkata, India 3 United States 3 Mohali, India 12 Karachi, Pakistan 21 Bacolod City, Philippines 4 Ukraine 4 Quezon City, Philippines 13 Taganrog, Russia 22 Cagayan de Oro City, Philippines 5 Pakistan 5 Bangalore, India 14 New Delhi, India 23 Trivandrum, India 6 Russia 6 Lahore, Pakistan 15 Kiev, Ukraine 24 Noida, India 7 Bangladesh 7 Cebu City, Philippines 16 Dumaguete City, Philippines 25 Sevastopol, Ukraine 8 United Kingdom 8 Manila, Philippines 17 Hyderabad, India 9 Canada 9 Iligan City, Phillipines 18 Pune, India 10 China U.S. Average Hourly Rates 25.17 24 18 12 Writing Administrative Support Business Services Design Tech U.S. Average 6 0 Mar Apr May Jun Jul Aug Sep Oct Nov Dec Jan Feb Mar Apr 09 09 09 09 09 09 09 09 09 09 10 10 10 10 Top States (rank, state, unemployment rate) 1 California (13%) 6 Georgia (10.4%) 11 Virginia (7.6%) 16 Indiana (10.2%) 21 Tennessee (10.8%) 2 Texas (8.2%) 7 Pennsylvania (9.4%) 12 Massachussetts (9.3%) 17 Colorado (8.4%) 22 Montana (10.2%) 3 Florida (12%) 8 North Carolina (10.9%) 13 New Jersey (10.2%) 18 Arizona (9.4%) 23 Utah (7.4%) 4 Illinois (11.7%) 9 Michigan (14.9%) 14 Oregon (11.7%) 19 South Carolina (11.7%) 24 Alabama (10.9%) 5 New York (8.8%) 10 Ohio (11.5%) 15 Washington (9.9%) 20 Minnesota (8.2%) 25 Maryland (7.7%) Top Cities (by available providers April 2010) 1 New York 6 Charlotte 11 Fairfax (VA) 16 Atlanta 21 Sacramento 2 San Diego 7 Miami 12 Dallas 17 Omaha 22 Torrance (CA) 3 Los Angeles 8 Las Vegas 13 Philadelphia 18 San Jose 23 Raleigh 4 Austin 9 Houston 14 Portland 19 Fort Worth 24 Tuscon 5 Tampa 10 San Francisco 15 Orlando 20 Pittsburgh 25 Phoenix Questions? Learn more at http://www.odesk.com/oconomy or contact us at ojr@odesk.com