Chap4 Final Exam Extra Answers
•Descargar como DOC, PDF•
0 recomendaciones•2,129 vistas


Recomendados
Más contenido relacionado
La actualidad más candente
La actualidad más candente (20)
Similar a Chap4 Final Exam Extra Answers
Similar a Chap4 Final Exam Extra Answers (20)
Más de Ali Osman Öncel
Más de Ali Osman Öncel (20)
Último
Último (20)
Chap4 Final Exam Extra Answers
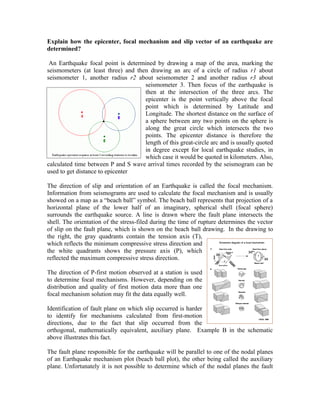
- 1. Explain how the epicenter, focal mechanism and slip vector of an earthquake are determined? An Earthquake focal point is determined by drawing a map of the area, marking the seismometers (at least three) and then drawing an arc of a circle of radius r1 about seismometer 1, another radius r2 about seismometer 2 and another radius r3 about seismometer 3. Then focus of the earthquake is then at the intersection of the three arcs. The epicenter is the point vertically above the focal point which is determined by Latitude and Longitude. The shortest distance on the surface of a sphere between any two points on the sphere is along the great circle which intersects the two points. The epicenter distance is therefore the length of this great-circle arc and is usually quoted in degree except for local earthquake studies, in which case it would be quoted in kilometers. Also, calculated time between P and S wave arrival times recorded by the seismogram can be used to get distance to epicenter The direction of slip and orientation of an Earthquake is called the focal mechanism. Information from seismograms are used to calculate the focal mechanism and is usually showed on a map as a “beach ball” symbol. The beach ball represents that projection of a horizontal plane of the lower half of an imaginary, spherical shell (focal sphere) surrounds the earthquake source. A line is drawn where the fault plane intersects the shell. The orientation of the stress-filed during the time of rupture determines the vector of slip on the fault plane, which is shown on the beach ball drawing. In the drawing to the right, the gray quadrants contain the tension axis (T), which reflects the minimum compressive stress direction and the white quadrants shows the pressure axis (P), which reflected the maximum compressive stress direction. The direction of P-first motion observed at a station is used to determine focal mechanisms. However, depending on the distribution and quality of first motion data more than one focal mechanism solution may fit the data equally well. Identification of fault plane on which slip occurred is harder to identify for mechanisms calculated from first-motion directions, due to the fact that slip occurred from the orthogonal, mathematically equivalent, auxiliary plane. Example B in the schematic above illustrates this fact. The fault plane responsible for the earthquake will be parallel to one of the nodal planes of an Earthquake mechanism plot (beach ball plot), the other being called the auxiliary plane. Unfortunately it is not possible to determine which of the nodal planes the fault
- 2. plane is in fact. For this other geological or geophysical evidence is needed to remove the ambiguity. The slip vector along the fault lies within the fault plane, 90 deg from the N- axis 2. How would you distinguish between Love waves and Rayleigh waves if you were given an earthquake record from a WWSSN station? Answer: Rayleigh, also known as “ground roll” waves occur close to the surface of a semi-infinite medium. They are generated by the interaction of P- and S- waves at the surface of the earth. Their velocity is lower than the P-, S- and Love wave velocities. Rayleigh waves travel about ten (10) times the speed of sound in air. The particle motion of these waves is confined to a vertical plane containing the direction of propagation. They are recorded both by the vertical component and by the horizontal component of the WWSSN station seismometer. The amplitude of Rayleigh waves decreases rapidly with depth of the earthquake. Earthquakes may generate Rayleigh waves that travel several times around the world before dissipating. In contrast, Love waves occur when there is a general increase of S-wave velocity with depth. They propagate by multiple internal reflections of horizontally polarized S-waves (SH-waves) in this near-surface medium and thus propagate in a waveguide. The Love-wave particle motion is transverse and horizontal, so they will be only recorded by the WWSSN station horizontal seismometer. Love waves take a log time to dissipate due to their high energy content. This makes Love waves most destructive in the immediate area of the focus or epicenter of the earthquake. 3. a) Which types of seismic waves can propagate in an unbounded solid medium? Body waves travel through unbounded solid medium. b) Which types of seismic wave can be detected by a vertical- component seismometer? A vertical seismograph will only record a horizontal S wave because the vertical components of such waves vibrate vertically. The vertical seismograph will not record a horizontal P wave approaching it as such a wave would be vibrating back and forth horizontally in the direction of propagation and therefore, would not be recordable on a vertical seismograph. This is because vertical seismographs only records vertical motion.
- 3. Most seismometers detect ground motion using a mass which is suspended in some fashion by a spring. When the ground moves (say in an up and down or vertical motion), the seismometer's frame also moves, but the mass tends to remain relatively steady because of inertia. The relative motion of the mass with respect to the frame (and thus the ground) is then converted to an electrical signal (voltage variations with time) using a capacitor plate, a galvanometer or a magnet and coil assembly. Seismometers are usually sensitive to one component (direction) of ground motion (vertical or horizontal) and thus three components are used to completely characterize the seismic signals. A typical vertical component seismometer design is illustrated in Figure 1. 4. Contrast the distribution of earthquake foci in and around the Atlantic and Pacific Oceans and describe the mechanism of earthquakes on the mid-ocean ridges. What light do these facts through on the plate? Earthquake distribution in both Atlantic and Pacific Ocean follow active plate boundaries. These earthquakes are as a result of plate movements. Most earthquakes in the Pacific Ocean occur in the so called “Ring of Fire”. This is an area of 40,000 km, half circle shaped associate with volcanic arcs, oceanic tranches, and volcanic belts. This place is the location of 75% of the earth’s active and dormant volcanoes. 80% of the earth’s largest earthquakes and 90% of all earth quakes occur at this location. As illustrated by the figure the right, the earthquakes in the pacific range in depth from 70 to 800 km (www.wikipedia). As illustrated by the picture to the right, most deep earthquakes in the pacific occur along the Australian, Philippine, Cocos and Nacza plate boundaries. In contrast the Atlantic Ocean earthquakes are mostly associated with the mid-oceanic ridge. These earthquakes tend to be shallower in the range of 0 -70 km (see picture above). These earthquakes show that in convergent plate boundaries such as the boundaries that surround the Pacific plate, earthquakes tend to be deeper and larger in magnitude. In contract, at divergent plate boundaries such as the Atlantic Mid-Oceanic ridge, earthquakes there tend to be shallower and lower in magnitudes.
- 4. 5. How much greater is a nuclear-explosion body wave amplitude likely to be than an earthquake body-wave amplitude if both waves have the same Ms (Surface Wave Magnitude) value and are recorded at the same distance? Answer: Nuclear explosions are less efficient at generating surface waves than are earthquakes with the same body-wave magnitude. In general, nuclear explosion body waves have Mb values of 1.0 – 1.5 units greater than those for Earthquakes with the same Ms Values. 6. How do seismologists differentiate between earthquake and nuclear explorations? In order to differentiate a nuclear exploration from an earthquake one must consider parameters such as location, depth and shape of the waveforms. Nuclear explosions have all been shallower than 2 km. Thus an event with focal depth of 200 km is most likely not a nuclear explosion. The first P-wave form from an explosion to arrive at any seismic station should be compressional, where as the first arrival from an earthquake will be either dilatational or compressional, depending upon the azimuth. In addition, nuclear explorations are compressional source and generate strong P-waves in all directions with little shear energy (S-waves and surface waves). In contrast, earthquake energy is produced by a slippage on a fault surface thus the first motion can be both compressional and extensional. As nations trying to conceal their nuclear testing activities use smaller yield tests, it becomes more and more challenging for forensic seismologist to identify nuclear explosion for the natural and man-made none nuclear events. To help with this difficult situation, scientist have complied a huge data base of naturally occurring and other none nuclear events to help computer programs model the nuclear events. Key algorithms provide discriminates between nuclear and none nuclear explosions is the characteristic features of a waveform (peak-to-peak distance, height, width, or some ratio). A particularly useful discriminator, for example, is the ratio of P-wave amplitude to S-wave amplitude. The P (or primary) wave is a compression wave that is the first to arrive at a station. The S wave or shear wave has a slower propagation speed and arrives behind the P wave.
- 5. As seen in Figure 1 the seismogram from a representative earthquake clearly differs from that of the nuclear test. Discriminants that are refined based on P and S waves were strongly indicative of an explosion, not an earthquake or other seismic source, at all frequencies tested (0.5 to 8 hertz). Seismologists explain that the differences in seismic P- and S-wave energy provide one method of discriminating explosions from earthquakes. Seismic P waves are compressional waves, similar to sound waves in the air. Shear (S) waves are transverse waves, like those that propagate along a rope when one end is shaken. Because underground explosions are spherically symmetric disturbances, they radiate seismic P waves efficiently. In contrast, earthquakes result from sliding or rupture along a buried fault surface and strongly excite the transverse motions of S waves. Thus, we expect that explosions will show strong P waves and weak S waves and that earthquake will show weak P waves and strong S waves, as seen in Figure above. According to Seismologists, one way to quantify this difference is by determining the ratio of P-wave to S-wave energy measured from the seismograms. Explosions should have higher P/S ratios than earthquakes, but the frequency at which the best separation occurs varies by region and station. Figure 3 shows the P/S ratio for a nuclear test and for earthquakes shown in Figure 1. The measurements in Figure 3 were made at four different frequencies. The nuclear test has a higher P/S ratio than the earthquakes, as expected.