SlideShare una empresa de Scribd logo
1 de 7
Descargar para leer sin conexión
 

                   Foreca
                        asting	sa
                                ales	and
                                       d	foreca
                                              asting	u
                                                     uncerta
                                                           ainty	
 
Introdu
      uction	
There aree a large numbber of methods used for fo
                                                orecasting ran
                                                             nging from juudgmental (ex  xpert forecasting 
etc.) thru expert system
                       ms and time s
                                   series to caus
                                                sal methods (             nalysis etc.)1.  
                                                             (regression an
Most are used to give single point fforecast or at most single p
                                                               point forecasts for a limite
                                                                                          ed number of f 
scenarios.  We will in the following take a look at
                                                  t the unusefuulness of such
                                                                            h single point forecasts. 
As exampple we will usee a simple for
                                    recast ‘model
                                                l’ for net sales             multinational company. It turns 
                                                               s for a large m
out that there is a good linear relati
                                     ion between the company   y’s yearly net sales in millio
                                                                                            on euro and 
growth raates (%) in wo
                      orld GDP: 


with a corrrelation coef
                       fficient R= 0.9
                                     995. The relat
                                                  tion thus accoounts for alm
                                                                            most 99% of th
                                                                                         he variation in
                                                                                                       n the 
sales data
         a. The observe ed data is given as green d
                                                  dots in the gra
                                                                aph below, and the regresssion as the g
                                                                                                      green 
line. The ‘
          ‘model’ explaains expected sales as consstant equal 16638M and with 53M in inc creased or 
decreased d sales per pe
                       ercent increas se or decrease in world GDDP:  


The Intern
         national Mon netary Fund (IMF) that kinddly provided tthe historical GDP growth rates also giv
                                                                                                      ves 
forecasts for expected future chang ge in World G 2 ‐ for the  next five yea
                                                GDP                         ars. When we  put these 
forecasts into the ‘moddel’ we ends up with foreccasts for net s
                                                               sales for 2012
                                                                            2 to 2016 as d
                                                                                         depicted by th
                                                                                                      he 
yellow do
        ots in the grap
                      ph above.    
                                                            
1
   Gardner, D & Tetlock, P
                         P., (2011), Over
                                        rcoming Our Aversion to Ackknowledging Our Ignorance, h
                                                                                              http://www.caato‐
unbound.o org/2011/07/11/dan‐gardner    r‐and‐philip‐tetlock/overcom
                                                                   ming‐our‐aversion‐to‐acknow
                                                                                             wledging‐our‐
ignorance/ / 
2
   World Economic Outloo ok Database, AApril 2012 Edition; 
http://www w.imf.org/exteernal/pubs/ft/wweo/2012/01/  /weodata/indeex.aspx 

                                                               Page 1 of 7 
                                                               P


                                 So m
                                    mission accom
                                                mplished!  …  O
                                                              Or is it really?
                                                                             ? 
We know that the prob bability for ge
                                    etting a singlee‐point foreca
                                                                ast right is zero‐ even whe
                                                                                          en assuming tthat 
         ast of the GDP growth rate
the foreca                          e is correct ‐ s
                                                   so the forecas
                                                                sts we so far have will cert
                                                                                           tainly be wro
                                                                                                       ong, 
but how wwrong?   
        So
         ome even persist in using forecasts that are manifesstly unreliable
                                                                           e, an attitudee encounteredd by 
        th
         he future Nob
                     bel laureate K
                                  Kenneth Arrow w when he w was a young st               ring the Second 
                                                                           tatistician dur
        World War. W
        W           When Arrow di  iscovered tha
                                               at month‐long g weather for recasts used bby the army wwere 
        worthless, he w
        w             warned his suuperiors again
                                                nst using them
                                                             m. He was rebuffed. "The Commanding      g 
        General is well aware the fo
                                   orecasts are n
                                                no good," he  was told. "Hoowever, he ne  eeds them fo
                                                                                                     or 
        planning purpooses." (Gardn
                                  ner & Tetlock,, 2011) 
Maybe we
       e should take
                   e a closer look
                                 k at possible f
                                               forecast error
                                                            rs, input data
                                                                         a and the final forecast. 
The	pre
      ediction	ba
                and	
Given the
        e regression wwe can calcula               t band for fut ure observations of sales g
                                      ate a forecast                                         given forecas
                                                                                                         sts of 
the future
         e GDP growth  h rate. That is the region w
                                                  where we with  h a certain pr
                                                                              robability will expect new 
values of net sales to fall. In the gra
                                      aph below thee green area ggive the 95% forecast band:   


Since the variance of the predictionns increases th
                                                  he further ne
                                                              ew forecasts ffor the GDP ggrowth rate lie
                                                                                                       es 
from the mean of the s  sample values (used to compute the re egression), the
                                                                            e band will wwiden as we m
                                                                                                     move 
to either s
          side of this m
                       mean. The bannd will also wi
                                                  iden with dec
                                                              creasing correelation (R) an
                                                                                         nd sample sizee (the 
number o of observation ns the regress
                                     sion is based on).  
So even iff the fit to the
                         e data is good
                                      d, our regress
                                                   sion is based o
                                                                 on a very sma  all sample givving plenty of
                                                                                                           f 
room for prediction errors. In fact a a 95% confideence interval f
                                                                 for 2012, with an expected GDP growth 
rate of 3.5
          5%, is net salees 1824M plu us/minus 82MM. Even so the e interval is st
                                                                                till only appro
                                                                                              ox. 9% of the 
expected value. 
Now we hhave shown thhat the mode                                          confidence interval(s) and 
                                  el gives good forecasts, callculated the c
shown tha
        at the expect
                    ted relative er
                                  rror(s) with high probabilitty will be sma
                                                                           all!  
                          So finally th                        d!  …  Or is it really? 
                                      he mission is accomplished
The forecasts we have made is base
                                 ed on forecas
                                             sts of future w
                                                           world GDP gro           but how certain 
                                                                       owth rates, b
are they? 


                                                  Page 2 of 7 
                                                  P


The	GD
     DP	forecast
               ts	
Forecastin
         ng the future growth in GD  DP for any country is at be
                                                               est difficult an
                                                                              nd much more e so for the G
                                                                                                        GDP 
growth foor the entire w
                       world. The IMMF has therefoore supplied tthe baseline fforecasts with a fan chart3 
picturing the uncertainnty in their es
                                     stimates.   
This fan chart4 shows a
                      as blue colore
                                   ed bands the uncertainty a
                                                            around the W
                                                                       WEO baseline forecast with
                                                                                                h 50, 
70, and 900 percent con            rvals5.  
                      nfidence inter


There is also another b
                      band on the cchart, implied but un‐seen,
                                                             , indicating a 10% chance of something  g 
“unpredicctable”. The fan chart thus
                                   s covers only 9
                                                 90% of the IM
                                                             MF's estimatees of the futur
                                                                                        re probable 
growth raates.  
The table below shows  s the actual fi
                                     igures for the
                                                  e forecasted G
                                                               GDP growth (%
                                                                           %) and the lim
                                                                                        mits of the 
confidenc
        ce intervals: 
                                                               Lower           Baseline          Uppe
                                                                                                    er 
                                                         90% 70%  50%
                                                           %        %                     50%  70% 90% 
                                                                                                 % 
                                            2012  2.5
                                                    5           2.9     3.1
                                                                          1      3.5      3.8     4.0     4.3 
                                            2013  2.1
                                                    1           2.8     3.3
                                                                          3      4.1      4.8     5.2     5.9 
 
The IMF h            wing comments to the figures: 
        has the follow


3
   The Inflat
            tion Report Proojections: Understanding the e Fan Chart By  Erik Britton, Paaul Fisher and John Whitley,
Quarterly B Bulletin, Febru
                          uary 1998, pagees 30‐37. 
  
 The MPC's  s Fan Chart Inflation Report, May 2002, pag ges 48‐49.  
 
Assessing t the MPC's Fan Charts By Rob b Elder, George               Tim Taylor and Tony Yates, Q
                                                        e Kapetanios, T                              Quarterly Bullet
                                                                                                                    tin, 
Autumn 20   005, pages 3266‐48 
 
4
   Figure 1.1
            12. from:, Worrld Economic OOutlook (April 22012), Internat
                                                                      tional Monetar   ry Fund, Isbn  9
                                                                                                      978161635246  62. 
5
   As shown n, the 70 perce
                          ent confidence interval includdes the 50 perc
                                                                      cent interval, a and the 90 perccent confidencce 
interval inccludes the 50 a
                          and 70 percent t intervals. See
                                                        e Appendix 1.2  in the April 20009 World Economic Outlook   k for 
details. 

                                                                         Page 3 of 7 
                                                                         P


         Risks around the WEO pro
        “R                          ojections havee diminished,  consistent w with market in
                                                                                           ndicators, butt they 
        re
         emain large and tilted to the downside.   . The various  indicators do
                                                                              o not point in a consistent 
        direction. Infla
                       ation and oil p
                                     price indicato
                                                  ors suggest doownside risks to growth. The term spread 
         nd S&P 500 o
        an             options pricess, however, pooint to upside
                                                                e risks.” 
Our appro
        oximation of t
                     the distribution that can h                        art for 2012 as given in the
                                               have produce d the fan cha                          e 
World Eco
        onomic Outloook for April 2
                                  2012 is shownn below: 


This distribution has:  mmean 3.43%, standard dev   viation 0.54, m
                                                                  minimum 1.2 22 and maximmum 4.70 – it is 
skewed w with a left tail.
                         . The distribut
                                       tion thus also
                                                    o encompasse  es the implied
                                                                               d but un‐seen
                                                                                           n band in the 
chart. 
                                 Now
                                   w we are read
                                               dy for serious  forecasting!
The	final	sales	forecasts	
By employying the samee technic that
                                   t we used to calculate the  forecast bannd we can by Monte Carlo 
simulation
         n compute thhe 2012 distribution of nett sales forecas            e distribution of GDP grow
                                                              sts, given the                        wth 
rates and by using the expected varriance for the
                                                e differences b
                                                              between fore ecasts using the regression
                                                                                                     n and 
new obseervations. The
                     e figure below
                                  w describes thhe forecast prrocess:   


                                                 Page 4 of 7 
                                                 P


We however are not only using the 90% interval for The GDP  growth rate or the 95% fo       orecast band,, but 
the full range of the distributions.  T
                                      The final fore
                                                   ecasts of net s
                                                                 sales are given as a histogr
                                                                                            ram in the gra
                                                                                                         aph 
below: 


This distribution of forecasted net s
                                    sales has:  me            0M, standard
                                                 ean sales 1820             d deviation 81
                                                                                         1, minimum s
                                                                                                    sales 
1590M an  nd maximum sales 2055M – and it is slightly skewed d with a left ta
                                                                            ail. 
So what a
        added informa
                    ation have we got from th
                                            he added effo
                                                        ort?  
Well, we nnow know that there is on nly a 20% probability for ne
                                                               et sales to be
                                                                            e lower than 1
                                                                                         1755 or above e 
1890. The e interval from
                        m 1755M to 11890M in net sales will theen with 60% pprobability co
                                                                                         ontain the act
                                                                                                      tual 
sales in 20
          012 ‐ se graphh below giving the cumula
                                                ative sales dis tribution: 


        know that we with 90% pro
We also k                          obability will see actual ne
                                                              et sales in 20112 between 1 1720M and 
1955M.Buut most impoortant is that w
                                   we have visua alized the unccertainty in th
                                                                             he sales forec
                                                                                          casts and that 
contingen
        ncy planning f
                     for both low aand high sales should be p performed.  


                                                 Page 5 of 7 
                                                 P


An	unce
      ertain	pas
               st	
The Bank of England’s fan chart from 2008 show wed a wide ra nge of possibble futures, bu
                                                                                        ut it also show
                                                                                                      wed 
the uncerrtainty about where we we ere then ‐ see
                                                e that the blac
                                                              ck line showing National SStatistics data
                                                                                                      a for 
the past h
         has probabilit
                      ty bands arou
                                  und it: 


          ates that the values for pa
This indica                         ast GDP growt th rates are u
                                                               uncertain (sto
                                                                            ochastic) or co
                                                                                          ontains 
measurem ment errors. TThis of course
                                    e also holds fo
                                                  or the IMF his
                                                               storic growthh rates, but th
                                                                                          hey are not 
supplying this type of i
                       information. 
          wth rates can
If the grow            n be considereed stochastic the results a bove will still l hold, if the c
                                                                                                conditional 
distributio
          on for net sales given the G
                                     GDP growth r rate still fulfil ls the standard assumptio  ons for using 
regressionn methods. Iff not other meethods of estimation must     t be consider 	
                                                                                red.
Black	Swans	
                       y was still not enough to co
But all this uncertainty                          ontain what w
                                                              was to becom
                                                                         me reality – sh
                                                                                       hown by the r
                                                                                                   red 
line in the
          e graph abovee.  
How wron
       ng can we be? Often more
                              e wrong than we like to thiink. This is go
                                                                       ood ‐ as in use
                                                                                     eful ‐ to know
                                                                                                  w.  
        `“
         “As Donald Ru
                     umsfeld once
                                e said: it's not only what w e don't know
                                                                        w ‐ the known unknowns ‐ it's 
        what we don't
        w            t know we don't know.” 
While stattistic methodds may lead us to a reasonably understa  anding of som me phenomen   non that doess not 
always tra
         anslate into aan accurate prractical prediction capabil ity. When thaat is the case,
                                                                                            , we find ours
                                                                                                         selves 
talking ab
         bout risk, the likelihood tha
                                     at some unfav vorable or favvorable event will take plaace. Risk 
assessment is then nec cessitated and we are left only with pro obabilities. 


                                                   Page 6 of 7 
                                                   P


A	final	w
        word	

Sales for
        recast models are an integrated part of our enterp
                                             o            prise simulat
                                                                      tion models - as parts of the
                                                                                              f
models predictive an
        p           nalytics. Pred
                                 dictive analy
                                             ytics can be d
                                                          described as statistic mo
                                                                                  odeling enablling
the prediction of futu events or results6, usi present a past info
                     ure         r            ing         and         ormation and data.
                                                                                  d

In today’ fast movin and highly uncertain markets, for
        ’s         ng            y         m         recasting hav become th single mo
                                                                 ve          he          ost
importan element of the manage
        nt          f           ement proces The abilit to quickly and accura
                                           ss.         ty        y          ately detect
changes in key extern and inter variable and adjust tactics acco
         i          nal         rnal      es         t           ordingly can make all the
                                                                                         e
differenc between su
        ce           uccess and failure:
                                f

       1. Forecasts must integrate both externa and interna drivers of business an the financ
                                     b          al            al          f          nd         cial
          re
           esults.
       2. Absolute fore
          A            ecast accurac (i.e. small confidence intervals) is less import than the
                                    cy           l           e             s          tant      e
          in
           nsight about how current decisions and likely fut
                                     t          a             ture events w interact to form the
                                                                          will
          re
           esult
       3. Detail does not equal accu
          D                          uracy with respect to for
                                                r             recasts
       4. The forecast is often less important th the assum
          T             i                       han           mptions and variables th underpin it –
                                                                         d           hat
          th
           hose are the things that should be tra
                                    s           aced to provi advance warning.
                                                             ide
       5. Never relay on single poi or scenari forecastin
          N            o            int          io          ng

The foreccasts are usuually done in three stages first by for
                                   n           s,            recasting the market for that particu
                                                                         e            r          ular
product(s then the firm’s marke share(s) en
         s),          f            et          nding up wit a sales for
                                                            th           recast. If the firm has
                                                                                      e
activities in different geographic markets the the exerci se has to be repeated in each market
         s            t                       en                                                  t,
having in mind the co
         n             orrelation be
                                   etween markkets:

       1. All uncertaint about the different ma
          A              ty                      arket sizes, m
                                                              market share and their c
                                                                         es           correlation wwill
          fi
           inally end up contributin to the unc
                        p          ng           certainty in th forecast f the firm’s total sales.
                                                              he         for
       2. This uncertain combine with the uncertainty fr
          T              nty       ed           u            from other fo
                                                                         orecasted varriables like
          in
           nterest rates, exchange ra
                                    ates, taxes et will even
                                                 tc.         ntually be ma
                                                                         anifested in t probability
                                                                                      the
          distribution fo the firm’s equity valu
                        or          s           ue.

The ‘mod we have been using in the exam have nev been test out of sa
        del’        e                    mple         ver ted      ample. Its
usefulnes as a foreca model is therefore sti debatable
        ss          ast                    ill       e.

Referen
      nces	

Gardner, D & Tetlock, P., (2011) Overcomin Our Aver
                               ),          ng         rsion to Ack
                                                                 knowledging Our Ignora
                                                                             g          ance,
http://ww
        ww.cato-unbound.org/20011/07/11/daan-gardner-a
                                                     and-philip-tet
                                                                  tlock/overco
                                                                             oming-our-
aversion-
        -to-acknowle
                   edging-our-iignorance/

World Ecconomic Ouutlook Databa April 20 Edition;
                               ase,       012
http://ww
        ww.imf.org/e
                   external/pubs/ft/weo/201
                                          12/01/weoda
                                                    ata/index.asp
                                                                px

                                                            
6
     In this cas
               se the probabi
                            ility distribution of future net
                                                           t sales. 

                                                               Page 7 of 7 
                                                               P
 

Más contenido relacionado

Similar a Forecasting advantages with simulation models

3 ways to save
3 ways to save3 ways to save
3 ways to save
Greg Eicke
 
Mso excel 2003 tips & tricks
Mso excel 2003   tips & tricksMso excel 2003   tips & tricks
Mso excel 2003 tips & tricks
Skender Beu
 
Expeditors International of Washington, 4th97qer
Expeditors International of Washington, 4th97qerExpeditors International of Washington, 4th97qer
Expeditors International of Washington, 4th97qer
finance39
 
IIPabaARRAAKCFHIIC.docx
IIPabaARRAAKCFHIIC.docxIIPabaARRAAKCFHIIC.docx
IIPabaARRAAKCFHIIC.docx
sheronlewthwaite
 
Iaas for a demanding business
Iaas for a demanding businessIaas for a demanding business
Iaas for a demanding business
Novell
 
Cloudcomputing- Chris Francis- Digibiz'09
Cloudcomputing- Chris Francis- Digibiz'09Cloudcomputing- Chris Francis- Digibiz'09
Cloudcomputing- Chris Francis- Digibiz'09
Digibiz'09 Conference
 
SEVS scenario presentation
SEVS scenario presentationSEVS scenario presentation
SEVS scenario presentation
futuramb
 
Jeff Gardner; Smarter Apps for Smarter Phones
Jeff Gardner; Smarter Apps for Smarter PhonesJeff Gardner; Smarter Apps for Smarter Phones
Jeff Gardner; Smarter Apps for Smarter Phones
Droidcon Berlin
 

Similar a Forecasting advantages with simulation models (20)

St-Ericsson Analyst presentation, NovaThor smartphone platform family, MWC 2011
St-Ericsson Analyst presentation, NovaThor smartphone platform family, MWC 2011St-Ericsson Analyst presentation, NovaThor smartphone platform family, MWC 2011
St-Ericsson Analyst presentation, NovaThor smartphone platform family, MWC 2011
 
3 ways to save
3 ways to save3 ways to save
3 ways to save
 
Phone Systems Brisbane - 16 questions a 27 year telco veteran would ask befor...
Phone Systems Brisbane - 16 questions a 27 year telco veteran would ask befor...Phone Systems Brisbane - 16 questions a 27 year telco veteran would ask befor...
Phone Systems Brisbane - 16 questions a 27 year telco veteran would ask befor...
 
Mso excel 2003 tips & tricks
Mso excel 2003   tips & tricksMso excel 2003   tips & tricks
Mso excel 2003 tips & tricks
 
Expeditors International of Washington, 4th97qer
Expeditors International of Washington, 4th97qerExpeditors International of Washington, 4th97qer
Expeditors International of Washington, 4th97qer
 
IIPabaARRAAKCFHIIC.docx
IIPabaARRAAKCFHIIC.docxIIPabaARRAAKCFHIIC.docx
IIPabaARRAAKCFHIIC.docx
 
Nitaqat system
Nitaqat systemNitaqat system
Nitaqat system
 
Iaas for a demanding business
Iaas for a demanding businessIaas for a demanding business
Iaas for a demanding business
 
Safe To Play Whitepaper
Safe To  Play WhitepaperSafe To  Play Whitepaper
Safe To Play Whitepaper
 
Cloudcomputing- Chris Francis- Digibiz'09
Cloudcomputing- Chris Francis- Digibiz'09Cloudcomputing- Chris Francis- Digibiz'09
Cloudcomputing- Chris Francis- Digibiz'09
 
Evaluating impact, maximising Value for Money (VfM) and being transparent
Evaluating impact, maximising Value for Money (VfM) and being transparentEvaluating impact, maximising Value for Money (VfM) and being transparent
Evaluating impact, maximising Value for Money (VfM) and being transparent
 
Social Media Marketing is Dead. The Way Brands use it Today
Social Media Marketing is Dead. The Way Brands use it TodaySocial Media Marketing is Dead. The Way Brands use it Today
Social Media Marketing is Dead. The Way Brands use it Today
 
Mẫu CV tiếng Anh chuyên nghiệp và đẹp nhất 7
Mẫu CV tiếng Anh chuyên nghiệp và đẹp nhất 7Mẫu CV tiếng Anh chuyên nghiệp và đẹp nhất 7
Mẫu CV tiếng Anh chuyên nghiệp và đẹp nhất 7
 
SEVS scenario presentation
SEVS scenario presentationSEVS scenario presentation
SEVS scenario presentation
 
Ubisoft Reports Third Quarter 2010-11 Sales
Ubisoft Reports Third Quarter 2010-11 SalesUbisoft Reports Third Quarter 2010-11 Sales
Ubisoft Reports Third Quarter 2010-11 Sales
 
Green Economy Initiative
Green Economy InitiativeGreen Economy Initiative
Green Economy Initiative
 
Jeff Gardner; Smarter Apps for Smarter Phones
Jeff Gardner; Smarter Apps for Smarter PhonesJeff Gardner; Smarter Apps for Smarter Phones
Jeff Gardner; Smarter Apps for Smarter Phones
 
Logistic management
Logistic managementLogistic management
Logistic management
 
Pacenet cta judith francis
Pacenet cta judith francisPacenet cta judith francis
Pacenet cta judith francis
 
מבט לכלכלה העולמית – התאוששות לא אחידה
מבט לכלכלה העולמית – התאוששות לא אחידהמבט לכלכלה העולמית – התאוששות לא אחידה
מבט לכלכלה העולמית – התאוששות לא אחידה
 

Más de Weibull AS

Más de Weibull AS (12)

The role of events in simulation modeling
The role of events in simulation modelingThe role of events in simulation modeling
The role of events in simulation modeling
 
What we do; predictive and prescriptive analytics
What we do; predictive and prescriptive analyticsWhat we do; predictive and prescriptive analytics
What we do; predictive and prescriptive analytics
 
Performing Strategic Risk Management with simulation models
Performing Strategic Risk Management with simulation modelsPerforming Strategic Risk Management with simulation models
Performing Strategic Risk Management with simulation models
 
The Case of Enterprise Risk Management
The Case of Enterprise Risk ManagementThe Case of Enterprise Risk Management
The Case of Enterprise Risk Management
 
Improving Public works projects
Improving Public works projectsImproving Public works projects
Improving Public works projects
 
M&A analytics: When two plus two is five or three or .
M&A analytics: When two plus two is five or three or .M&A analytics: When two plus two is five or three or .
M&A analytics: When two plus two is five or three or .
 
Production strategy and analytics
Production strategy and analyticsProduction strategy and analytics
Production strategy and analytics
 
Budgeting with Monte Carlo simulation models
Budgeting with Monte Carlo simulation modelsBudgeting with Monte Carlo simulation models
Budgeting with Monte Carlo simulation models
 
Working capital Strategies
Working capital StrategiesWorking capital Strategies
Working capital Strategies
 
Plans based on average assumptions ..
Plans based on average assumptions ..Plans based on average assumptions ..
Plans based on average assumptions ..
 
S@R Examples Application Areas
S@R Examples Application AreasS@R Examples Application Areas
S@R Examples Application Areas
 
Solutions From S@R Jan12
Solutions From S@R Jan12Solutions From S@R Jan12
Solutions From S@R Jan12
 

Último

Quick Doctor In Kuwait +2773`7758`557 Kuwait Doha Qatar Dubai Abu Dhabi Sharj...
Quick Doctor In Kuwait +2773`7758`557 Kuwait Doha Qatar Dubai Abu Dhabi Sharj...Quick Doctor In Kuwait +2773`7758`557 Kuwait Doha Qatar Dubai Abu Dhabi Sharj...
Quick Doctor In Kuwait +2773`7758`557 Kuwait Doha Qatar Dubai Abu Dhabi Sharj...
daisycvs
 
Jual Obat Aborsi ( Asli No.1 ) 085657271886 Obat Penggugur Kandungan Cytotec
Jual Obat Aborsi ( Asli No.1 ) 085657271886 Obat Penggugur Kandungan CytotecJual Obat Aborsi ( Asli No.1 ) 085657271886 Obat Penggugur Kandungan Cytotec
Jual Obat Aborsi ( Asli No.1 ) 085657271886 Obat Penggugur Kandungan Cytotec
ZurliaSoop
 

Último (20)

Rice Manufacturers in India | Shree Krishna Exports
Rice Manufacturers in India | Shree Krishna ExportsRice Manufacturers in India | Shree Krishna Exports
Rice Manufacturers in India | Shree Krishna Exports
 
New 2024 Cannabis Edibles Investor Pitch Deck Template
New 2024 Cannabis Edibles Investor Pitch Deck TemplateNew 2024 Cannabis Edibles Investor Pitch Deck Template
New 2024 Cannabis Edibles Investor Pitch Deck Template
 
Falcon Invoice Discounting: Aviate Your Cash Flow Challenges
Falcon Invoice Discounting: Aviate Your Cash Flow ChallengesFalcon Invoice Discounting: Aviate Your Cash Flow Challenges
Falcon Invoice Discounting: Aviate Your Cash Flow Challenges
 
Falcon Invoice Discounting: Tailored Financial Wings
Falcon Invoice Discounting: Tailored Financial WingsFalcon Invoice Discounting: Tailored Financial Wings
Falcon Invoice Discounting: Tailored Financial Wings
 
Quick Doctor In Kuwait +2773`7758`557 Kuwait Doha Qatar Dubai Abu Dhabi Sharj...
Quick Doctor In Kuwait +2773`7758`557 Kuwait Doha Qatar Dubai Abu Dhabi Sharj...Quick Doctor In Kuwait +2773`7758`557 Kuwait Doha Qatar Dubai Abu Dhabi Sharj...
Quick Doctor In Kuwait +2773`7758`557 Kuwait Doha Qatar Dubai Abu Dhabi Sharj...
 
Buy gmail accounts.pdf buy Old Gmail Accounts
Buy gmail accounts.pdf buy Old Gmail AccountsBuy gmail accounts.pdf buy Old Gmail Accounts
Buy gmail accounts.pdf buy Old Gmail Accounts
 
Pre Engineered Building Manufacturers Hyderabad.pptx
Pre Engineered  Building Manufacturers Hyderabad.pptxPre Engineered  Building Manufacturers Hyderabad.pptx
Pre Engineered Building Manufacturers Hyderabad.pptx
 
Falcon Invoice Discounting: Empowering Your Business Growth
Falcon Invoice Discounting: Empowering Your Business GrowthFalcon Invoice Discounting: Empowering Your Business Growth
Falcon Invoice Discounting: Empowering Your Business Growth
 
Famous Olympic Siblings from the 21st Century
Famous Olympic Siblings from the 21st CenturyFamous Olympic Siblings from the 21st Century
Famous Olympic Siblings from the 21st Century
 
Unveiling Falcon Invoice Discounting: Leading the Way as India's Premier Bill...
Unveiling Falcon Invoice Discounting: Leading the Way as India's Premier Bill...Unveiling Falcon Invoice Discounting: Leading the Way as India's Premier Bill...
Unveiling Falcon Invoice Discounting: Leading the Way as India's Premier Bill...
 
Cracking the 'Career Pathing' Slideshare
Cracking the 'Career Pathing' SlideshareCracking the 'Career Pathing' Slideshare
Cracking the 'Career Pathing' Slideshare
 
Falcon Invoice Discounting: Unlock Your Business Potential
Falcon Invoice Discounting: Unlock Your Business PotentialFalcon Invoice Discounting: Unlock Your Business Potential
Falcon Invoice Discounting: Unlock Your Business Potential
 
Falcon Invoice Discounting: The best investment platform in india for investors
Falcon Invoice Discounting: The best investment platform in india for investorsFalcon Invoice Discounting: The best investment platform in india for investors
Falcon Invoice Discounting: The best investment platform in india for investors
 
Buy Verified TransferWise Accounts From Seosmmearth
Buy Verified TransferWise Accounts From SeosmmearthBuy Verified TransferWise Accounts From Seosmmearth
Buy Verified TransferWise Accounts From Seosmmearth
 
Jual Obat Aborsi ( Asli No.1 ) 085657271886 Obat Penggugur Kandungan Cytotec
Jual Obat Aborsi ( Asli No.1 ) 085657271886 Obat Penggugur Kandungan CytotecJual Obat Aborsi ( Asli No.1 ) 085657271886 Obat Penggugur Kandungan Cytotec
Jual Obat Aborsi ( Asli No.1 ) 085657271886 Obat Penggugur Kandungan Cytotec
 
Putting the SPARK into Virtual Training.pptx
Putting the SPARK into Virtual Training.pptxPutting the SPARK into Virtual Training.pptx
Putting the SPARK into Virtual Training.pptx
 
Organizational Transformation Lead with Culture
Organizational Transformation Lead with CultureOrganizational Transformation Lead with Culture
Organizational Transformation Lead with Culture
 
SEO Case Study: How I Increased SEO Traffic & Ranking by 50-60% in 6 Months
SEO Case Study: How I Increased SEO Traffic & Ranking by 50-60%  in 6 MonthsSEO Case Study: How I Increased SEO Traffic & Ranking by 50-60%  in 6 Months
SEO Case Study: How I Increased SEO Traffic & Ranking by 50-60% in 6 Months
 
Dr. Admir Softic_ presentation_Green Club_ENG.pdf
Dr. Admir Softic_ presentation_Green Club_ENG.pdfDr. Admir Softic_ presentation_Green Club_ENG.pdf
Dr. Admir Softic_ presentation_Green Club_ENG.pdf
 
How to Get Started in Social Media for Art League City
How to Get Started in Social Media for Art League CityHow to Get Started in Social Media for Art League City
How to Get Started in Social Media for Art League City
 

Forecasting advantages with simulation models

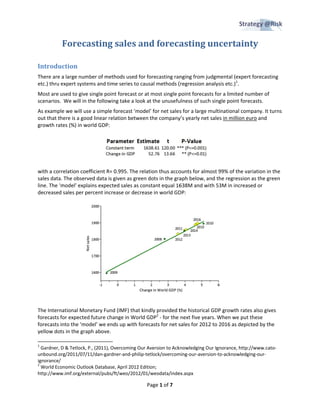
  • 1.   Foreca asting sa ales and d foreca asting u uncerta ainty   Introdu uction There aree a large numbber of methods used for fo orecasting ran nging from juudgmental (ex xpert forecasting  etc.) thru expert system ms and time s series to caus sal methods ( nalysis etc.)1.   (regression an Most are used to give single point fforecast or at most single p point forecasts for a limite ed number of f  scenarios.  We will in the following take a look at t the unusefuulness of such h single point forecasts.  As exampple we will usee a simple for recast ‘model l’ for net sales multinational company. It turns  s for a large m out that there is a good linear relati ion between the company y’s yearly net sales in millio on euro and  growth raates (%) in wo orld GDP:    with a corrrelation coef fficient R= 0.9 995. The relat tion thus accoounts for alm most 99% of th he variation in n the  sales data a. The observe ed data is given as green d dots in the gra aph below, and the regresssion as the g green  line. The ‘ ‘model’ explaains expected sales as consstant equal 16638M and with 53M in inc creased or  decreased d sales per pe ercent increas se or decrease in world GDDP:     The Intern national Mon netary Fund (IMF) that kinddly provided tthe historical GDP growth rates also giv ves  forecasts for expected future chang ge in World G 2 ‐ for the  next five yea GDP ars. When we  put these  forecasts into the ‘moddel’ we ends up with foreccasts for net s sales for 2012 2 to 2016 as d depicted by th he  yellow do ots in the grap ph above.                                                                  1  Gardner, D & Tetlock, P P., (2011), Over rcoming Our Aversion to Ackknowledging Our Ignorance, h http://www.caato‐ unbound.o org/2011/07/11/dan‐gardner r‐and‐philip‐tetlock/overcom ming‐our‐aversion‐to‐acknow wledging‐our‐ ignorance/ /  2  World Economic Outloo ok Database, AApril 2012 Edition;  http://www w.imf.org/exteernal/pubs/ft/wweo/2012/01/ /weodata/indeex.aspx  Page 1 of 7  P  
  • 2.   So m mission accom mplished!  …  O Or is it really? ?  We know that the prob bability for ge etting a singlee‐point foreca ast right is zero‐ even whe en assuming tthat  ast of the GDP growth rate the foreca e is correct ‐ s so the forecas sts we so far have will cert tainly be wro ong,  but how wwrong?    So ome even persist in using forecasts that are manifesstly unreliable e, an attitudee encounteredd by  th he future Nob bel laureate K Kenneth Arrow w when he w was a young st ring the Second  tatistician dur World War. W W When Arrow di iscovered tha at month‐long g weather for recasts used bby the army wwere  worthless, he w w warned his suuperiors again nst using them m. He was rebuffed. "The Commanding g  General is well aware the fo orecasts are n no good," he  was told. "Hoowever, he ne eeds them fo or  planning purpooses." (Gardn ner & Tetlock,, 2011)  Maybe we e should take e a closer look k at possible f forecast error rs, input data a and the final forecast.  The pre ediction ba and Given the e regression wwe can calcula t band for fut ure observations of sales g ate a forecast given forecas sts of  the future e GDP growth h rate. That is the region w where we with h a certain pr robability will expect new  values of net sales to fall. In the gra aph below thee green area ggive the 95% forecast band:    Since the variance of the predictionns increases th he further ne ew forecasts ffor the GDP ggrowth rate lie es  from the mean of the s sample values (used to compute the re egression), the e band will wwiden as we m move  to either s side of this m mean. The bannd will also wi iden with dec creasing correelation (R) an nd sample sizee (the  number o of observation ns the regress sion is based on).   So even iff the fit to the e data is good d, our regress sion is based o on a very sma all sample givving plenty of f  room for prediction errors. In fact a a 95% confideence interval f for 2012, with an expected GDP growth  rate of 3.5 5%, is net salees 1824M plu us/minus 82MM. Even so the e interval is st till only appro ox. 9% of the  expected value.  Now we hhave shown thhat the mode confidence interval(s) and  el gives good forecasts, callculated the c shown tha at the expect ted relative er rror(s) with high probabilitty will be sma all!   So finally th d!  …  Or is it really?  he mission is accomplished The forecasts we have made is base ed on forecas sts of future w world GDP gro but how certain  owth rates, b are they?  Page 2 of 7  P  
  • 3.   The GD DP forecast ts Forecastin ng the future growth in GD DP for any country is at be est difficult an nd much more e so for the G GDP  growth foor the entire w world. The IMMF has therefoore supplied tthe baseline fforecasts with a fan chart3  picturing the uncertainnty in their es stimates.    This fan chart4 shows a as blue colore ed bands the uncertainty a around the W WEO baseline forecast with h 50,  70, and 900 percent con rvals5.   nfidence inter   There is also another b band on the cchart, implied but un‐seen, , indicating a 10% chance of something g  “unpredicctable”. The fan chart thus s covers only 9 90% of the IM MF's estimatees of the futur re probable  growth raates.   The table below shows s the actual fi igures for the e forecasted G GDP growth (% %) and the lim mits of the  confidenc ce intervals:  Lower  Baseline Uppe er  90% 70%  50% %  %  50%  70% 90%  %  2012  2.5 5  2.9  3.1 1  3.5  3.8  4.0 4.3  2013  2.1 1  2.8  3.3 3  4.1  4.8  5.2 5.9    The IMF h wing comments to the figures:  has the follow                                                              3  The Inflat tion Report Proojections: Understanding the e Fan Chart By  Erik Britton, Paaul Fisher and John Whitley, Quarterly B Bulletin, Febru uary 1998, pagees 30‐37.      The MPC's s Fan Chart Inflation Report, May 2002, pag ges 48‐49.     Assessing t the MPC's Fan Charts By Rob b Elder, George Tim Taylor and Tony Yates, Q e Kapetanios, T Quarterly Bullet tin,  Autumn 20 005, pages 3266‐48    4  Figure 1.1 12. from:, Worrld Economic OOutlook (April 22012), Internat tional Monetar ry Fund, Isbn  9 978161635246 62.  5  As shown n, the 70 perce ent confidence interval includdes the 50 perc cent interval, a and the 90 perccent confidencce  interval inccludes the 50 a and 70 percent t intervals. See e Appendix 1.2  in the April 20009 World Economic Outlook k for  details.  Page 3 of 7  P  
  • 4.   Risks around the WEO pro “R ojections havee diminished,  consistent w with market in ndicators, butt they  re emain large and tilted to the downside. . The various  indicators do o not point in a consistent  direction. Infla ation and oil p price indicato ors suggest doownside risks to growth. The term spread  nd S&P 500 o an options pricess, however, pooint to upside e risks.”  Our appro oximation of t the distribution that can h art for 2012 as given in the have produce d the fan cha e  World Eco onomic Outloook for April 2 2012 is shownn below:  This distribution has:  mmean 3.43%, standard dev viation 0.54, m minimum 1.2 22 and maximmum 4.70 – it is  skewed w with a left tail. . The distribut tion thus also o encompasse es the implied d but un‐seen n band in the  chart.  Now w we are read dy for serious  forecasting! The final sales forecasts By employying the samee technic that t we used to calculate the  forecast bannd we can by Monte Carlo  simulation n compute thhe 2012 distribution of nett sales forecas e distribution of GDP grow sts, given the wth  rates and by using the expected varriance for the e differences b between fore ecasts using the regression n and  new obseervations. The e figure below w describes thhe forecast prrocess:    Page 4 of 7  P  
  • 5.     We however are not only using the 90% interval for The GDP  growth rate or the 95% fo orecast band,, but  the full range of the distributions.  T The final fore ecasts of net s sales are given as a histogr ram in the gra aph  below:  This distribution of forecasted net s sales has:  me 0M, standard ean sales 1820 d deviation 81 1, minimum s sales  1590M an nd maximum sales 2055M – and it is slightly skewed d with a left ta ail.  So what a added informa ation have we got from th he added effo ort?   Well, we nnow know that there is on nly a 20% probability for ne et sales to be e lower than 1 1755 or above e  1890. The e interval from m 1755M to 11890M in net sales will theen with 60% pprobability co ontain the act tual  sales in 20 012 ‐ se graphh below giving the cumula ative sales dis tribution:    know that we with 90% pro We also k obability will see actual ne et sales in 20112 between 1 1720M and  1955M.Buut most impoortant is that w we have visua alized the unccertainty in th he sales forec casts and that  contingen ncy planning f for both low aand high sales should be p performed.   Page 5 of 7  P  
  • 6.   An unce ertain pas st The Bank of England’s fan chart from 2008 show wed a wide ra nge of possibble futures, bu ut it also show wed  the uncerrtainty about where we we ere then ‐ see e that the blac ck line showing National SStatistics data a for  the past h has probabilit ty bands arou und it:    ates that the values for pa This indica ast GDP growt th rates are u uncertain (sto ochastic) or co ontains  measurem ment errors. TThis of course e also holds fo or the IMF his storic growthh rates, but th hey are not  supplying this type of i information.  wth rates can If the grow n be considereed stochastic the results a bove will still l hold, if the c conditional  distributio on for net sales given the G GDP growth r rate still fulfil ls the standard assumptio ons for using  regressionn methods. Iff not other meethods of estimation must t be consider red. Black Swans y was still not enough to co But all this uncertainty ontain what w was to becom me reality – sh hown by the r red  line in the e graph abovee.   How wron ng can we be? Often more e wrong than we like to thiink. This is go ood ‐ as in use eful ‐ to know w.   `“ “As Donald Ru umsfeld once e said: it's not only what w e don't know w ‐ the known unknowns ‐ it's  what we don't w t know we don't know.”  While stattistic methodds may lead us to a reasonably understa anding of som me phenomen non that doess not  always tra anslate into aan accurate prractical prediction capabil ity. When thaat is the case, , we find ours selves  talking ab bout risk, the likelihood tha at some unfav vorable or favvorable event will take plaace. Risk  assessment is then nec cessitated and we are left only with pro obabilities.  Page 6 of 7  P  
  • 7.   A final w word Sales for recast models are an integrated part of our enterp o prise simulat tion models - as parts of the f models predictive an p nalytics. Pred dictive analy ytics can be d described as statistic mo odeling enablling the prediction of futu events or results6, usi present a past info ure r ing and ormation and data. d In today’ fast movin and highly uncertain markets, for ’s ng y m recasting hav become th single mo ve he ost importan element of the manage nt f ement proces The abilit to quickly and accura ss. ty y ately detect changes in key extern and inter variable and adjust tactics acco i nal rnal es t ordingly can make all the e differenc between su ce uccess and failure: f 1. Forecasts must integrate both externa and interna drivers of business an the financ b al al f nd cial re esults. 2. Absolute fore A ecast accurac (i.e. small confidence intervals) is less import than the cy l e s tant e in nsight about how current decisions and likely fut t a ture events w interact to form the will re esult 3. Detail does not equal accu D uracy with respect to for r recasts 4. The forecast is often less important th the assum T i han mptions and variables th underpin it – d hat th hose are the things that should be tra s aced to provi advance warning. ide 5. Never relay on single poi or scenari forecastin N o int io ng The foreccasts are usuually done in three stages first by for n s, recasting the market for that particu e r ular product(s then the firm’s marke share(s) en s), f et nding up wit a sales for th recast. If the firm has e activities in different geographic markets the the exerci se has to be repeated in each market s t en t, having in mind the co n orrelation be etween markkets: 1. All uncertaint about the different ma A ty arket sizes, m market share and their c es correlation wwill fi inally end up contributin to the unc p ng certainty in th forecast f the firm’s total sales. he for 2. This uncertain combine with the uncertainty fr T nty ed u from other fo orecasted varriables like in nterest rates, exchange ra ates, taxes et will even tc. ntually be ma anifested in t probability the distribution fo the firm’s equity valu or s ue. The ‘mod we have been using in the exam have nev been test out of sa del’ e mple ver ted ample. Its usefulnes as a foreca model is therefore sti debatable ss ast ill e. Referen nces Gardner, D & Tetlock, P., (2011) Overcomin Our Aver ), ng rsion to Ack knowledging Our Ignora g ance, http://ww ww.cato-unbound.org/20011/07/11/daan-gardner-a and-philip-tet tlock/overco oming-our- aversion- -to-acknowle edging-our-iignorance/ World Ecconomic Ouutlook Databa April 20 Edition; ase, 012 http://ww ww.imf.org/e external/pubs/ft/weo/201 12/01/weoda ata/index.asp px                                                              6  In this cas se the probabi ility distribution of future net t sales.  Page 7 of 7  P