Mobile Content Market Size Slides Q1 07
•Descargar como PPT, PDF•
10 recomendaciones•1,043 vistas


Recomendados
Más contenido relacionado
Más de Prashant Singh
Más de Prashant Singh (20)
Último
Último (20)
Mobile Content Market Size Slides Q1 07
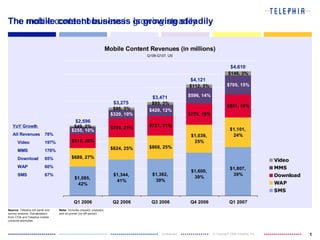
- 1. The mobile content business is growing steadily $3,471 The mobile content business is growing steadily Mobile Content Revenues (in millions) Q106-Q107, US $4,121 Note : Includes prepaid, postpaid, and on-portal (no off-portal) Source : Telephia bill panel and survey analysis. Extrapolation from CTIA and Telephia mobile universe estimates $4,610 $3,275 $2,596 YoY Growth All Revenues 78% Video 197% MMS 176% Download 65% WAP 60% SMS 67%
- 2. The number of wireless subscribers using mobile content also continues to grow Mobile Content Subscribers (in millions) Q106-Q107, US Note : Includes prepaid, postpaid, and on-portal (no off-portal) Source : Telephia bill panel and survey analysis. Extrapolation from CTIA and Telephia mobile universe estimates YoY Growth Total US Subs 10% SMS 33% WAP 32% Download 95%* MMS 115% Video 155% * Trend Break. Classification Updated 3% 24% 30% 32% 63% Q4 2006 3% 20%* 25% 29% 58% Q3 2006 2% 14% 19% 29% 57% Q2 2006 2% 13% 17% 27% 53% Q1 2006 4% 23% 33% 32% 64% Q1 2007 Video Downloads MMS WAP SMS Period Penetration of US Wireless Subscribers
- 3. Premium SMS accounts for the largest share of mobile download revenues Mobile Download Revenues (in millions) Q106-Q107, US $727 $775 Note : Includes prepaid, postpaid, and on-portal (no off-portal) Source : Telephia bill panel and survey analysis. Extrapolation from CTIA and Telephia mobile universe estimates $851 * Premium SMS newly classified in Q1 2007 $700 $517 YoY Growth All Revenues 65% PSMS NA Apps 143%** Games 25% Audio 71% ** Trend Break. Classification Updated
- 4. Downloaders have almost doubled since Q1 2006 Mobile Downloaders (in millions) Q106-Q107, US Note : Includes prepaid, postpaid, and on-portal (no off-portal). Downloaders of each content type are not mutually exclusive. Source : Telephia bill panel and survey analysis. Extrapolation from CTIA and Telephia mobile universe estimates * Premium SMS newly classified in Q1 2007 YoY Growth Total DLers 95%** Audio 43% Game 47% Apps 101%** PSMS NA ** Trend Break. Classification Updated - 4% 7% 12% Q4 2006 - 4%** 7% 12% Q3 2006 - 2% 6% 11% Q2 2006 - 2% 6% 9% Q1 2006 8% 4% 8% 12% Q1 2007 PSMS App Game Audio Period Penetration of US Wireless Subscribers