1. 11BSM4 - Tống Trần Thanh Phương
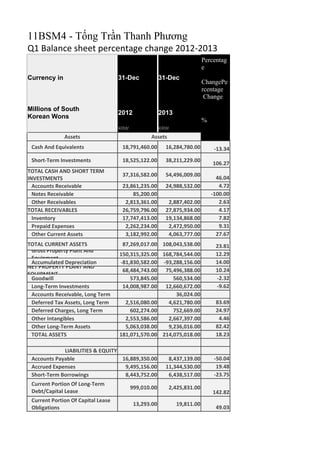
Q1 Balance sheet percentage change 2012-2013
Currency in 31-Dec 31-Dec
2012 2013
Percentag
e
ChangePe
rcentage
Change
%
KRW KRW
Assets Assets
Cash And Equivalents 18,791,460.00 16,284,780.00 -13.34
Short-Term Investments 18,525,122.00 38,211,229.00 106.27
37,316,582.00 54,496,009.00 46.04
Accounts Receivable 23,861,235.00 24,988,532.00 4.72
Notes Receivable 85,200.00 -100.00
Other Receivables 2,813,361.00 2,887,402.00 2.63
TOTAL RECEIVABLES 26,759,796.00 27,875,934.00 4.17
Inventory 17,747,413.00 19,134,868.00 7.82
Prepaid Expenses 2,262,234.00 2,472,950.00 9.31
Other Current Assets 3,182,992.00 4,063,777.00 27.67
TOTAL CURRENT ASSETS 87,269,017.00 108,043,538.00 23.81
150,315,325.00 168,784,544.00 12.29
Accumulated Depreciation -81,830,582.00 -93,288,156.00 14.00
68,484,743.00 75,496,388.00 10.24
Goodwill 573,845.00 560,534.00 -2.32
Long-Term Investments 14,008,987.00 12,660,672.00 -9.62
Accounts Receivable, Long Term 36,024.00
Deferred Tax Assets, Long Term 2,516,080.00 4,621,780.00 83.69
Deferred Charges, Long Term 602,274.00 752,669.00 24.97
Other Intangibles 2,553,586.00 2,667,397.00 4.46
Other Long-Term Assets 5,063,038.00 9,236,016.00 82.42
TOTAL ASSETS 181,071,570.00 214,075,018.00 18.23
LIABILITIES & EQUITY
Accounts Payable 16,889,350.00 8,437,139.00 -50.04
Accrued Expenses 9,495,156.00 11,344,530.00 19.48
Short-Term Borrowings 8,443,752.00 6,438,517.00 -23.75
999,010.00 2,425,831.00
142.82
13,293.00 19,811.00 49.03
Millions of South
Korean Wons
TOTAL CASH AND SHORT TERM
INVESTMENTS
Gross Property Plant And
Equipment
NET PROPERTY PLANT AND
EQUIPMENT
Current Portion Of Long-Term
Debt/Capital Lease
Current Portion Of Capital Lease
Obligations
2. Current Income Taxes Payable 3,222,934.00 3,386,018.00 5.06
Other Current Liabilities, Total 7,882,850.00 19,283,374.00 144.62
TOTAL CURRENT LIABILITIES 46,933,052.00 51,315,409.00 9.34
Long-Term Debt 5,350,631.00 2,213,783.00 -58.63
Capital Leases 101,771.00 82,402.00 -19.03
Minority Interest 4,386,154.00 5,573,394.00 27.07
1,729,939.00 1,854,902.00 7.22
Pension & Other Post-Retirement
Benefits
Deferred Tax Liability Non-Current 3,429,467.00 6,012,371.00 75.32
Other Non-Current Liabilities 2,046,504.00 2,580,141.00 26.08
TOTAL LIABILITIES 59,591,364.00 64,059,008.00 7.50
TOTAL PREFERRED EQUITY 119,467.00 119,467.00 0.00
Common Stock 778,047.00 778,047.00 0.00
Additional Paid In Capital 4,403,893.00 4,403,893.00 0.00
Retained Earnings 119,985,689.00 148,600,282.00 23.85
Treasury Stock -7,350,927.00 -7,323,432.00 -0.37
Comprehensive Income And Other -842,117.00 -2,135,641.00 153.60
TOTAL COMMON EQUITY 116,974,585.00 144,323,149.00 23.38
TOTAL EQUITY 121,480,206.00 150,016,010.00 23.49
TOTAL LIABILITIES AND EQUITY 181,071,570.00 214,075,018.00 18.23
Total assets is exceed total liabilities which means the company is performing well
Q2 Sony Samsung
3/31/2013
( USD)
Currency in
Millions of US
As of: As of:
Dollars
Assets Assets
Currency in Millions
of US Dollars
31/12/2013
(USD)
Cash And
SEhqourivt-aTleenrmts
Cash And Equivalents 6,016.90 15,394.00
Short-Term Investments 33.4 36,121.10
TOTAL CASH AND SHORT TERM Investments
INVESTMENTS
TOTAL CASH AND SHORT
TEARcMco IuNnVtsE STMENTS
ROethceeirv able
TORTeAceLi vables
RECEIVABLES
Prepaid
6,050.30 51,515.10
Accounts Receivable 7,477.60 23,621.70
Other Receivables 1,537.10 2,729.50
TOTAL RECEIVABLES 9,014.70 26,351.10
Inventory 6,837.80 Inventory 18,088.20
Prepaid Expenses 3,958.80 2,337.70
Finance Division Other Current Expenses
Assets
8,625.40
Deferred Tax Assets, Current 429.6
Other Current Assets 199.4 3,841.50
TOTAL CURRENT ASSETS 35,116.10 102,133.60
Other Current
Assets
TOTAL CURRENT
ASSETS
Gross Property Plant And
Equipment
Accumulated
Depreciation
27,853.40 159,552.00
Gross Property Plant And
Equipment
Accumulated Depreciation -19,556.70 -88,185.30
3. NET PROPERTY PLANT AND
EQUIPMENT
8,296.70 71,366.70
NET PROPERTY PLANT AND
EQUIPMENT
Goodwill 6,172.10 Goodwill 529.9
Long-Term Investments 70,364.80 11,968.10
Long-Term
Investments
Accounts Receivable, Long
Term
Deferred Tax Assets, Long
TeDremferred
Charges, Long
TOetrhmer
IOntthaenrg Libolnegs-
Term Assets
4,459.40 34.1
Finance Division Other Long-Term
Assets
Deferred Tax Assets, Long Term 1,037.00 4,369.00
711.5
Other Intangibles 5,079.90 2,521.50
Other Long-Term Assets 6,280.50 8,730.80
TOTAL ASSETS 136,806.60 TOTAL ASSETS 202,365.10
LIABILITIES & EQUITY LIABILITIES & EQUITY
Accounts Payable 15,074.40 7,975.60
Accrued Expenses -- 10,724.00
Accounts
Payable
Accrued
Expenses
Short-Term
Borrowings
Short-Term Borrowings 846.4 6,086.30
Current Portion Of Long-
Term Debt/Capital Lease
1,518.30 2,293.10
189.9 18.7
17,887.20
Current Portion Of Long-Term
Debt/Capital Lease
Current Portion Of Capital Lease
Obligations
Current Portion Of Capital
Lease Obligations
Finance Division Other Current
Liabilities
Current Income
Taxes Payable
Other Current
Liabilities, Total
Current Income Taxes Payable 723 3,200.80
Other Current Liabilities, Total 5,327.10 18,228.60
Unearned Revenue, Current 47.3
TOTAL CURRENT LIABILITIES 41,554.30 TOTAL CURRENT
LIABILITIES
48,508.50
Long-Term Debt 9,067.30 Long-Term Debt 2,092.70
Capital Leases 178.5 Capital Leases 77.9
Minority Interest 4,684.10 Minority Interest 5,268.50
50,599.30
Finance Division Other Non-Current
Liabilities
Unearned Revenue, Non-Current 189.3
Pension & Other Post-
Retirement Benefits
Deferred Tax Liability Non-
Current
2,795.30 1,753.40
Pension & Other Post-Retirement
Benefits
Deferred Tax Liability Non-Current 3,601.60 5,683.50
Other Non-Current Liabilities 2,972.30 Other Non-Current Liabilities 2,439.00
TOTAL LIABILITIES 110,958.00 60,555.00
TOTAL
LIABILITIES
4. 112.9
Common Stock 6,075.80 Common Stock 735.5
Additional Paid In Capital 10,694.40 4,163.00
Retained Earnings 10,615.10 140,471.80
Treasury Stock -43.1 Treasury Stock -6,922.80
Comprehensive Income And Other -6,177.80 -2,018.80
TOTAL COMMON EQUITY 21,164.50 136,428.70
TOTAL EQUITY 25,848.60 TOTAL EQUITY 141,810.10
TOTAL LIABILITIES AND EQUITY 136,806.60 202,365.10
Q3
As of:
NET INCOME 28,193.00
Depreciation & Amortization 14,625.30
922.1
15,547.50
Amortization Of Deferred Charges --
(Gain) Loss From Sale Of Asset 73
(Gain) Loss On Sale Of Investment -1,056.00
102.5
Other Operating Activities 2,747.80
-476.5
267.5
Change In Accounts Receivable -1,884.80
Change In Inventories -2,928.60
Change In Accounts Payable -913
Change In Other Working Capital 4,484.90
CASH FROM OPERATIONS 44,157.20
Capital Expenditure -21,893.20
356.8
Cash Acquisitions -158
Divestitures --
TOTAL
PREFERRED
EQUITY
Additional Paid
In Capital
Retained
Earnings
Comprehensive Income And
Other
TOTAL
COMMON
EQUITY
TOTAL LIABILITIES AND
EQUITY
Currency in Millions
of US Dollars
12/31/2013
( USD)
Amortization Of Goodwill And
Intangible Assets
DEPRECIATION & AMORTIZATION,
TOTAL
Asset Writedown & Restructuring
Costs
(Income) Loss On Equity
IPnrvoevsistmionen &ts Write-Off Of Bad
Debts
Sale Of Property, Plant, And
Equipment
5. -879.4
-18,320.80
Sale (Purchase) Of Intangible
Assets
Investments In Marketable &
Equity Securities
CASH FROM INVESTING -42,303.80
Short-Term Debt Issued --
Long-Term Debt Issued 25.2
TOTAL DEBT ISSUED 25.2
Short Term Debt Repaid -1,759.90
Long Term Debt Repaid -1,293.70
TOTAL DEBT REPAID -3,053.60
Issuance Of Common Stock 32.5
-1,181.40
Common And/Or Preferred
Dividends Paid
TOTAL DIVIDEND PAID -1,181.40
Other Financing Activities 266.2
CASH FROM FINANCING -3,911.10
-312
Foreign Exchange Rate
Adjustments
NET CHANGE IN CASH -2,369.80
Cash flow from assets
Cash flow from assets = opertaing cash flow - net capital spen3d5i,n2g8 6- .c2h0ange in net working capital
Operating cash flow = EBIT + depreciation - taxes 44,157.20
Net capital spending = ending net fixed assets - beginning net f-ix6e,6d2 a0s.5sets + depreciation
Change in net working capital = ending net working capital - b1e5g,4in9n1i.n5g0 net working capital
Net working capital = current assets - current liabilities 2012 38133.6
Net working capital = current assets - current liabilities 2013 53,625.10
Q4
Long term Liabilities Son7y4,087.70
Long term Liabilities Sam17S,u3n1g5.00
% Change in LL between So-n3y2 7a.n9d Samsung
Long-Term Debt Sony 9,067.30
Long-Term Debt Samsung 2,092.70
% Change in Long-term Debt between Sony- 3a3n3d. 3Samsung
Q5
Samsung doesn't pay any devident. According to Yahoo Finance
Prev Close: 1,357,000.00
Open: 1,351,000.00
Bid: 1,390,000.00
Ask: 1,392,000.00
1y Target Est: N/A
Beta: N/A
Next Earnings Date: N/A
Day's Range:
1,351,000.00 -
1,395,000.00